ISSN 1990-7931, Russian Journal of Physical Chemistry B, 2018, Vol. 12, No. 2, pp. 200–207. © Pleiades Publishing, Ltd., 2018. Original Russian Text © S.A. Nebogin, L.I. Bryukvina, N.A. Ivanov, M.D. Zimin, 2018, published in Khimicheskaya Fizika, 2018, Vol. 37, No. 4, pp. 11–19.
KINETICS AND MECHANISM OF CHEMICAL REACTIONS. CATALYSIS
Formation of Color Centers and Molecular Complexes with a Weak Hydrogen Bond in Lithium Fluoride Crystals Depending on the Form of OH¯ Inclusion S. A. Nebogina, L. I. Bryukvinab, *, N. A. Ivanova, and M. D. Ziminb aIrkutsk
National Research Technical University, Irkutsk, 664074 Russia Irkutsk Branch of the Institute of Laser Physics, Siberian Branch, Russian Academy of Sciences, Irkutsk, 664033 Russia *e-mail:
[email protected]
b
Received January 11, 2017
Abstract⎯The form of oxygen-containing inclusions in the LiF crystal was shown to be determined by the laws of isomorphic substitution and impurity accumulation in a melt during crystal growth in open air. Color centers and hydrogen-bonded complexes of different types appear in the LiF crystal after irradiation depending on the form of OH– and Mg2+ inclusions. The radiative decay of OH– ions and the properties of molecular complexes (MCs) with a weak hydrogen bond are responsible for the decreased efficiency of formation of the F- and F2-color centers and increased concentration of the positively charged F2+- and F3+-centers. Radiochemical reactions involving hydrogen and fluorine atoms and ions that compete with the formation of color centers were presented. Keywords: molecular complexes with a hydrogen bond (H bond), F-centers, luminescence, ion impurities, lithium fluoride, radiochemical decay DOI: 10.1134/S1990793118020215
INTRODUCTION Investigation of lithium fluoride crystals remains important because they are used as radiation dosimeters, laser media, and model objects for experimental and theoretical studies of impurity and radiationinduced defects in fundamental physics and chemistry. Recently, new applications have appeared due to the creation of micro and nano devices on their basis using femtosecond laser technologies such as optical data storage, optical waveguides, etc. [1–5]. The use of crystals is determined by the radiation-induced luminescent color centers (CCs) and their properties. Of great importance in the creation of CCs with given properties are cationic and anionic impurities, which are introduced in crystal intentionally or enter it in uncontrolled ways. As is known, an admixture of OH– ions (hydroxide ions) plays an important role in the formation of CCs. However, the diversity of CCs depends on whether the OH– ion enters the crystal in the form of metal complex or single ion. The aim of our study was to correlate the form of OH– inclusion in crystal and the type of radiation-created molecular complexes with a hydrogen bond (MCs with an H bond), with the formation efficiency, species diversity, and degree of aggregation of CСs in irradiated LiF crystals.
EXPERIMENTAL The LiF–Mg,OH crystal was grown by the Kyropoulos method in air in a platinum crucible from a raw material of analytical grade with a 0.1 wt % MgF2 addition in the batch. The content of magnesium and hydroxide ions in the crystal was evaluated from the IR spectra of the free and magnesium-“disturbed” OH– ions [6–8]. The crystals were exposed to γ radiation from a Co60 source at a dry ice temperature (195 K) to a dose of ~10 4 C/kg. The IR spectra were measured with a Bruker Vertex 70 Fourier spectrometer. The UV-vis absorption spectra were recorded with a UV-3600 Shimadzu spectrometer. The luminescence spectra of the samples were studied using an RF-5301PC Shimadzu spectrofluorimeter. RESULTS AND DISCUSSION Effects of Crystal Growth Conditions, Isomorphic Substitution Laws, and Impurity Accumulation in a Melt on the Form of OH– Inclusion in the LiF Lattice The grown crystal had a gradient of admixture of Mg2+–OH– complexes and OH– ions from sample 1 cut out of the initial part of the crystal to sample 4 cut out of the end portion of the crystal. It was found that at the initial stage of crystal growth, the Mg2+–OH–
200
FORMATION OF COLOR CENTERS AND MOLECULAR COMPLEXES
201
90
Transmission, %
1 70
2
50 3 30 3500
3600
3700
3800
ν, cm–1
3900
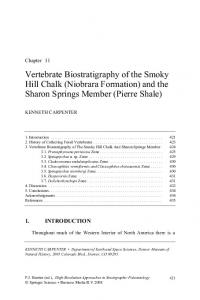
Fig. 1. IR vibration spectra of OH– ions in the LiF crystal: (1) initial, (2) intermediate, and (3) final parts of the crystal. The measurement was performed at 300 K. The thickness of all the crystals was 1 mm.
complexes (the bands in the range 3560–3670 cm–1) are built into the crystal at a higher concentration than the free OHa− ions (the 3730 cm–1 band) (curve 1, Fig. 1). In the spectrum of the crystal at one of the intermediate growth stages (sample 2), the intensity of the band of the free OHa− ions dominates over that of the bands of the Mg2+–OH– complexes (curve 2, Fig. 1). The spectrum at the final stage of growth contains only the highly intense band of OHa− ions with ν = 3730 cm–1 (curve 3, Fig. 1). The change in the form of Mg2+ and OH– inclusions in crystal during its growth can be explained from the viewpoint of the laws of isomorphic substitution and accumulation of oxygen-containing impurities in a melt during crystal growth in open air. The magnesium ion is an alkaline earth metal impurity ion that is closest to the ion of the crystal-forming alkali metal lithium in the periodic table. The Li+ and Mg2+ ions have similar ionic radii of ~0.078 nm. This means that magnesium ions can form a solid substitution solution and be integrated into the LiF lattice without deforming it. The electronegativities of the lithium and magnesium elements are also close. From Pauling’s electronegativity scale it follows that the electronegativity is 0.99 for lithium and 1.31 for magnesium. This means that magnesium and lithium are equal in their ability to form an ionic bond with fluorine. Therefore, magnesium ions can easily be integrated into the LiF lattice from the very start of crystal growth. At 600–700 K, during the heating of the batch to the melting temperature, hydrolysis of LiF begins [9] under the influence of atmospheric water vapor that contacts with the batch. During further heating, the hydrolysis is enhanced. The molecular equation of hydrolysis is LiF + H2O → LiOH + HF. The total RUSSIAN JOURNAL OF PHYSICAL CHEMISTRY B
ionic equation is recorded as Li+ + F– + H2O → Li+ + OH– + HF. Thus, as a result of hydrolysis, OH– ions are formed. The melt also contains magnesium Mg2+ ions, which appeared as a result of melting of the MgF2 activator salt. Magnesium easily forms the hydroxide Mg(OH)2 as a result of the reaction between the magnesium and hydroxide ions: Mg2+ + 2OH– → Mg(OH)2↓. However, magnesium hydroxide at the growth temperature of LiF (860°C) decomposes and dissolves in the melt. Therefore, complexes of the Mg2+OH–OH– Vc− type are isomorphically integrated into the lithium fluoride lattice [6–8]. The cation vacancy Vc− compensates the excess positive charge of the magnesium ion when isomorphically embedded into the LiF lattice.
As the crystal continues to grow in air, the melt is enriched with OH– (from water vapor present in the air) and oxygen ions (from oxygen molecules present in the air). The intensity of the IR absorption band of the free OH– ions (3730 cm–1) increases at the final stage of growth. The disappearance of the IR absorption band of the Mg2+OH–OH– Vc− complexes at the final stage relative to the initial stage of crystal growth can be explained in the following way. An increase in the exposure time of the melt in air leads to its enrichment with oxygen, which is built into the crystal mainly in the form of O2– ions. As is known, the bands in the 200–400 nm range are due to the absorption by O2– Va+ dipoles and dipole aggregates and also by O2–Mg2+ dipoles [10–12]. The increased concentration of oxygen impurities at the end of crystal growth can be judged from the absorption spectra of the nonirradiated samples measured by us. In sample 4, there are more oxygen impurities than in sample 1, as evidenced by the general rise of the absorption line from 500 to 200 nm and further
Vol. 12
No. 2
2018
202
NEBOGIN et al.
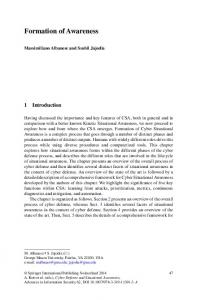
into the UV vacuum region. The spectrum of sample 4 also contains two absorption bands: at 242 and 392 nm. These bands correspond to the oxygen O2– molecular ion and more complex oxygen defects in the form of dimers of oxygen molecular ions or O2– Va+ aggregates [10–15]. At the final stage of crystal growth, magnesium oxide forms more efficiently than magnesium hydroxide because in melt it can be obtained not only by direct interaction of magnesium and oxygen, but also by thermal decomposition of magnesium hydroxide: 2Mg + O2 = 2MgO, Mg(OH)2 = MgO + H2O. The concentration of Mg2+O2– substitution complexes thus increases in the crystal lattice. In this complex, the ions have the same charge, so the compensation of the excess charge of the divalent magnesium ion by the cation vacancy is not needed. The new Mg2+O2– complexes displace the Mg2+OH–OH– Vc− complexes from the crystal, so the IR absorption bands of the latter (3560–3670 cm–1) disappear from the spectrum of the final part of the crystal. The free OH– ions continue to be integrated into the anionic lattice sites during crystal growth, and the 3730 cm–1 band in the IR spectrum increases. Thus, the peculiarities of the isomorphic replacement of lithium ions by magnesium ions and enrichment of the melt with oxygen-containing anions from the atmosphere explain that, firstly, in the IR spectrum of the initial part of the crystal, the intensities of the bands of the Mg2+OH–OH– Vc− complexes (3560–3670 cm–1) dominate over the intensity of the band of the OHa− ions (3730 cm–1). Secondly, these features account for the disappearance of the bands of Mg2+OH–OH– Vc− complexes from the IR spectrum of the end portion of the crystal and increased intensity of the band of the OHa− ions. Effect of the Type of OH– Center on the Formation of Molecular Complexes with Strong and Weak Hydrogen Bonds in LiF After irradiation of crystals, the IR spectra of the samples of the initial, intermediate, and end parts of the LiF crystal were also different. Figure 2 (curve 1) presents the IR spectrum of the irradiated LiF crystal, in which the concentration of Mg2+OH–OH– Vc− complexes is higher than that of free OHa− ions. The spectrum demonstrates a clear-cut double-peaked structure of the band in the range 1900–2300 cm–1. The complexes with a strong H bond of the O–H…F and F–H…O type absorb in this spectral region [16]. This band shape has never been observed in the spectra of irradiated LiF:Mg,OH crystals. As the concentration of Mg2+OH–OH– Vc− in crystal increases, the 1900– 2300 cm–1 band, which is nonelementary but has no
distinct maxima, generally shifts toward low frequencies. The band separation shown in Fig. 2 (curve 1) is possibly associated with the fact that the concentration of Mg2+OH–OH– Vc− complexes in sample 1 is
much higher than that of free OHa− ions. This is responsible for the presence of the magnesium band in the range 1950–2135 cm–1 in the spectrum (curve 1, Fig. 2). Along with the band at 1950–2135 cm–1 in the spectrum of the initial part of the crystal, there is a band in the range 2135–2250 cm–1 related to the OHa− ions. The relationship between the high-frequency band and the free OH– ions is confirmed by the fact that the band in the range 2135–2250 cm–1 is dominant in the spectrum of the intermediate sample (curve 3, Fig. 2). In this sample, the concentration of the OH– impurity is higher than that of Mg2+OH–OH– Vc− complexes. Each band in spectrum 1, in turn, consists of two sub-bands with maxima at (i) 1985 and 2047 cm–1 and (ii) 2160 and 2207 cm–1. The division of each band into sub-bands is evidently related to perturbation of H-bonded complexes by radiation defects lying at the neighboring lattice sites. The two clearly separated bands were visible because the crystal was irradiated at a dry ice temperature at which the aggregation of the color centers were thermally suppressed. In this case, the concentration of CCs and impurity defects adjacent to the H bond was much lower, and their effect on H-bonded MCs leading to the merging of bands was also less significant. The IR spectra (1–3, Fig. 2) contain the bands of complexes with a strong hydrogen bond in the range 1800–2300 cm–1 and no bands of complexes with a weak hydrogen bond in the range 2800–3800 cm–1. The bond strength of hydrogen bonds was characterized in [17]. The strength (and length) of the hydrogen bond is generally characterized in terms of the distance between the O and B atoms of the O–H…B hydrogen bond (RO…B). Weak hydrogen bonds form at distances longer than 2.7 Å, strong bonds appear at distances of 2.5–2.7 Å, and very strong ones at distances shorter than 2.5 Å (up to 2.2 Å). The IR bands of the stretching vibrations of hydrogen-bonded OH¯ ions (νs) generally lie at 3700–3200 (weak hydrogen bonds), 3200–1600 (strong hydrogen bonds), and 1600–600 cm–1 (very strong hydrogen bonds). The correlation between the RO…B and the stretching vibration frequency is used for classification and characterization of hydrogen bonds. The strong and very strong hydrogen bonds are characterized by a decreased wave number and increased width and integrated intensity of the stretching vibration band of OH– ions. The strong hydrogen bond causes an increase in anharmonicity and gives rise to various resonance effects. The latter are observed in the spectra in the form of Fermi resonance between the stretching vibrations of OH¯
RUSSIAN JOURNAL OF PHYSICAL CHEMISTRY B
Vol. 12
No. 2
2018
FORMATION OF COLOR CENTERS AND MOLECULAR COMPLEXES
100
203
2160 2047 1985 2207
80
Transmission, %
1 60 2 40 4 3 20
0 1500
2000
2500
3000
ν, cm–1
3500
Fig. 2. IR transmission spectra of the γ-irradiated LiF:Mg,OH crystal: (1) initial; (2, 3) intermediate; and (4) final parts of the crystal.
ions and the overtone combinations if they lie in the region of the broad band of these vibrations [16]. The band of weak hydrogen bonds at 2800–3800 cm–1 is observed only for sample 4 with high concentration of OHa− ions, in which the Mg2+OH–OH– Vc− complexes are absent. Therefore, we can conclude that the Mg2+OH–OH– Vc− complexes determine the formation of MCs with a strong H bond having absorption bands in the range 1950–2135 cm–1. The free OHa− ions promote the formation of MCs with a strong H bond having absorption bands in the range 2135–2250 cm–1 and MCs with weak and medium strength H bonds in the range 2800–3800 cm–1. As the radiation dose increases, the MCs with a weak and medium strength H bond decompose and transform into MCs with a strong H bond [18–20]. In the spectra of the samples having no bands at 2800–3800 cm–1, we have not found any U-centers (that substitute the hydrogen Ha− ions). These centers are observed in the irradiated crystal only when it has complexes with an IR band at 2800–3800 cm–1 [18]. The U-centers decompose simultaneously with the complexes that have the bands at 2800–3800 cm–1 during irradiation. Thus, for sample 1, there are no bands at 2800–3800 cm–1 and no band of U-centers at 1015 cm–1. Sample 4 has complexes with a band at 2800–3800 cm–1 and U-centers. The U-centers are not the structural units of hydrogen-bonded complexes. Then if the U-centers are excluded from RUSSIAN JOURNAL OF PHYSICAL CHEMISTRY B
hydrogen bonding, the oxygen ions that remained after the radiation decay of OH¯ ions are in excess relative to the hydrogen ions. As a consequence, oxygen and fluorine are dominant in the molecules and molecular ions that form complexes with OH– with a weak hydrogen bond that absorb in the range 2800– 3800 cm–1. Among the oxygen- and fluorine-containing compounds, there are oxygen fluorides: OF, FOO, FOF, and O2F2 [21]. In addition, the weak hydrogen bond can involve the water molecules that form during irradiation in alkali halide crystals. It was found [22] that in KCl the H2Oa− molecule is an F-center with a trapped water molecule. When the sample is heated to 250 K, the H2Oa− centers transform into the F-centers and the H2O molecule moves into the interstitial positions. It was noted [23] that the broad absorption band with a maximum at ~3200 cm–1 is characteristic of various hydrogen-bonded aggregates of H2O, HF, and HOF. The HOF molecule decomposes by the reaction 2HOF = 2HF + O2. This reaction forms HF molecules, which then participate in the formation of complexes with a strong H bond [16].
To summarize, in LiF with the Mg2+OH–OH– Vc− impurity, irradiation creates complexes with a strong H bond, which absorb in the IR range 1800–2100 cm–1, skipping the stage of formation of complexes with a weak H bond in the range 2800–3800 cm–1. In LiF with the free OH– ion impurity, complexes with a weak H bond having the bands in the range 2800– 3800 cm–1 are created at the start of irradiation. As the
Vol. 12
No. 2
2018
204
NEBOGIN et al.
D 1.5
F3
1.0 3 2 1 0.5 F 0 200
F2 300
400
4
500
λ, nm
600
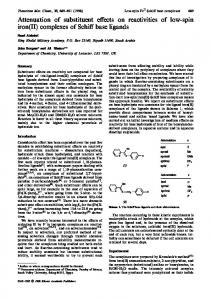
Fig. 3. Absorption spectra of the γ-irradiated LiF:Mg,OH crystal: (1) initial; (2, 3) intermediate; and (4) final parts of the crystal.
radiation dose increases, the concentration of these complexes gradually decreases to zero, while the concentration of complexes with a strong H bond in the range 1800–2300 cm–1 increases. Molecular Complexes with a Weak Hydrogen Bond in LiF and Efficiency of Formation of F-Centers Figure 3 presents the absorption spectra of γ-irradiated LiF crystals cut out of different parts of the boule. According to the spectra, the concentration of the F(250 nm), F2- (450 nm), and F3- (374 nm) centers increases with the concentration of the free OHa− ions (curves 1–3, Fig. 3). In sample 4 containing the highest concentration of OH– ions, the concentration of F- and F2-centers drastically decreased (curve 4, Fig. 3), and the concentration of F3-centers also decreased compared with that in the sample from the intermediate part of the crystal (curve 3, Fig. 3). At the same time, only sample 4 contains complexes with a weak hydrogen bond in the range 2800–3800 cm–1. Therefore, we can conclude that these complexes play the role of a factor that hinders the efficiency of formation of color centers. The mechanism of hindrance may be the competition with the formation of CCs because the structural units of the complexes with bands at 2800–3800 cm–1 are acceptors of anionic and cationic vacancies and electrons. Another reason may be the hydrogen bonding between the molecules and ions of the complex with bands at 2800–3800 cm–1 and the fluorine atoms and ions, thus hindering their participation in the formation of the primary pairs of Frenkel defects by the exciton mechanism. Indeed, the fluoride ion can form
hydrogen bonds of the F–…H–O–H (with the water molecule), F–…HnOm , O–H…FnOm types, etc. The third reason lies in the creation of U-centers in the presence of MCs with a weak H bond. These centers, resulting from the radiation decay of OH¯ ions, are neutral hydrogen atoms that trap an electron and are accommodated at the anion vacancy, competing with the formation of F-centers. Hydrogen-Bonded Molecular Complexes in LiF and Charged Color Centers
A study of the luminescence spectra of the F2+ and
F3+ color centers showed that in crystals with Mg2+OH–OH–Vc complexes, excitation with light with λexc = 645 nm mainly leads to luminescence of the centers with λmax = 730 nm (curves 1 and 2, Fig. 4). In sample 4, which has no Mg2+OHˉOHˉVc complexes, there is no luminescence at λmax = 730 nm (curve 4, Fig. 4). The stable weak bands at 700–740 nm are due to the F2Men+ Vc− or F2Men+ centers according to [24, 25]. In crystals with increased concentration of the free OH– ions and decreased concentration of Mg2+OH–OH–Vc complexes, the intensity of the luminescence band with λmax = 820 nm corresponding to the luminescence of the F2+ centers increases (curves 3 and 4, Fig. 4). An analysis of the luminescence spectra measured during excitation with light with λmax = 450 nm showed that in sample 4 with only free OH– ions, the
RUSSIAN JOURNAL OF PHYSICAL CHEMISTRY B
Vol. 12
No. 2
2018
FORMATION OF COLOR CENTERS AND MOLECULAR COMPLEXES
1000
I, arb. units
205
I, arb. units
100
4 4 500
50 3
3 2
1, 2 0 450
550
1 650
λ, nm
750
700
750
800
850
λ, nm
0 900
Fig. 4. Luminescence spectra of the (right) F2+ and (left) F3+ color centers measured on the (1) initial; (2, 3) intermediate; and (4) final parts of the LiF:Mg,OH crystal at λexc = 450 (left) and 645 nm (right).
intensity of luminescence of F3+ -centers at λmax = 540 nm is at least an order of magnitude higher (curve 4, Fig. 4) than in sample 1 with Mg2+OH–OH–Vc complexes (curve 1, Fig. 4). At the same time, the intensity of IR absorption of the MC with a strong H bond at 1800–2300 cm–1 in sample 4 is much lower than in samples 1 and 2. Therefore, in the presence of a MC with a strong H bond with bands at 1800–2300 cm–1 in the LiF crystal, the formation of positively charged F2+ - and F3+ -centers is less efficient. The complexes with a weak H bond with IR bands at 2800–3800 cm–1 have a considerable concentration in sample 4 with a higher concentration of the positively charged F2+ - and F3+ -centers but are absent altogether in samples 1 and 2. Consequently, the complexes with a weak H bond with IR bands at 2800– 3800 cm–1 stimulate the formation of positively charged F-centers. Model of a Molecular Complex with a Strong Hydrogen Bond with a Band at 1800–2300 cm–1 in LiF Crystals with Mg2+OH–OH–Vc− Complexes During irradiation in crystal with Mg2+ and OHˉ impurities, the complexes with a weak hydrogen bond with bands at 2800–3800 cm–1 do not form at all or have an extremely low concentration. From the very start of irradiation, the bands at 1800–2300 cm–1 of complexes with a strong H bond form, and their intensity increases. The radiation-induced formation of primarily complexes with a strong H bond with bands at 1800–2300 cm–1 in LiF crystals with a magnesium impurity can be explained based on the scheme suggested by T. Stoebe [7] (Fig. 5а). If all the defects RUSSIAN JOURNAL OF PHYSICAL CHEMISTRY B
involved in the formation of a hydrogen-bonded complex lie close to one another (i.e., in the first or second coordination spheres), they need not diffuse through the lattice to find a partner for the formation of a center or complex. Then the complex with a strong hydrogen bond will form immediately, skipping all the intermediate stages. As shown in [7], the hydroxide ions are accommodated in the nonirradiated starting LiF:Mg,OH crystal in three possible ways. Figure 5а presents one of the ways. The OH¯ ion (site 1) decomposes by the reaction
OH– + hν → O– + Hi0 . However, O– is unstable and captures an electron, transforming into O2– while remaining at site 1 (Fig. 5a, part II), where the OH– ion was located. This electron is liberated from the F– ion (site 7) when knocked into an interstice by the γ-quantum in the form of a neutral Fi0 atom. Then Fi0 interacts with Hi0 , forming the HF molecule, which is accommodated at site 7. The Fi0 center, which appeared from anion site 6 as a result of irradiation, is embedded in cation vacancy 5. The electron that remained at the anion vacancy abandoned by Fi0 formed an F-center (Fcc) (site 6). Therefore, all the molecular defects that form a hydrogenbonded complex lie at the sites of the cubic face-centered crystal lattice of LiF. The defects lying at sites 2, 5, and 7 form a complex with an O–H…F…H–F hydrogen bond. The complex with two strong hydrogen bonds of O–H…F…H–F type, but with atoms lying in other structural positions of the LiF lattice, was discussed in [16]. The models under study were confirmed by the overlapping bands in the range of stretching vibrations 1800–2300 cm–1 and the presence of two deformation
Vol. 12
No. 2
2018
206
NEBOGIN et al.
(a)
V2
V2
4 Li+
F–
(b) 4
V1
+
Li
OH 1
Li+
5 F– 7
F–
Li+
F–
++3 OH 2
++3 F– 6
hν
Li+
OH 2
2.2–2.5 Å
Li
O–– 1
Li+ HF 7
F–
I
O–H...F...H–F
F 5 Fcc 6
Li+
F–
2.2–2.5 Å
+
F–
Va
Vc
Va
2.014 Å
II
Fig. 5. (a) (I) Model (Stoebe [7]) of arrangement of OH¯ and Mg2+ in the 110 crystallographic plane in the starting LiF (V1 and V2 are the cation vacancies, and ++ is the Mg2+ ion) and (II) defect distribution after irradiation of the crystal; (b) distances between the structural elements of the possible complex with the O–H…F…H–F hydrogen bond.
vibrations of these hydrogen bonds in the range 1080– 1180 cm–1 [16]. The complex with the O–H…F…H–F hydrogen bond has the stretching vibration bands in the range ~2000 cm–1, as observed experimentally. The shift of the absorption band of OH– ions from 3730 to ~2000 cm–1 during hydrogen bonding is ∆ν ~ 1730 cm–1. This shift corresponds to distances RO…F and RF…F of ~2.2–2.5 Å for the complex with O–H…F…H–F (Fig. 5b) [17, 26, 27]. The distance between the anion and cation sites of the LiF lattice is 2.014 Å (Fig. 5b). The OH bond length (internuclear distance) is 0.965 Å; the internuclear distance in the HF molecule is 0.92 Å. Half of these distances is ~0.46 Å. Then 0.46 + 2.014 ~ 2.5 Å. At these distances, a strong hydrogen bond forms with absorption bands in the range ~2000 cm–1. This calculation of the dependence of the distances between the structural units of the hydrogen-bonded complex on the shift of the stretching vibration band toward low frequencies confirms the possible model presented in Fig. 5. CONCLUSIONS (1) It was shown that the band in the range 1800– 2300 cm–1 can be separated into two bands depending on the mutual redistribution of the Mg2+OH–OH–Vc impurity complexes (3500–3650 cm–1) and free OHa− ions (3730 cm–1) in the lithium fluoride crystal under the action of radiation. The Mg2+OH–OH– Vc− complexes determine the formation of MC with a strong H bond with IR bands in the range 1950–2135 cm–1. The free OHa− ions favor the formation of MC with a strong H bond with IR bands in the range 2135–2250 cm–1. Each of these bands has sub-bands due to the effect of the locally changed crystal lattice structure on the Hbonded molecular complexes. The spectral similarity
of the bands and profile shapes suggests that the complexes are similar. (2) In LiF with an Mg2+OH–OH– Vc− impurity, complexes with a strong H bond that absorb in the range 1800–2100 cm–1 are created under the action of radiation, skipping the stage of formation of complexes with a weak H bond that absorb in the range 2800–3800 cm–1. In LiF with an impurity of free OH¯ ions, complexes with a weak H bond with bands at 2800–3800 cm–1 are created from the start of irradiation. As the radiation dose increases, the concentration of complexes with a weak H bond gradually decreases to zero, while the concentration of complexes with a strong H bond that absorb in the range 1800–2300 cm–1 increases. (3) The efficiency of formation of color centers in crystals with MCs with a weak H bond and U-centers decreases. The formation of complexes with a weak H bond competes with the formation of color centers. The molecular complexes with a weak H bond with IR bands at 2800–3800 cm–1 hinder the formation of CCs and accept the radiation-created vacancies and electrons. The fluoride ions are not involved in the formation of the primary F–H pairs of Frenkel defects, while participating in the formation of complexes with a weak hydrogen bond. The U-centers that appear as a result of radiation-induced decay of hydroxide ions [28, 29] are neutral hydrogen atoms that capture an electron and are accommodated in the anion vacancy, while competing with the formation of F-centers:
OH– + hν → O– + Hi0 ,
(1)
2OH– + hν → O2− + e + Va+ + 2Hi0 ,
(2)
Hi0 + Va+ + e → Ha− ,
(3)
e + Va+ → F.
(4)
RUSSIAN JOURNAL OF PHYSICAL CHEMISTRY B
Vol. 12
No. 2
2018
FORMATION OF COLOR CENTERS AND MOLECULAR COMPLEXES
From these reaction schemes it can be seen that reactions (3) and (4) are competing. (4) The molecular complexes with a strong H bond at 1800–2300 cm–1 do not influence the efficiency of formation of positively charged F2+ - and F3+ -centers. (5) The molecular complexes with a weak H bond with IR bands at 2800–3800 cm–1 stimulate the formation of positively charged color centers. This is explained by the fact that the complexes with a weak hydrogen bond are electron traps that hinder the reaction: F2+ + e → F2. Indeed, the concentration of F2centers decreases in the presence of MCs with a weak H bond. As shown by our experiments, the concentration of F-centers also decreases, while that of F3+ -centers increases due to the reaction F2+ + F → F3+ . This reaction occurs readily because the F2+ -centers are mobile at room temperature [30]. REFERENCES 1. L. I. Bryukvina, E. V. Pestryakov, A. V. Kirpichnikov, et al., Opt. Commun. 330, 56 (2014). 2. N. A. Ivanov, V. D. Lokhnygin, G. I. Onishchukov, et al., Sov. Tech. Phys. Lett. 9, 138 (1983). 3. L. I. Bryukvina, S. V. Lipko, A. V. Kuznetsov, and E. F. Martynovich, Inorg. Mater. 50, 625 (2014). 4. L. C. Courrol, R. E. Samad, L. Gomes, et al., Laser Phys. 16, 331 (2006). 5. L. I. Bryukvina, J. Lumin. 162, 145 (2015). 6. T. G. Stoebe, J. Phys. Chem. Solids 28, 1375 (1967). 7. T. G. Stoebe, J. Phys. Chem. Solids 31, 1291 (1970). 8. L. I. Bryukvina and V. M. Khulugurov, Sov. Phys. Solid State 29, 873 (1987). 9. V. M. Khulugurov, A. G. Shneider, N. A. Ivanov, et al., USSR Inventor’s Certificate No. 814225 (1995). http://patents.su/1-990052-sposob-izgotovleniya-aktivnogo-ehlementa-tverdotelnogo-lazera.htm.
RUSSIAN JOURNAL OF PHYSICAL CHEMISTRY B
207
10. J. S. Cook and J. F. Dryden, Rad. Effect 75, 113 (1983). 11. F. Fisher, H. Gründig, and R. Hilsch, Z. Phys. 189, 79 (1966). 12. A. Chandra and D. F. Holcomb, J. Chem. Phys. 51, 1509 (1969). 13. J. Rolfe, J. Chem. Phys. 40, 1664 (1964). 14. S. Sarjiono, M. Baba, K. Nishidate, et al., Jpn. J. Appl. Phys. 43, 3461 (2004). 15. Hongen Gu, Li Han, Cuiying Song, et al., J. Lumin. 124, 1 (2007). 16. L. I. Bryukvina and N A. Ivanov, J. Fluorine Chem. 192A, 124 (2016). 17. V. M. F. Hammer, E. Libowitzky, and G. Rossman, Am. Mineral. 83, 569 (1998). 18. L. I. Bryukvina and V. M. Khulugurov, Sov. Phys. Solid State 30, 533 (1988). 19. G. V. Yukhnevich, Infrared Spectroscopy of Water (Nauka, Moscow, 1973) [in Russian]. 20. P. D. Alekseev, G. I. Gering, and T. K. Panova, Opt. Spectrosc. 73, 538 (1992). 21. M. W. Chase, J. Phys. Chem. Ref. Data 25, 551 (1996). 22. W. Rusch and H. Seidel, Solid State Commun. 9, 231 (1971). 23. P. N. Noble and G. C. Pimentel, Spectrosc. Acta A 24, 797 (1967). 24. N. A. Ivanov, V. D. Lokhnygin, A. A. Fomichev, and V. M. Khulugorov, Sov. J. Quantum Electron. 16, 1645 (1986). 25. B. V. Shulgin, V. Yu. Ivanov, A. N. Tcherepanov, et al., Phys. Status Solidi C 4, 1126 (2007). 26. K. Nakamoto, M. Margoshes, and R. E. Rundle, J. Am. Chem. Soc. 77, 6480 (1955). 27. K. M. Harmon, S. L. Madeira, M. J. Jacks, et al., J. Mol. Struct. 128, 305 (1985). 28. A. Chandra, J. Chem. Phys. 51, 1499 (1969). 29. M. L. Meistrich, J. Phys. Chem. Solids 29, 1119 (1968). 30. N. V. Shipitsin, A. I. Krivoshein, N. A. Ivanov, et al., J. Lumin. 192, 283 (2017).
Vol. 12
Translated by L. Smolina
No. 2
2018