Proc. National Conf. on Beach Preservation Technology, FSBPA, January 23-25, 2002, Biloxi, MS
Formulation of a Rip Current Predictive Index Using Rescue Data Jason Engle*, James MacMahan, Robert J. Thieke, Daniel M Hanes and Robert G Dean *Graduate Assistant, Department of Civil and Coastal Engineering, University of Florida Phone: (352) 392-9537 ext-1410; Email:
[email protected] Abstract Lifeguard rescue logs from Daytona Beach, Florida were examined in an effort to correlate rip current-related rescues with concurrent wave and wind measurements on a barred shoreline with periodically spaced rip channels. The frequency of rip current rescues increased markedly during (1) shore-normal wave incidence and (2) mid-low tidal stages. The National Weather Service’s present rip current forecasting technique was modified to include wave direction and tidal stage as predictive parameters. The inclusion of these new parameters and the elimination of two wind parameters resulted in more accurate forecasting of days with a high number of rip current rescues. 1. Introduction An examination of east-central Florida rip current data was undertaken at University of Florida to correlate rip current-related rescues with concurrent wave and weather conditions. This investigation is one component of an ongoing project funded by Florida Sea Grant at The University of Florida to formulate a rip current predictive index. Daytona Beach was selected as the focus of this study based on its relatively high number of rip current-related rescues. In Florida, rip currents cause more deaths per year, on average, than hurricanes, lightning and tornadoes combined and Volusia County records more rip-related rescues than all other Florida counties combined (Lascody 1998). A combination of frequent, strong rips and a high volume of beachgoers result in hundreds of rescues per year. During 1996, 847 people were rescued from rip currents on New Smyrna Beach and Daytona Beach in Volusia County. The determination of a predictive index for rip currents is vitally important for the protection of human life. Such an index allows governmental agencies to issue rip current warnings directly to the public and allows lifesaving corps to set-up preventative measures according to the magnitude of the rip current threat. The National Weather Service (NWS) has developed rip current forecasting techniques for the east coast of Florida and issues statements detailing rip current risk through the media, such as National Oceanographic and Atmospheric Administration (NOAA) weather radio. Lushine (1991) developed the Lushine Rip Current Scale (LURCS) an empirical forecasting technique that utilizes wind direction and velocity; swell height and the time of low tide to forecast rip current danger in South Florida. The LURCS forecasting technique was adapted for use in east central Florida (ECFL LURCS) by Lascody (1998) at which time swell period was included as a factor and the tidal factor was changed. Lascody noted that the ECFL LURCS false alarm ratio indicated that there was a need for improvement. We have developed two new predictive factors to improve the ECFL
Proc. National Conf. on Beach Preservation Technology, FSBPA, January 23-25, 2002, Biloxi, MS
LURCS scale: an improved tide factor and a wave direction factor. The inclusion of these new factors and the elimination of two wind scales were found to improve the accuracy of the ECFL LURCS scale in Volusia County. These factors will be discussed in this paper. 2. Rip Current Characteristics Rip currents are narrow, strong currents that move seaward through the surf zone (Bowen 1969). Rip currents may occur at specific locations due to interaction with shore structures such as jetties, piers and groins or due to the geometry of the shoreline such as on a beach between headlands, however rip currents also occur along straight beaches. Nearshore currents may (simplistically) be considered bounded by two limiting cases. The first is a longshore current driven by waves breaking at oblique angles to the shore. The second case is a nearshore cell circulation depicted in Figure 1 resulting from shorenormal waves. Commonly, conditions fall between these two cases and both a net longshore current and cell circulation occur simultaneously (Komar 1976).
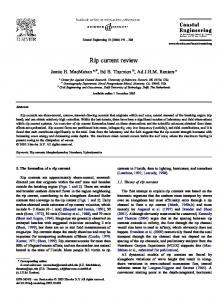
Figure 1. Schematic of a simplified nearshore cell circulation system (from Komar 1976). Shepard et al. (1941) were among the first to qualitatively describe the features and behavior of rip currents in a scientific manner. The intensity and distance that the rip currents travel from shore were found to be related to the height of the incident waves. Subsequent studies by Shepard and Inman (1950, 1951) showed that rip currents are one part of a near-shore circulation system. This system, illustrated in Figure 1, consists of the diffuse shoreward transport of water due to breaking waves, the longshore transport of water in feeder currents between the shore and bar and strong, narrow seawarddirected rip currents in the rip channels. Shepard and his colleagues also reasoned that a longshore variation of incident wave height was the forcing mechanism for the circulation system. The ability of researchers to model near-shore circulation was greatly improved when Longuet-Higgins and Stewart (1964) introduced of the concept of radiation stress and described the change in mean see level resulting from waves that encounter a sloping
Proc. National Conf. on Beach Preservation Technology, FSBPA, January 23-25, 2002, Biloxi, MS
bottom. Radiation stress is the excess flow of momentum due to the presence of waves (Longuet-Higgins and Stewart 1964). Shoreward of the breaking waves the mean sea level increases (called setup) as shown in Figure 1. This stress induces a gradient in the mean water level that balances the gradient of the radiation stress: the sea surface becomes inclined away from shore so that the maximum set-up occurs at the beach. Bowen (1969) confirmed that high waves, so long as they break continuously from the break point to the beach, would cause a greater setup than lower waves. This is principally due to (1) the fact that a higher wave will break further from shore, initiating the sea-surface gradient at position that is further seaward than a lower wave and (2) the setup is proportional to wave height squared. A longshore variation of breaking wave height will thus cause a variation in wave set up along the shore and a longshore pressure gradient develops (Bowen 1969, Dalrymple 1978). Feeder currents will flow away from zones of high waves and toward zones of low waves where they converge and move seaward as rip currents.
Figure 2. Sketch of an alternating bar and rip channel system and setup due to wave breaking (from Fredsoe 1992). The present study deals with a coast that is straight with longshore-alternating bars and rip channels (Figure 2) and relatively uniform offshore bathymetry. The bar and channel configurations are relict and can persist for weeks or months until they are reconfigured by storm events (MacMahan et al.). Analytical solutions developed by Mei and Liu (1977) described the effects of longshore varying surf zone bathymetry on longshore pressure gradients. Experiments conducted by Haller et al. (1997) confirmed that rip channels through an otherwise longshore uniform bar induce longshore pressure gradients and cell circulations in the nearshore. Wave heights were actually higher in the rip channel than over the bar due to interaction with the rip currents and the deeper bathymetry of the rip channel; however, the waves would break very close to shore in the rip channels, which reduced setup significantly. The longshore variation of setup was, thus, still highest shoreward of the bar and lowest in the rip channel. The longshore pressure gradient between the shore and bar still drives flows toward the rip channels where they converge and move seaward.
Proc. National Conf. on Beach Preservation Technology, FSBPA, January 23-25, 2002, Biloxi, MS
3. Rip Current Forecasting The ephemeral nature of rip currents complicates possible efforts to directly detect them and such an installation in the rough environs of the surf zone requires constant maintenance. For these reasons, few data records exist to document the activity and strength of rip currents in the field. Rip current rescue records provide a long-term, quantitative (although less precise) measure of rip activity and are available for many guarded beaches. The LURCS and ECFL LURCS scales presently in use were formulated by comparing rip current rescues and drownings in concert with the concurrent wind and sea state. The ECFL LURCS scale forecasts rip current threat based on four parameters including wind speed, wind direction, swell height and swell period. These scales’ performance in NWS severe weather warning verification tests (Lascody 1998) indicate the viability of rescue data in the detection of rip currents. Rip rescue records were used in this investigation as markers for the existence of rip currents at the time of the rescue. Lascody (1998) noted that Volusia County Florida accounts for a disproportionate number of rip related rescues and drownings in Florida each year as a result of both its popularity with beachgoers and features that encourage the formation of rip currents. The high frequency of rescues in Volusia County makes it a favorable location to utilize rip related rescues as a gauge of rip occurrence. The NOAA buoys near east central Florida do not measure wave direction and thus the ECFL LURCS index, which relies on offshore buoys for its wave data, does not include it as a factor. The University of Florida investigation was initiated on the assumption that wave direction would be an important parameter in the prediction of rip currents. Sonu (1972) observed that near shore circulations occurred under the action of shore-normal wave incidence and that a longshore current dominated under oblique-wave incidence. The forcing mechanism of cell circulation, the onshore flux of the onshore component of momentum, is maximized during shore-normal waves, presumably causing stronger rip currents. Lushine (1991) showed that 74% of the likely rip current drownings in southeast Florida occurred in the six-hour period from two hours before to four hours after low tide. Brander (1999) showed that flow velocity in rip channels is tidally modulated with velocity increasing towards low tide. Anecdotal evidence from the Volusia County lifeguards supported this association. This investigation was initiated with the expectation that a relationship would exist between lower mean water levels and increased rip current rescues. The ECFL LURCS scale includes a single adjustment for times of high astronomical tides, but does not account for the tidal stage when forecasting rip current threat. 4. Data Beach rescue data were acquired from Volusia County Beach Patrol rescue logs from Daytona Beach and New Smyrna Beach. Lifeguard personnel recorded every rescue
Proc. National Conf. on Beach Preservation Technology, FSBPA, January 23-25, 2002, Biloxi, MS
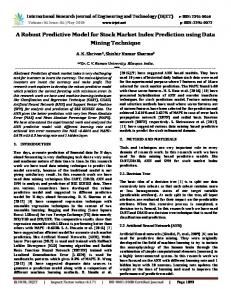
event with the time of day, location, number of victims, and type of rescue (animal bite, rip current, etc). Only the rip-related rescues have been considered in this investigation. For this study, the ECFL LURCS scale received all of its input data from NOAA National Data Buoy Center (NDBC) Station 41009 archives. Buoy 41009 is approximately 37 kilometers east of Cape Canaveral Florida in 42 meters water depth. Wind speed and wind direction were averaged over an eight-minute period and recorded on the hour. Dominant wave period and significant wave height were computed over a twenty-minute sampling period (NDBC 1996). The use of NOAA buoy data is consistent with input the scale receives for real daily forecasts. Archived directional wave data and mean water level data were not available from NOAA NDBC buoys in the vicinity of east central Florida, so directional wave and water level data were obtained from the U.S. Army Corps of Engineers Waterways Experiment Station (WES). A field measurement effort at Ponce de Leon Inlet was conducted by WES from October 1995 to November 1997 to acquire tidal inlet physical processes data (USAC 1995). A directional wave gage was deployed in 14 meters water depth and was located 4 kilometers north of the inlet and 1.5 kilometers from shore. Wave data from the Ponce Inlet directional wave gage were shoaled and refracted to deep water, assuming straight and parallel bottom contours, using linear wave theory. Tidal stages were calculated from the height of water at the wave gage after subtracting the mean water level. For coherence, wind and wave direction were transformed so that zero degrees corresponds with a shore-normal, onshore orientation. All of the wind, wave and rip rescue data were limited to the same 11 am to 5pm time of interest to reflect the hours of peak beach attendance, based on rip current rescue records. 5. Analysis Figure 2 and Figure 3 represent the normalized frequency of rip current rescues for each wind and wave parameter (light colored bars) and the frequency for the entire record (dark colored bars) for the period from March 1996 through September 1996. The entire record includes all hourly observations between 11am and 5pm during the months of interest. The number of observations were summed for each bin range and normalized by the total number of observations. The rip current rescue data are the wind and wave observations that were concurrent with each rip current rescue. For instance, if six persons were rescued between 2:30pm and 3:30pm on a given day, then the 3pm observations of each wind and wave parameter were recorded six times, one for each rescue. Of particular interest are the ranges of each parameter during which rip rescue frequency is significantly higher than that of entire record. In Figure 2a wind speeds from 1 to 3.5 m/s had frequencies of rescue that varied only 5% over that range and account for 50% of the total rescues, indicating the rescue activity is relatively uniform over those wind speeds. The significance of mild wind conditions almost certainly has to do with an increased number of beachgoers and swimmers on those mild days and not an increase in
Proc. National Conf. on Beach Preservation Technology, FSBPA, January 23-25, 2002, Biloxi, MS
rip current activity due to low wind speeds. A reduced number of rescues occurred after wind speed exceeded 8 m/s, which may be due to fewer people entering the surf. Wind direction, depicted in Figure 2b, appears to have little relationship with the occurrence of rip related rescues. Data from the Ponce Inlet directional wave gage are depicted in Figure 3. Wave periods from 7.5 to 9.0 seconds accounted for 62% of rip current rescues, and wave periods less than 6.5 seconds accounted for only 10%. These intermediate-period waves produce good surf and still allow beachgoers into the water resulting in increased frequency of rescues. Long period waves will be effected by the bottom at deeper depths and will break further from shore, resulting in a larger wave set up. Long period waves may also have
Figure 2. Normalized Frequency distributions for wind speed and wind direction, March through September 1996. significance due to their ‘groupiness’ creating pulses of the rip currents (Shepard and Inman 1950), catching bathers by surprise. Figure 3b shows 63% of all rescues occur with wave heights between 0.45 and 0.85 meters. Rescue frequency falls off at higher wave heights even though rip currents themselves are almost certainly stronger, this may again be due to either swimming bans by the beach patrol or fewer people venturing into the surf during these rougher conditions. Wave heights lower than 0.45 meter still produced almost one quarter of the rip rescues, though, indicating rip currents of some strength are present even during mild conditions.
Proc. National Conf. on Beach Preservation Technology, FSBPA, January 23-25, 2002, Biloxi, MS
Figure 3. Frequency distribution of rip current rescues and the entire data record for tidal stage and wave parameters, March through September 1996.
Proc. National Conf. on Beach Preservation Technology, FSBPA, January 23-25, 2002, Biloxi, MS
The mean water level (Figure 3c) appeared to be an important parameter in the prediction of rip currents. The range from –0.75 to –0.45 accounted for 62% of the rescues while the tide occupied that range only 42% of the time. As the mean water level drops, waves break further from shore and the set up is increased between the shore and bar. At the same time the depth of water over the bar is reduced and the rip channels become more efficient pathways for water to leave the surf zone. The position of the breaking waves directly over the bar may also influence the strength of the rip currents (Sonu 1972). It is interesting that as the mean water level drops below –0.7m the frequency of rescues drops significantly. It has been observed that the bar is exposed in some areas at low tide, which would stop the cell circulation altogether. Wave direction is depicted in Figure 3d. Zero degrees corresponds with shore normal waves. Negative directions are from the north and positive are from the south. Wave direction had a strong correlation with rip rescue activity. Wave directions between –4 and 20 degrees accounted for 56% of rescues while waves occurred in that range just 31% of the time. Only 6% of rescues occur when the direction is less than –16 or greater than 38 degrees while waves occur in those ranges 22% of the time, suggesting that rips seldom formed or were weak under large oblique wave angles. The rescue frequency is skewed toward positive angles, which is probably due to the southern swell that impacts east central Florida’s coast during the warm summer months when the beaches are most crowded. Northern swells tend to occur during the winter months when the water is cold and few people enter the surf. 6. Rip Current Rescue Forecasting The intentions of this investigation were to determine whether tidal stage and wave direction had any correlation with rip current rescue activity in Volusia County and, more importantly, to use that information to improve the forecasting of rip current threat. At least one rip current rescue occurred on 65% of the days in the period from May through August of 1996 so the Volusia County Beach Patrol is prepared for daily rip current rescues. The primary goal was to forecast those conditions that would cause a significantly greater rip current risk and a large number of rescues. The existing ECFL LURCS scale was used as a foundation for the new forecasting scale so that a legitimate assessment could be made of the new parameters’ (wave direction and tide) viability as predictors. Data gathered from the NOAA, NDBC station 41009 data archive including wind speed, wind direction, wave height and wave period were used in the ECFL LURCS index for this study. The modified scale (Figure 4) utilized wave data from the directional wave gage deployed by the Army Corps of Engineers, including wave period, wave height, wave direction and tidal stage. Tidal stage and wave direction were added and wind speed and wind direction were removed as predictive parameters in the modified scale. The wave period and wave height factors from the ECFL index were used in the modified index and were left unchanged.
Proc. National Conf. on Beach Preservation Technology, FSBPA, January 23-25, 2002, Biloxi, MS
The National Weather Service gauged the performance of its existing scale by computing a Probability of Detection (POD) and a False Alarm Ratio (FAR). POD is the accuracy of the scale, which is computed by summing every person rescued from a rip current during a day that was forecast to have rip currents and normalizing that value by the total number of persons rescued from rip currents. The FAR is a measure of overwarning, which is the percentage of days that rip currents were predicted but no rescues occurred. A new measure was devised for this study called Alarm Ratio (AR). AR is the percentage of days that the scale predicted rip currents. The scales’ utility is greatly diminished if it predicts rip currents too often so the modified ECFL LURCS’ threshold of warning was established so that the alarm ratios of both scales were as close as possible. Improvements were then reflected in the POD and FAR. Modified ECFL LURCS Checklist Example computations appear in bold.
Wave Period Period, T (s) T 15 or θ < -5 15 >= θ >= -5 Wave Direction Factor =
Factor 0 1 2 3 4 4
Wave Height Height, Ho (ft)
Factor
Ho < 1
0
Tide
1