Indonesian Journal of Electrical Engineering and Computer Science Vol. 6, No. 1, April 2017, pp. 200 ~ 206 DOI: 10.11591/ijeecs.v6.i1.pp200-206
200
Fouling Prediction Using Neural Network Model for Membrane Bioreactor System Nurazizah Mahmod, Norhaliza Abdul Wahab* Department of Control & Mechatronics Engineering, Faculty of Electrical Engineering Universiti Teknologi Malaysia, 81310 Skudai Johor Bahru, Malaysia *Corresponding author, e-mail:
[email protected]
Abstract Membrane bioreactor (MBR) technology is a new method for water and wastewater treatment due to its ability to produce better and high-quality effluent that meets water quality regulations. MBR also is an advanced way to displace the conventional activated sludge (CAS) process. Even this membrane gives better performances compared to CAS, it does have few drawbacks such as high maintenance cost and fouling problem. In order to overcome this problem, an optimal MBR plant operation needs to be developed. This can be achieved through an accurate model that can predict the fouling behaviour which could optimise the membrane operation. This paper presents the application of artificial neural network technique to predict the filtration of membrane bioreactor system. The Radial Basis Function Neural Network (RBFNN) is applied to model the developed submerged MBR filtration system. RBFNN model is expected to give good prediction model of filtration system for estimating the fouling that formed during filtration process. Keywords: membrane bioreactor, fouling, artificial neural network, radial basis function Copyright © 2017 Institute of Advanced Engineering and Science. All rights reserved.
1. Introduction Membrane bioreactor has become one of the popular technologies in filtration systems and has become a requirement in wastewater treatment technology. Membrane bioreactors (MBRs) can be defined as integrating biological degradation system of waste products with membrane filtration. Membrane bioreactor is one of the technologies to replace conventional activated sludge because MBR can be classified as the best alternative solution. A lot of advantages has been discovered by using membrane bioreactors over conventional technologies [1]. Therefore, membrane becoming popular for wastewater treatment [2-4]. Membrane bioreactor has been verified to be very competent since it able to give better treatment in waste water in term of producing good and high quality effluent. MBR is a waste water technology that combines the biological process and membrane filtration system. Membranes bioreactors also enable high removal efficiency of chemical oxygen demand (COD) and biological oxygen demand (BOD), low production of excess sludge and allow high concentrations of mixed liquor suspended solids (MLSS), and water reclamation. Membrane bioreactor technology has recently attracted extraordinary attention because of the advantages over conventional activated sludge process, the growing demand for water reclamation, more stringent emission standards and steady decline in the cost of the membrane [5-9]. In addition, MBR technology also have a very good quality effluent, higher load ume, good disinfection ability, reduced footprint and sewage production, improved nitrification and process flexibility towards changes in the influent [10]. However, membrane fouling is a main problem to the wide application of MBRs [5]. Fouling in MBRs contribute to sludge cake deposition and pore clogging on membranes [11]. With respect to membrane bioreactors, membrane fouling caused by the deposition of sludge flocs to the surface of the membrane, adsorption of dissolved or colloidal materials within / on the membrane, the detachment foulants mainly due to shear forces, the formation of a layer cake on the surface of the membrane and a change in the composition of space and time foulant during long -term operations [5]. Membrane fouling results in a reduction of permeate flux or an increase of transmembrane pressure (TMP) depending on the operation mode. Fouling affects also decreased plant productivity, lead to a higher replacement costs, inefficient Received December 22, 2016; Revised February 24, 2017; Accepted March 10, 2017
IJEECS
ISSN: 2502-4752
201
or through a chemical cleaning may reduce the lifespan of the modules' and high energy requirement for aeration and destructive [4]. However, if not handled carefully it will caused lower filtration output and higher operating costs [12]. In the literature to date, ANNs have been used for classification [13], simulation [14-16], monitoring [17] and controlling [18] of membrane bioreactor processes of wastewater treatment plants. Submerged membrane flocculation hybrid systems for synthetic waste water treatment filtration model was developed by [19] using different types of neural network structure. The modelling results of Radial basis function neural network (RBFNN), general regression neural network (GRNN) and Multilayer perceptron neural network (MLPNN) was compared in term of its performance. The input of the model are filtration time and coagulation dose, while the permeate pH, permeate DOC and transmembrane pressure are the output of the model. All of the three types of ANN structure give better prediction of the transmembrane pressure profile during the process of filtration. In addition, the work by [20] developed two types of feedforward artificial network which are radial basis function (RBF) and multilayer perceptron (MLP) to achieve of this work. The selection of RBF and MLP are because of their capability to detect complex nonlinear relationships in the data. The RBF uses hyperspheres while MLP employs hyperplanes to divide the pattern space into various classes [21]. The input of the model is filtration time, cross-flow velocity, temperature, TMP, feed pH while the output is permeating flux. The result shows that ANN technique has a good performance and high accuracy. According to the result, the most significant one is filtration time, and then followed by temperature, cross-flow velocity, feed pH and transmembrane pressure. Then, RBFNN have been effectively applied for solving problems of dynamic system because the prediction of the behaviour is directly achieved from input and output data [22], [23]. The RBFNN has the advantages of an adaptation capability, robust ability, learning stage without any iteration of updating weights and fast learning of the process. The structure of the basic RBFNN consisted of one input layer, one output layer and one hidden layer. The work by [24] was applied the RBFNN to model the effluent quality parameters of an SMBR treating combined industrial and municipal wastewater. The inputs for RBFANN model are HRT, pH, mixed liquor atile suspended solids (MLVSS), total dissolved solids (TDS), and influent concentration of parameters. The best results showed that the training and testing for effluent COD, BOD, TP and NH4 −N were successful.
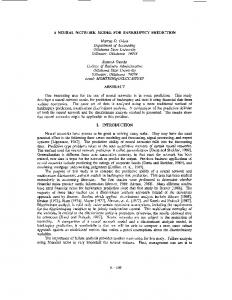
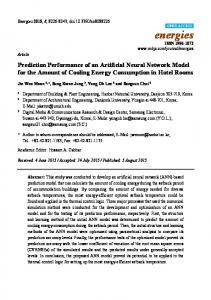
2. Research Method 2.1. Radial Basis Function Neural Network Treatment process models are crucial tools to ensure appropriate operation and better control of waste water treatment plants [25, 26]. It is important to have a good of MBR filtration model that can predict the filtration dynamic performance especially the effect of fouling to the physical cleaning mechanisms such as aeration air flow, backwash and relaxation [12]. With this model a simulation of filtration performance can be optimized and control. Radial Basis Function Neural Network algorithm has been proven to be useful and beneficial in many industrial applications. As the development of RBF algorithm progresses until now, we can see that RBF has its own structure and network topology. The general RBF architecture can be represented in Figure 1. RBF are consists of several layers. It made up of a number of interconnected nodes that contain an activation function. Patterns are presented to the network via the input layer, which communicates to one or more hidden layers where the actual processing is done via a system of weighted connections. The hidden layers then link to an output layer where the answer is output as shown in Figure 1.
Fouling Prediction Using Neural Network Model for Membrane… (Nurazizah Mahmod)
202
ISSN: 2502-4752
Figure 1. Basic RBFNN Structure
The network can be represented as follows: ( )
∑
( )
(1)
Where i= 1,2,3,4 …k, The output of the hidden layer is given by: ( )
(
()
()
)
(2)
𝑥 is the input vector, 𝑐 is the center of the hidden node, k is the number of hidden nodes, 𝜓 is the width of hidden node, is the weight number of output layer and indicates the output of the network. 2.2. Performance Evaluation In this work, the performance of prediction of permeate flux for all method was based on 2 three criteria which are correlation coefficient (R ), mean square error (MSE) and mean absolute deviation (MAD). The equation of MSE and MAD are given in equations (3) and (4), respectively.
MSE Where
yˆ
yi
i
2
(3)
N
yi is the actual value from the measurement data, yˆ i is the predicted value and and N is
the number of data point.
MAD
w wˆ i
2
i
N
(4)
Where wᵢ is the actual value from the measurement data, ŵᵢ is the predicted value and and N is the number of data point. 2.3. Experimental Setup The experiments were carried out from previous researcher [12] in three double-walled cylindrical column bioreactors. The palm oil mill effluent (POME) with the ume 20L were taken from Sedenak Palm Oil Mill Sdn. Bhd. Johor, Malaysia. The plant was operated with 90 second permeate and 30 second for relaxation period. The temperatures of working for the bioreactors were at 27 ± 1 °C. The airflow rate at the first half of the experiment is maintained around 8 SLPM while the airflow was lowered down to about 5 SLPM at the second half of the IJEECS Vol. 6, No. 1, April 2017 : 200 – 206
IJEECS
ISSN: 2502-4752
203
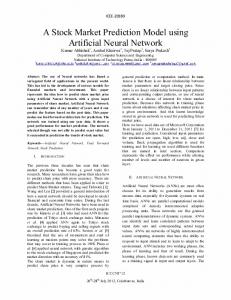
experiment. Figure 2 shows schematic diagram of the pilot plant setup for the experiment. The data plant was controlled and monitored using Labview 2009 software, National Instruments, with NI USB 6009 interfacing hardware.
Figure 2. Schematic of Submerged MBR Pilot Plant
Table 1 shows the list of parts used in the pilot plant development.
Table 1. List of parts/instruments Tag No C-101 PV-101 FA-101 PI-101 SV-101 SV-102 P-101 P-102 FM-101 Membrane
Description 20L 2HP Air Compressor Proportional Valve Airflow Sensor Pressure Tranducer Solenoid Valve Permeate Stream Solenoid Valve Backwash Stream Peristaltic Pump Diaphragm Pump Liquid Flow Meter Hollow Fiber Membrane
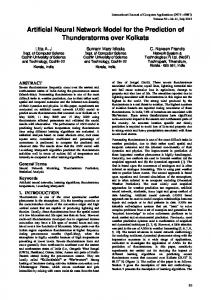
3. Results and Analysis The data collected from previous researcher was divided into two set of data. The first data is set as training data was taken 60% from the overall data. While, another set is 40% testing data. The data have two inputs which are aeration airflow and TMP. The output of the data is permeate flux. Figure 3 shows the comparison between RBFNN and FFNN of training data for aeration airflow input. In terms of the evaluation performance, both methods gave almost similar performance and are able to match the flux decline. This performance can be 2 proven by evaluation criterion used where %R , MSE and MAD. RBFNN and FFNN showed 2 almost similar result with the score 85.38% and 84.94% for R respectively. MSE performance for both RBFNN and FFNN are 0.0068 and 0.0065, respectively. Then, the MAD for RBFNN is 0.0440 while 0.0443 for FFNN. Figure 4 shows the training data using TMP input. Only small deviations can be 2 observed from both of the methods. From the graph, the R performance for RBFNN and FFNN are 84.76% and 80.77%, respectively. Meanwhile, the MSE for RBFNN and FFNN are at the 0.0074 and 0.0087, respectively. The MAD score is 0.0405 for RBFNN and 0.0889 for FFNN.
Fouling Prediction Using Neural Network Model for Membrane… (Nurazizah Mahmod)
204
ISSN: 2502-4752 30 Actual RBFNN FFNN
Flux (l/m2h)
25 20 15 10 5 0 0
100
200
300
400
500
600
700
800
900
Data
Figure 3. Training for aeration airflow
30 Actual RBFNN FFNN
Flux (l/m2h)
25 20 15 10 5 0 0
100
200
300
400
500
600
700
800
900
Data
Figure 4. Training for TMP
Then, 40% from overall data is set as testing data. Figure 5 shows the comparison of both method RBFNN and FFNN with the actual data for aeration airflow input. From the observation, both of the methods were able to predict the slope and the small flux reduction in 2 the cycle. The R for the RBFNN and FFNN are 95.81% and 94.44%, respectively. The MSE performance is 0.0094 for RBFNN and 0.0091 for FFNN. Meanwhile, MAD for RBFNN and FFNN are 0.0332 and 0.0377, respectively.
Flux (l/m2h)
20 Actual RBFNN FFNN
15
10
5
0 0
100
200
300
400
500
600
Data
Figure 5. Testing for Aeration Airflow
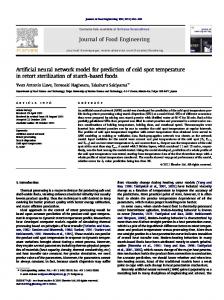
Figure 6 shows the graph of testing data using TMP input.This data shows fast 2 permeate flux decline in every cycle. From the graph, the R performance for both techniques shows RBFNN score almost 93.93% while only 85.05% scored by the FFNN method. For the MSE criteria, RBFNN gives 0.0079 while the FFNN with 0.027. The MAD criteria show 0.0402 achieved by the RBFNN while the FFNN shows poor performance with 0.0878 for this criteria evaluation. The RBFNN gives more accurate and reliable prediction compared with the FFNN technique. IJEECS Vol. 6, No. 1, April 2017 : 200 – 206
IJEECS
ISSN: 2502-4752
205
Flux (l/m2h)
20 Actual RBFNN FFNN
15
10
5
0 0
100
200
300
400
500
600
Data
Figure 6. Testing for TMP
Table 2 presents the performance evaluation for both methods in the training and testing data.
Table 2. Performance Evaluation Data
Method
%R2
MSE
MAD
Training Airflow
RBFNN FFNN RBFNN FFNN RBFNN FFNN RBFNN FFNN
85.38 84.94 84.76 80.77 95.81 94.44 93.93 85.05
0.0068 0.0065 0.0074 0.0087 0.0094 0.0091 0.0079 0.0270
0.0440 0.0443 0.0405 0.0889 0.0332 0.0377 0.0402 0.0878
Training TMP Testing Airflow Testing TMP
4. Conclusion Membrane bioreactor became an important technology in wastewater treatment process nowadays. High concern on the environment pollution and stringent requirement of effluent requirement makes this technology getting more attention worldwide. Successful operation in MBR is much depends on the membrane filtration performance. This paper presented the measurement and prediction of permeate flux in the submerged membrane bioreactor filtration using RBFNN and FFNN. From the result, RBFNN give good prediction in the training and testing data. RBFNN also was more reliable and accurate for the permeate flux prediction. A precise prediction model is important to ensure the effectiveness of the control design. An appropriate modelling technique must be considered because this model will determine the true dynamic of the filtration system that will be used as a foundation in the design of advanced control system.
Acknowledgement The authors wish to thank Universiti Teknologi Malaysia, GUP UTM grant vote 13H70 for its financial support.
References [1] T Stephenson, S Judd, B Jefferson, K Brindle, IW Association. Membrane bioreactors for wastewater treatment: Citeseer. 2000. [2] T Miyoshi, T Aizawa, K Kimura, Y Watanabe. Identification of proteins inved in membrane fouling in membrane bioreactors (MBRs) treating municipal wastewater. International Biodeterioration & Biodegradation. 2012; 75: 15-22. [3] M Kraume, A Drews. Membrane bioreactors in waste water treatment–status and trends. Chemical engineering & technology. 2010; 33: 1251-1259. [4] A Drews. Membrane fouling in membrane bioreactors-characterisation, contradictions, cause and cures. Journal of Membrane Science. 2010; 363:1-28.
Fouling Prediction Using Neural Network Model for Membrane… (Nurazizah Mahmod)
206
ISSN: 2502-4752
[5] F Meng, SR Chae, A Drews, M Kraume, HS Shin, F Yang. Recent advances in membrane bioreactors (MBRs): membrane fouling and membrane material. Water research. 2009; 43: 14891512. [6] J Svojitka, T Wintgens, Melin. Treatment of landfill leachate in a bench scale MBR. Desalination and Water Treatment. 2009; 9: 136-141. [7] H Lin, W Gao, F Meng, BQ Liao, KT Leung, L Zhao, et al. Membrane bioreactors for industrial wastewater treatment: a critical review. Critical reviews in environmental science and technology. 2012; 42: 677-740. [8] H Hong, W Peng, M Zhang, J Chen, Y He, F Wang, et al. Thermodynamic analysis of membrane fouling in a submerged membrane bioreactor and its implications. Bioresource technology. 2013; 146: 7-14. [9] H Yu, H Lin, M Zhang, H Hong, Y He, F Wang, et al. Membrane fouling in a submerged membrane bioreactor with focus on surface properties and interactions of cake sludge and bulk sludge. Bioresource technology. 2014; 169: 213-219. [10] H Lin, M Zhang, F Wang, F Meng, BQ Liao, H Hong, et al. A critical review of extracellular polymeric substances (EPSs) in membrane bioreactors: characteristics, roles in membrane fouling and control strategies. Journal of Membrane Science. 2014; 460: 110-125. [11] J Lee, WY Ahn, CH Lee. Comparison of the filtration characteristics between attached and suspended growth microorganisms in submerged membrane bioreactor. Water Research. 2001: 35: 2435-2445. [12] Z Yusuf, NA Wahab, S Sahlan. Modeling of submerged membrane bioreactor filtration process using NARX-ANFIS model. Control Conference (ASCC), 2015 10th Asian. 2015: 1-6. [13] Ö Çinar. New tool for evaluation of performance of wastewater treatment plant: artificial neural network. Process Biochemistry. 2005; 40: 2980-2984. [14] JC Chen, N Chang, W Shieh.Assessing wastewater reclamation potential by neural network model, Engineering applications of artificial intelligence. 2003; 16: 149-157. [15] B Raduly, KV Gernaey, A Caodaglio, S Mikkelsen, M Henze. Artificial neural networks for raid WWT erformance evaluation: Methodology and case study. Environmental Modelling & Software. 2007; 22: 1208-1216. [16] D Hanbay, I Turkoglu, Y Demir. Research Article rediction of Chemical Oxygen Demand (COD) Based on Wavelet Decomosition and Neural Networks. 2007. [17] SH Hong, MW Lee, DS Lee, JM ark. Monitoring of sequencing batch reactor for nitrogen and hoshorus removal using neural networks. Biochemical Engineering Journal. 2007; 35; 365-370. [18] G Zeng, X Qin, L He, G Huang, H Liu, Y Lin. A neural network redictive control system for aer mill wastewater treatment. Engineering Alications of Artificial Intelligence. 2003; 16: 121-129. [19] L Erdei, S Vigneswaran, J Kandasamy. Modelling of submerged membrane flocculation hybrid systems using statistical and artificial neural networks methods. Journal of Water Suly: Research and Technology-Aqua. 2010; 59; 198-208. [20] M Bagheri, SA Mirbagheri, AM Kamarkhani, Z Bagheri. Modeling of effluent quality arameters in a submerged membrane bioreactor with simultaneous uward and downward aeration treating municial wastewater using hybrid models. Desalination and Water Treatment. 2015; 1-22. [21] B Suchacz, M Wesołowski. The recognition of similarities in trace elements content in medicinal lants using ML and RBF neural networks. Talanta. 2006; 69; 37-42. [22] S Ferrari, F Bellocchio, V iuri, NA Borghese. A hierarchical RBF online learning algorithm for realtime 3-D scanner, Neural Networks. IEEE Transactions on. 2010; 21; 275-285. [23] HG Han, JF Qiao. rediction of activated sludge bulking based on a self-organizing RBF neural network. Journal of rocess Control. 2012; 22: 1103-1112. [24] SA Mirbagheri, M Bagheri, S Boudaghour, M Ehteshami, Z Bagheri. Performance evaluation and modeling of a submerged membrane bioreactor treating combined municial and industrial wastewater using radial basis function artificial neural networks. Journal of Environmental Health Science and Engineering. 2015; 13; 1. [25] D Guclu, S Dursun. Artificial neural network modelling of a large-scale wastewater treatment lant oeration. Biorocess Biosyst Eng. 2010; 33: 1051-8. [26] AR endashteh, A Fakhru'l-Razi, N Chaibakhsh, LC Abdullah, SS Madaeni, ZZ Abidin. Modeling of membrane bioreactor treating hyersaline oily wastewater by artificial neural network. J Hazard Mater. 2011; 192: 568-75.
IJEECS Vol. 6, No. 1, April 2017 : 200 – 206