produces results which appear smooth and better express the underlying ...... image reconstruction for four-dimensional PET. Med Phys 33(5),. 1288-1298 ...
Open Access Article Open Access Article
Technology in Cancer Research and Treatment ISSN 1533-0346 Volume 13, Number 6, December 2014 © Adenine Press (2014)
The The authors, thethe publisher, authors, publisher,and andthe theright right holders grant thethe right totouse, holders grant right use,reproduce, reproduce, disseminate thework workinindigital digital form form andand disseminate the all users. to alltousers.
Four-dimensional (4D) Motion Detection to Correct Respiratory Effects in Treatment Response Assessment Using Molecular Imaging Biomarkers www.tcrt.org DOI: 10.7785/tcrt.2013.600255 Observing early metabolic changes in positron emission tomography (PET) is an essential tool to assess treatment efficiency in radiotherapy. However, for thoracic regions, the use of three-dimensional (3D) PET imaging is unfeasible because the radiotracer activity is smeared by the respiratory motion and averaged during the imaging acquisition process. This motioninduced degradation is similar in magnitude with the treatment-induced changes, and the two occurrences become indiscernible. We present a customized temporal-spatial deformable registration method for quantifying respiratory motion in a four-dimensional (4D) PET dataset. Once the motion is quantified, a motion-corrected (MC) dataset is created by tracking voxels to eliminate breathing-induced changes in the 4D imaging scan. The 4D voxeltracking data is then summed to yield a 3D MC-PET scan containing only treatment-induced changes. This proof of concept is exemplified on both phantom and clinical data, where the proposed algorithm tracked the trajectories of individual points through the 4D datasets reducing motion to less than 4 mm in all phases. This correction approach using deformable registration can discern motion blurring from treatment-induced changes in treatment response assessment using PET imaging.
Eduard Schreibmann, Ph.D.1* Ian Crocker, M.D.1 David M. Schuster, M.D.2 Walter J. Curran, M.D.1 Tim Fox, Ph.D.1 Department of Radiation Oncology,
1
Emory University School of Medicine and Winship Cancer Institute of Emory University, Atlanta, GA, USA Department of Radiology, Emory
2
University School of Medicine, Atlanta, GA, USA
Key words: Positron emission tomography; Treatment response assessment; Thoracic motion.
Introduction The use of images as biomarkers for treatment monitoring relies on observing treatment induced changes in repeated image datasets. Positron emission tomography (PET) is one of the most sensitive and specific functional imaging modalities that can be used for therapy response assessment. In this approach, patients are imaged at least twice, where the baseline PET scan is acquired up to a week before the start of treatment, and a follow-up scan acquired after the first half of therapy. Treatment efficiency is evaluated by comparing changes between the two datasets (1, 2). However, as changes in standard uptake values (SUV) from PET imaging are typically used to monitor the treatment process, it is essential to discern changes induced by the treatment itself from any other non-treatment related factors. To date, this promising method has been applied mainly to non-deforming anatomical sites that are not affected by respiratory motion such as head and neck tumors. For such sites, voxels in the pre and post treatment scan can be correlated though rigid image registration. However, for soft-tissue carcinomas, displacements and deformations occur and the classical 3D scans cannot be easily compared directly as tissues moves during imaging as well as between
*Corresponding author: Eduard Schreibmann, Ph.D. Phone: 11 404 778 5667 Fax: 11 404 778 4139
571
572 d atasets acquired before and after treatment. For example, pixel intensity values (or SUVs) in standard thoracic PET scans are imperfect as the signal is averaged and blurred by respiratory motion. This is a well-documented result, with several groups having investigated this effect (3-5). Pevsner and collaborators (6), reported changes of up to 70% in the maximum SUV value when the respiratory motion is ignored with the largest degradation observed for small lesions that are the focus of clinical treatment evaluations. For comparison, treatment induced changes in standard PET-CT were on the order of 20% of the original SUV value after two weeks of treatment (7) which is comparable or less than motioninduced inaccuracies previously reported. Because the motioninduced errors occur during scanning and are p resent in the reconstructed datasets, a simple post-acquisition c orrelation using either rigid or deformable registration cannot recover the SUV values that would have been recorded in the absence of anatomical motion. Recently, state-of-the-art medical PET scanners allowing acquisition of dynamic or 4D images (in which a section of the body is repeatedly imaged in order to capture physiological motion) are becoming increasingly utilized in medicine (5). The result of a 4D tomographic imaging session is a set of typically 10 static 3D images sampling the patient’s anatomy at different phases of the breathing cycle. While 4D imaging was developed to allow visualization of motion during the breathing cycle, it is typically used by clinicians to visually assess individual tumor excursion during the breathing cycle and design treatment margins tailored to the motion. Significant respiratory motion information in the 4D dataset is ignored clinically mainly due to a lack of mathematical tools to analyze and extract this information from these large-scale datasets. Deformable image registration has been reported previously for various applications in radiation therapy and is available in a few commercial software packages. In the following we present a novel application of a classical basis spline (Bspline) deformable registration algorithm that is employed here to describe the respiratory motion and track the trajectories of individual points through the 4D dataset to obtain a highly accurate motion-free description of tracer uptake in the patient. In previous research, deformable registration was used clinically mainly to account for local changes such as displacement and deformation of soft-tissue anatomical structures after images have been acquired. The concept will be adapted here in a new application using a modified formalism to track motion in 4D PET (8) and create images where the effect of respiratory motion on the SUV values is diminished. We are encouraged in our attempt by recent reports using sequences of 3D deformable registration to correct for respiratory motion during 4D PET acquisition. For example,
Schreibmann et al. Bai & Brady (9) use a regularized BSpline algorithm to match anatomy between different phases of a 4D PET dataset to reduce imaging noise. Lamare et al. (10) employs a deformable registration model to correct for breathing motion in the reconstruction algorithm directly, with the main advantage of the BSpline model being it’s ability to model breathing motions of variable amplitudes (11-14). The novelty of the proposed method comes from simultaneously registering the datasets in both space and time for a better and smoother simulation of the patient’s respiratory motion. If successful, voxel trajectories obtained from the 4D deformable registration present a smooth description of the respiratory motion of the 4D PET scan that can be incorporated in the form of a post-acquisition correction to annihilate the breathing motion (11) to produce a motion-free dataset containing only variations introduced by molecular changes. By extending the BSpline algorithm in four dimensions, on create a mathematical model that interpolates to create a smooth representation on the time axis that is consistent with the expected behavior of this anatomical motion in a specific deformable registration setup customized to the image quality of a 4D PET dataset to analyze the acquired dataset and recover the unknown anatomical motion. Generally speaking, there is a difference between acquiring and analyzing a dataset. The first concept is directly related to the observation of a measurable variable over a period of time. For meaningful results to be obtained, acquired data is usually fitted with a mathematical function to produce a smooth representation of the data, independent of acquisition errors or corrupted measurements. One of the most commonly used ways to analyze experimental data is to fit the coefficients of a polynomial model to match the measured data, fact achieved in our approach automatically by usage of the BSpline model that fits the data on the temporal axis. Especially important in PET imaging, measured data is subject to noise and motion artifacts. In contrast, fitting a model to represent the data produces results which appear smooth and better express the underlying anatomical movement. The question we asked was if a mathematical model can be devised and extended to fit the information in the 4D dataset both in space and time, with the aim of describing the anatomical motion produced by breathing with an analytical expression. The advantages of using an analytical expression to model breathing motion are (a) the analytical expression has a compact parametric representation, so calculations of displacements and tracking of any point can be done easily; (b) analytical expression smoothes the dataset, thus eliminating noise and artifacts; (c) calculated deformation values are continuous both in time and space, as would be natural for the breathing movements; (d) the model is differentiable, providing information on temporary speed in any point; (e) the model does not make any a-priori assumption on the breathing movements; and (f) the
Technology in Cancer Research & Treatment, Volume 13, Number 6, December 2014
4D Motion Correction for PET Response Assessment mathematical expression deduced from the dataset significantly reduces memory requirements, enabling easy storage and handling of the final data. We present in the following application of a time-resolved deformable registration algorithms to track respiratory motion in 4D PET datasets and report its accuracy on both phantom and patient imaging data. Methods 4D Deformable Registration to Analyze Motion To deal with the high level of noise in 4D PET datasets, a deformable registration based on the BSpline concept was extended to consider an additional set of coefficients on the time axis. Classical approaches that typically estimate deformation sequentially from one frame to another are discontinuous in time when noise and artifacts are present (15). To overcome the poor quality of 4D PET images, we propose a spatial-temporal registration framework where all 3D sequences taken at different time-points are simultaneously registered together. The 4D BSpline registration model (16, 17) ensures smoothness, globalization and continuity of the resulting respiratory transform (18-21) by the interpolation between the temporal component of the BSpline nodes.
573
Therefore, it produces an approximation of the patient’s organ motion during the whole breathing cycle. This motion is described as location-dependent displacements with varying intensities during different time points in the breathing cycle. Registration Setup and Settings The motion model, D(x, t), is described by the BSpline model due to its simplicity and efficiency in approximating the smooth thoracic motion. In the 4D BSpline model, the deformation is defined on a sparse grid of nodes spanning the extent of the static image in both spatial and temporal directions. For the registration we selected a 4D spatio-temporal BSpline model that superimposes over the 4D image in both spatial and temporal directions a grid of nodes, with a fourdimensional displacement vectors {xi} characterizing tissue deformation. The displacement at a location x on the image is deduced by fitting a polynomial expressed using the BSpline (33, 34) to the grid nodes xi. The polynomial fitting represents good trade-off between describing local anatomical motion and interpolating the noise inherent in the PET dataset. Optimal nodes are obtained by an optimization procedure that iteratively modifies the node values {xi} until the dynamic series, warped with the deformation, matches the static series as quantified by a multi-modality registration metric.
Static and Dynamic Datasets Construction To allow the deformable model to quantify respiratory motion, the proposed approach registers the acquired 4D PET dynamic image sequence containing the SUV values corrupted by the moving anatomy (termed in the following dynamic series) to a new artificially constructed motion-free static image sequence which repeats the start-of-breathing image at different time-points (termed in the following static series). The dynamic series is composed of the acquired 4D image bins and samples the patient respiration at different stages of the respiratory transform containing the information of the moving anatomy. This is mathematically described as an image sequence I(x, t), where I represents the image intensity at a voxel x, in the time sequence quantified by t, where t 5 0,...,N21, with N being the number of bins in the 4D dataset. The static series is a 4D image that repeats the start-of-breathing image Ic(x, t0) as images at N different time-points. Matching the dynamic to the static image through deformable registration deduces an expression of the displacement field D(x, t) that annihilates the motion in the dynamic image.
The mutual information metric has increased versatility in judging the value of a particular match as it does not assume that a structure is represented by the same voxel intensity in the images to be registered. Classical mono-modality registration metrics assume voxels are imaged with the same or linearly changing intensity between the images to be aligned and thus can be described by a linear relationship between intensities. This is not always the case, as noise and changes in imaging conditions are present in the phases of a 4D datasets, with more general metric preferred to describe the relation between the datasets to be registered. The mutual information metric is a measure that does not assume any a-priory relation between voxel intensities, but as a statistical measure it rather evaluates a match through the number matches in intensity patterns as defined by the statistical measure of entropy. When the images are aligned, the number of matching intensity patterns is minimal, while when the images are displaced, the number of matching intensities increases. This metric is usually coupled with a rigid or deformable transform to align the images under the guidance of an optimizer. In our particular implementation we used the Mattes formulation (16) of the mutual information metric that is minimized using the L-BFGS-B algorithm (22, 23) due to its superior convergence rates on large scale problems achieved through the usage of a low-rank approximation of the Hessian matrix during the
Technology in Cancer Research & Treatment, Volume 13, Number 6, December 2014
574 minimization. Termination condition for the L-BFGS algorithm when the cost function decreases with less than 1026 or when 100 iterations are achieved. Settings for the metric were 25 histogram bins and 10% samples. Algorithm Accuracy For an improved and quantitative algorithm evaluation of the motion in the 4D dataset we use a surface comparison tool as shown in Figure 1. First, we select a surface that is both of clinical interest and visible in both datasets to be compared, such as the sphere inset in the phantom case, or the tumor in the clinical case. This surface is extracted independently from all phases of a dataset using a marching cube algorithm (24), a fully automated segmentation algorithm taking as only parameter the SUV value of the structure to be segmented. To mathematically quantify registration errors, we compute the distances between the surface extracted from the first phase and the same surface extracted from the subsequent datasets. For every point in the surface obtained from the first phase, the distance to the closest cell of the corresponding surface extracted from subsequent phases is calculated and stored. When the calculation for each point is completed, the surface is color coded according to the calculation results, with blue assigned to the minimum distance and red assigned to the maximum distance.
Schreibmann et al. Datasets Phantom Case We used a dynamic QUASAR™ Respiratory Motion QA phantom (Modus Medical, London ON, Canada) to mimic patient motion for our PET-based biomarker analysis approach. The phantom is designed to move existing insets with programmable respiratory and sinusoidal motion profiles. Phantom spheres were filled with target-to-background 18 F-FDG activity concentration ratio of approximately 8:1 (1–0.12 µCi/cc). The 8:1 target-to-background ratio was chosen to simulate an average lesion-to-background activity observed in PET/CT images and suggested by NEMA to be used in PET scanners acceptance testing for simulation of lung tissue. A 4D PET series of motion with cycle amplitude and excursion chosen to be consistent with values observed in the real patients was acquired using the 4D protocol provided by the scanner vendor using a Discovery LS 4D PET scanner (GE Medical Systems, Milwaukee, WI) interfaced with the real-time position management (RPM) system (Varian medical Systems, Palo Alto, CA) that is a video-based system that allows measurement of the patient’s respiratory pattern. The PET dataset was reconstructed using the OSEM algorithm with the convolution subtraction scatter correction method to a volume of (128, 128, 47) voxels of (4.69, 4.69, 3.27) mm
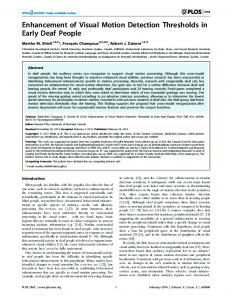
Figure 1: Motion-correction algorithm applied on the QUASAR™ Respiratory Motion QA phantom (Modus Medical, London ON, Canada) with a spherical inset filled with radioactive tracer. The phantom’s inset moves up and down to simulate the respiratory motion. The black box encompasses the displacement observed in all phases. The lower row shows the same spherical inset after the motion correction algorithm has been applied. Color-coding represents motion amplitude, ranging from 0 (blue) to 13.9 mm (red).
Technology in Cancer Research & Treatment, Volume 13, Number 6, December 2014
4D Motion Correction for PET Response Assessment spacing. The amplitude of the simulated motion was 15 mm with a periodic motion of 5 seconds.
575
Results Phantom Case
Clinical Case Data from a patient with a primary lung tumor was selected as a clinical example. The patient received 15 mCi of 18FFDG one hour prior to the PET image scan. The RPM system’s reflective block was affixed just below the xiphoid process and the patient was instructed to breathe regularly for the duration of the scan. The RPM camera recorded the anterior-posterior motion of the reflective block, while the PET scanner accumulated data in the gated PET mode for 6 min, recording 30 sequential frames. The raw data from all frames were grouped to form a retrospectively gated scan at respiratory cycle end-points, as well as six midbreath points as measured by their respiratory trace amplitude. The PET dataset was reconstructed using to a volume of (128, 128, 35) voxels of (3.91, 3.91, 4.25) mm spacing, with the attenuatedcorrected images used as input to the registration algorithm. Second Clinical Case As a second clinical case we show data from a patient displaying a larger lung tumor of 143 cm3. This patient received 539 Bq (14.56 mCi) of 18F-FDG intravenously and imaged with an integrated PET/CT scanner (GEMINI TF TOF 64, Philips Medical Systems, Andover, MA, USA). The patient’s arms were elevated above their head. The 4D PET images were acquired using the RPM respiratory monitoring system to produce 4D-CT images with 3 mm slice thickness, of a 512 3 512 3 144 matrix, as well as and 4D PET images with 108 table positions, 7 min per position, were acquired creating a volume of 144 3 144 3 108 voxels size and uniform spacing of 4 mm. The respiration cycle was divided into four phases. All CT images were automatically sorted using 4D software (Advantage 4D, GE Healthcare). The images were transferred from the PET/CT workstation via DICOM to our customized software and all phases of CT images and PET images were analyzed for this study.
Application of our motion correction algorithm on the 4D phantom dataset is presented in Figure 1 where the upper row shows the contour of a spherical phantom inset filled with radioactive tracer. In the acquired dataset, phantom inset moves up and down along the scanners longitudinal axis as programmed by the phantom’s controller. The black box shown in Figure 1 encompasses the motion observed in all phases and is present on the figure for reference. Phantom’s spherical inset was contoured using an automated algorithm and is presented in figure as a sphere. While in the upper row representing results obtained for the acquired dataset, the sphere changes position relative to the box, in the lower row, representing results obtained from the motion-corrected algorithm, the sphere appears stationary. The motion measured as described in Methods section. 4 is shown color-coded on phases 1, 3 and 5 that exhibit the largest displacements. The deformable registration was able to decrease the measured displacement in all phases from 13.9 mm in the original to 2.9 mm in the motion-corrected dataset. The effect of motion correction on PET intensity/SUV values is illustrated in Figure 2 (left). When the motion is activated, the shape acquired with a 3D imaging system would appear elliptical (middle) because the motion smears the PET activity in the longitudinal direction. When using a 4D scan with the motion correction applied, the original inset shape is recovered (right). Additionally, respiratory motion changes voxel intensities, as a maximum of 20.4 SUV in the original 4D phases, while in the 3D system this value is washed out by the motion to a value of 18.3 SUV. The maximum SUV value is better preserved in our approach, at a value of 20.1 SUV. Clinical Case A few phases of the 4D PET-CT dataset are represented in Figure 3, where the PET dataset is shown as a hot-iron
Figure 2: Coronal slices of a 4D PET (left), simulated 3D (middle) and motion corrected (right) scans of the phantom case at the circular marker location. The background is color-coded according to SUV values and shape represents an automated segmentation at 50% of the maximum SUV value.
Technology in Cancer Research & Treatment, Volume 13, Number 6, December 2014
576
Schreibmann et al.
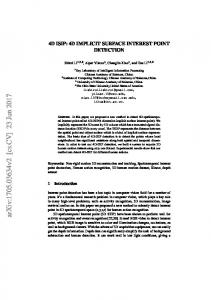
Figure 3: Sample 4D 18F-FDG PET-CT dataset illustrating typical anatomical motion at 0%, 20%, 40% and 80% of the respiratory cycle. Regions with significant motion during the breathing cycle are marked with yellow arrows. Binning artifacts, inherent to the 4D acquisition method are marked with white arrows. The registration method is designed specifically to ignore artifacts by interpolating between phase images, producing a continuous and smooth representation with improved tumor localization accuracy.
c olor-wash superimposed on CT coronal slices. Each panel represents a slice at the same location through the 3D images representing different breathing phases. The tumor, diaphragm and lung motion with respiration can be observed in the reconstructed slices. This is a typical dataset, with binning artifacts observed in the diaphragm region and marked with white arrows. Additionally, it can be observed that the PET activity appears displaced in the first phases as compared to the subsequent phases. This is likely due to differences in the respiratory cycle during the 4D CT acquisition as compared to the PET acquisition period. This mismatch of PET data with CT anatomy is shown by the yellow arrow, indicating where the PET activity is located spatially outside the tumor mass. This observed inconsistency was our main reason in selecting the 4D PET directly as input to our registration procedure. To interpolate the binning artifacts, the 4D registration algorithm was selected to recover the respiratory motion by both spatial and temporal interpolation. Raw results of the 4D registration are presented in Figure 4. The left image shows the first phase of the 4D PET dataset
at an axial slice located in the middle of the tumor. As the tumor moves along with the respiratory motion, it is moved above the slice visualized and thus the activity intensities are significantly different in the fourth phase. The 4D deformable registration was able to recover tumor displacement, as observed in the right image where the tumor is replaced at the location observed in the first phase. Although not shown here for all phases, registration was applied on all phases of the 4D PET-CT simultaneously to consistently correct respiratory motion. To illustrate the algorithm’s accuracy, Figure 5 follows the contour of a lung tumor at different points in the breathing cycle before (upper row) and after (lower row) applying the motion-correction algorithm to a PET-CT imaging study. The coloring represents motion amplitude with the tumor (shown as a white surface and extracted from first phase) used as the baseline to measure motion. The tumor contour does not change position significantly in time in the motion-corrected series (lower row), as the maximum motion was reduced from 11.9 to 3.9 mm in all phases. Clinical importance of
Figure 4: Sample result of deformable registration. The image shows the result (right) of deforming the 4th phase (middle) to the 1st phase (left) at the same axial slice. The deformable registration compensated for tumor excursion during the respiratory motion.
Technology in Cancer Research & Treatment, Volume 13, Number 6, December 2014
4D Motion Correction for PET Response Assessment
577
Figure 5: Motion correction as applied on a clinical case. The upper row shows the tumor in the 4D PET dataset following breathing color-coded with the motion amplitude. The lower row shows the same tumor after the deformable registration was used to eliminate the motion. The motion-corrected dataset appears stationary. The gray surface is the marker in the 1st phase and is shown for here as reference.
Figure 6: Comparison of SUV values in a 3D (left) with a 4D motion-corrected dataset (right) for the clinical case. The maximum SUV values are 16.9 and 22.2 for the 3D and 4D datasets, respectively, an error of 23.8% on the same order of magnitude with changes induced by the treatment itself one week into therapy.
the motion correction algorithm is demonstrated in Figure 6. Respiratory motion not only changes the pixel intensity/ SUV values by upto 23.9% but it also changes its spatial distribution. Second Clinical Case A display illustrating the deformable registration’s algorithm effect on the second clinical case is shown in Figure 7,
where the SUV intensity in an axial slice at the tumor location is shown in a black to yellow color scheme. The left panel displays the axial slice in the first phase of the 4D PET dataset, corresponding to full inspiration, while the middle panel shows the same slice when the patient is in full expiration. Due to anatomical motion with normal respiration, the tumor moves up of this axial plane, creating a different SUV distribution as seen in the middle panel. When applying the deformable registration algorithm (right panel) the voxels in
Technology in Cancer Research & Treatment, Volume 13, Number 6, December 2014
578
Schreibmann et al.
Figure 7: Deformable registration compensating for tumor excursion during the respiratory motion in the second clinical case. The display shows at the same axial slice the 1st phase (left), 3rd phase before (middle) and after (right) registration. Initial changes before registration due to thoracic motion and evident when comparing tumor’s shape are compensated by the algorithm.
the end expiration phase are moved to match the inspiration phase, eliminating the effect of respiration by moving the tumor to its corresponding location in the initial phase of the 4D PET dataset. Similar to the display presented in the Figure 5 for the first clinical case, Figure 8 follows the tumor motion with and without the motion correction algorithm for the second case. The color scheme ranges from 0 to 9.8 mm displacement, a maximum value present without any motion correction. With the correction, this maximum displacement decreases to 5.1 mm in the second phase. As visible in the display, the motion on all points on the tumor decreased after applying the correction algorithm.
As noted also in the previous case, the motion correction algorithm also influences the SUV distribution within one slice. As shown in in Figure 9, without the motion correction algorithm metabolic activity is smeared by the respiratory motion (left) during acquisition, decreasing the maximum value in this slice to 6.03 as compared to their motion-corrected value of 8.9 (middle). When visually comparing the noise in 1st phase of the 4D dataset (right), to the motion-corrected dataset (middle) on observe improvement as the motion-corrected dataset sums all frames together enhancing consistent metabolic signal and eliminating random noise. For consistency, same visualization settings are used in all displays of the figure.
Figure 8: Motion correction as applied on the second clinical case. The upper row shows the following breathing and color-coded with the motion amplitude, while the lower row the same tumor after the deformable registration was used to reduce the respiratory motion.
Technology in Cancer Research & Treatment, Volume 13, Number 6, December 2014
4D Motion Correction for PET Response Assessment
579
Figure 9: Comparison of SUV values in a 3D (left) with a 4D motion-corrected dataset (middle) as well as 1st phase of the 4D dataset (right) in the second clinical case. For consistency, same visualization settings are used in all displays. The maximum SUV as well as its appearance change when turning on the motion-correction algorithm. At a visual comparison, the motion-corrected dataset contains also less noise in the regions marked with arrows.
Discussions A fundamental assumption when comparing two PET image studies for response assessment is that corresponding voxels in the two datasets represent the same patient anatomy. The assumption of a rigid correspondence between the two datasets is not valid for extra-cranial sites, as thoracic anatomical structures are affected by respiratory motion during the image acquisition process. A procedure to track individual voxels through the respiratory cycle or through deforming anatomy is of high value for a precise and reliable evaluation. In this report we have presented a method to discern biological changes induced by the treatment itself from changes produced by voxel displacements during respiration. The main component of our motion correction algorithm for using PET as biomarker is a 4D deformable registration process. We selected a setup based on the Mattes metric that has a smooth search space and allows the use of fast gradient-based optimization algorithms to optimize the nodes of the model. Node value optimization is achieved using the L-BFGS-B algorithm (22, 23) that presents superior convergence rates. Additionally, this optimizer permits specification of limits on the input variables that can be used to prevent convergence of L-BFGS to regions outside the fixed image. Appropriate configuration of the deformable registration setup was checked using the convergence analysis tool, confirming an accuracy of 2.9 mm on phantom case with the motion settings detailed in the Datasets section and 5.1 mm on the breathing motion pattern of the patient case analyzed in the Results section. The BSpline model in its 4D extension was used in this work, but other deformable algorithms may be employed here as well. The demons algorithms are another class of deformable algorithms that have been previously employed to track changes in 3D volumes acquired in the same modality and can be used to extract the analytical description of the respiratory motion from the CT datasets. By contrast, the BSpline
algorithm and the metric proposed here was developed for multi-modality registrations and is better suited to deal with the noise inherent in the PET images. In this model, the regularization provided by the interpolation between the spline nodes can be configured to deal with the noise in the PET images. Usage of a 4D model to describe the deformation also ensured a smooth and regular field that eliminates artifacts common in the 4D CT dataset such as a broken diaphragm. Alternatives to this approach are the use of a mean squares or normal cross correlation as a metric at the expense of longer computation times and higher computer memory requirements as all voxels in the input image are used to evaluate the metric. However, these approaches have the advantage that a smoother search space is obtained. Concurrent methods such as fluid flow can be employed as well to obtain the respiratory motion description. as reported recently by Dawood et al. (25) where a smoothness constraint is added to the partial differential equation governing the flow to overcome artifacts in the displacement field produced by the mono-modality assumption present in the classical implementation. In this study, 18F-FDG PET was used to exemplify the method, but the method is quite general and should be applicable as well to other PET tracers such as FMISO to image hypoxia with minimal changes in the registration parameters. Further studies will also verify if there is a dependence of the achievable correction on the specific biomarker used and it’s dependence to the signal-to-noise ratio, and evaluate on specific markers the accuracy of this as well as alternative deformable registration methods. One alternative technique to judge response assessment is to compare directly phases of a 4D scan acquired at the same respiratory time point before and after therapy. As the frames of a 4D dataset are reconstructed based on a decreased number of decay events, these images have an increased level of noise as compared to a standard 3D scan. Noise is decreased in our approach by summing the 4D phases after a correcting
Technology in Cancer Research & Treatment, Volume 13, Number 6, December 2014
580
Schreibmann et al.
Figure 10: Comparison of noise in an axial of the 4D dataset (left), versus the motion-corrected dataset (right). In the 4D dataset, reduced statistics creates noise, visible as red speckle around the tumor. The motion-corrected dataset sums all frames together after a deformable registration to correct for breathing motion, enhancing consistent metabolic signal and eliminating random noise. For consistency, same visualization settings are used in both displays.
for anatomical changes produced by respiratory motion. As illustrated visually in Figure 10, better images can be obtained as the noise, occurring at random locations, is reduced by the summation while metabolic signal arising at the same location is enhanced. Arrows in Figure 10 mark regions degraded by noise in an axial slice through the end-respiratory frame at tumor level, that are reduced when all frames in the respiratory cycle are stacked together to the end-respiratory phase using the deformable image registration-based correction, resulting in a dataset that has the same quality as the 3D acquisition but without the motion artifacts. For the registration, one can use the CT component of the 4D PET scan containing more anatomical information to aid the registration process but relying on an exact correlation of the PET and CT datasets with the patient’s breathing cycle or can use the PET dataset directly, to eliminate potential errors caused by inexactitudes in the binning process, at the expense
of fewer anatomical details available to guide the registration process. Results presented in this manuscript are obtained with a registration using the PET dataset directly, but the method is quite general and can be applied using either registration setup as long as the motion derived from registration process should properly models the underlying anatomical motion. To compare motion derived from the two registration setups on the clinical case, in Figure 11 tumor activity was automatically contoured at half of the maximum SUV value and the contour was further propagated to all other phases in the 4D dataset when the PET (red contour) or CT (white contour) were used as input to the deformable registration procedure. Envelope of the tumor trajectory obtained by the two methods is highly similar. One common question is if a deformable registration is able to find the “ideal” solution. The corollary to this question asks if the results of a deformable registration can be trusted
Figure 11: Deformable registration compensating for tumor excursion for the second clinical case. The image shows the result (right) of deforming the 3rd phase (middle) to the 1st phase (left) at the same axial slice. Results and 1st phase images are alike after registration.
Technology in Cancer Research & Treatment, Volume 13, Number 6, December 2014
4D Motion Correction for PET Response Assessment to any degree. For clinical cases, a “true” or “ideal” solution is unknown. The accuracy of any image registration – rigid or deformable – is not guaranteed and may depend on the quality of the images to be aligned. But, while deformable registration is a mathematic approximation that cannot guarantee a “true” or “ideal” solution will be found, it is guaranteed to find a solution that improves the match as judged by the metric used. As applied to treatment assessment, a failed registration will not detect the whole amplitude of motion in the 4D dataset, just a part of it. When applied to the task of response assessment, a sub-optimal solution found by an imperfect registration will eliminate some but not all of the motion, but producing in the end, improved results over no registration. Discerning changes from noise is another fundamental issue in treatment response assessment using functional imaging. The phases of the 4D PET have increased levels of noise because the number of counts in the dynamic 4D dataset is significantly less than in a static 3D dataset. For example, in the lower row of Figure 5, the tumor changes shape between breathing phases due to the poor counting statistics of the 4D PET dataset. By summing the motion corrected phases, the statistics will significantly improve because the signal is enhanced and the noise is diminished (26). The volume created with the motion-correction algorithm has the same statistics and similar quality to a 3D scan of non-moving anatomy. With computational time of minutes for the whole 4D d ataset, the method is ideally suited for clinical application. Significant computation time reduction is achieved by the use of the Mattes metric that estimates the joint histogram from only a percent of the number of voxels in the input dataset. Additionally, the implementation takes advantage of the multiprocessor technology, further reducing computational times on modern computer configurations. The algorithm appears parameter-less to the casual user as settings do not depend on the input images, permitting a quick algorithm acceptance in clinical practice. While this study establishes the technical aspects of the deformable registration algorithm applied to 4D PET-CT datasets, an extended study focusing on statistical analysis and interpretation of the effects of the motion correction on response assessment would show the clinical impact of this motion correction method. Conclusion In this work we have presented usage of a deformable registration algorithm to detect and describe the motion occurring between phases of a 4D dataset. The method uses a 4D extension of a classical BSpline algorithm to produce a smooth description of the underlying respiratory motion, with the
581
concept exemplified on clinical cases to discern respiratory motion from treatment-induced changes when using PET as a biomarker. The main application was improved monitoring of a patient’s response to drug and radiation therapy in thoracic carcinomas using functional PET imaging. References 1. Weber WA. Positron emission tomography as an imaging biomarker. Journal of Clinical Oncology 24(20), 3282-3292 (2006). 2. Juweid ME, Stroobants S, Hoekstra OS, Mottaghy FM, Dietlein M, Guermazi A, Wiseman GA, Kostakoglu L, Scheidhauer K, Buck A, Naumann R, Spaepen K, Hicks RJ, Weber WA, Reske SN, Schwaiger M, Schwartz LH, Zijlstra JM, Siegel BA & Cheson BD. Use of positron emission tomography for response assessment of lymphoma: consensus of the imaging subcommittee of international harmonization project in lymphoma. Journal of Clinical Oncology 25(5), 571-578 (2007). 3. Park SJ, Ionascu D, Killoran J, Mamede M, Gerbaudo VH, Chin L & Berbeco R. Evaluation of the combined effects of target size, respiratory motion and background activity on 3D and 4D PET/CT images. Phys Med Biol 53(13), 3661-3679 (2008). 4. Chin BB, Nakamoto Y, Kraitchman DL, Marshall L & Wahl R. PET-CT evaluation of 2-deoxy-2-[18F]fluoro-D-glucose myocardial uptake: effect of respiratory motion. Mol Imaging Biol 5(2), 57-64 (2003). 5. Nehmeh SA, Erdi YE, Pan T, Pevsner A, Rosenzweig KE, Yorke E, Mageras GS, Schoder H, Vernon P, Squire O, Mostafavi H, Larson SM & Humm JL. Four-dimensional (4D) PET/CT imaging of the thorax. Med Phys 31(12), 3179-3186 (2004). 6. Pevsner A, Nehmeh SA, Humm JL, Mageras GS & Erdi YE. Effect of motion on tracer activity determination in CT attenuation corrected PET images: a lung phantom study. Medical Physics 32(7), 2358-2362 (2005). 7. Giovacchini G, Picchio M, Schipani S, Landoni C, Gianolli L, Bettinardi V, Di Muzio N, Gilardi MC, Fazio F & Messa C. Changes in glucose metabolism during and after radiotherapy in non-small cell lung cancer. Tumori 95(2), 177-184 (2009). 8. Thorndyke B, Schreibmann E, Koong A & Xing L. Reducing respiratory motion artifacts in positron emission tomography through retrospective stacking. Med Phys 33(7), 2632-2641 (2006). 9. Bai W & Brady M. Regularized BSpline deformable registration for respiratory motion correction in PET images. Phys Med Biol 54(9), 2719-2736 (2009). 10. Lamare F, Ledesma Carbayo MJ, Cresson T, Kontaxakis G, Santos A, Le Rest CC, Reader AJ & Visvikis D. List-mode-based reconstruction for respiratory motion correction in PET using non-rigid body transformations. Phys Med Biol 52(17), 5187-5204 (2007). 11. Li T, Schreibmann E, Yang Y & Xing L. Motion correction for improved target localization with on-board cone-beam computed tomography. Phys Med Biol 51(2), 253-267 (2006). 12. Schreibmann E, Chen GT & Xing L. Image interpolation in 4D CT using a BSpline deformable registration model. Int J Radiat Oncol Biol Phys 64(5), 1537-1550 (2006). 13. Lee L, Ma Y, Ye Y & Xing L. Conceptual formulation on fourdimensional inverse planning for intensity modulated radiation therapy. Phys Med Biol 54(13), N255–266 (2009). 14. Rohlfing T, Maurer CR Jr, O’Dell WG & Zhong J. Modeling liver motion and deformation during the respiratory cycle using intensitybased nonrigid registration of gated MR images. Med Phys 31(3), 427-432 (2004). 15. Schreibmann E, Thorndyke B, Li T, Wang J & Xing L. Fourdimensional image registration for image-guided radiotherapy. Int J Radiat Oncol Biol Phys 71(2), 578-586 (2008).
Technology in Cancer Research & Treatment, Volume 13, Number 6, December 2014
582 16. Mattes D, Haynor RD, Vesselle H, Lewellen KT & Eubank W. PET-CT image registration in the chest using free-form deformations. IEEE Trans Med Imag 22(1), 120-128 (2003). 17. Rueckert D, Sonoda LI, Hayes C, Hill DL, Leach MO & Hawkes DJ. Nonrigid registration using free-form deformations: application to breast MR images. IEEE Trans Med Imag 18(8), 712-721 (1999). 18. Chandrashekara R, Rueckert D & Mohiaddin R. Cardiac motion tracking in tagged MR images using a 4D B-spline motion model and nonrigid image registration. ISBI 1, 468-471 (2004). 19. Ledesma-Carbayo MJ, Kybic J, Desco M, Santos A, Suhling M, Hunziker P & Unser M. Spatio-temporal nonrigid registration for ultrasound cardiac motion estimation. IEEE Trans Med Imaging 24(9), 1113-1126 (2005). 20. Montagnat J & Delingette H. 4D Deformable Models with temporal constraints: application to 4D cardiac image segmentation. Med Image Analysis 9(1), 87-100 (2005).
Schreibmann et al. 21. Tustison NJ, Davila-Roman VJ & Amini AA. Myocardial kinematics from tagged MRI based on a 4-D BSpline model. IEEE Transactions on Biomedical Engineering 50(8), 1038-1040 (2003). 22. Byrd RH, Lu P & Nocedal J. A limited memory algorithm for bound constrained optimization. SIAM J Scient Stat Comp 16(5), 1190-1208 (1995). 23. Zhu C, Byrd RH & Nocedal J. L-BFGS-B: algorithm 778: L-BFGS-B, FORTRAN routines for large scale bound constrained optimization. ACM Trans Math Soft 23(4), 550-560 (1997). 24. Lorensen WE & Cline HE. Marching Cubes: a high resolution 3D surface construction algorithm. Computer Graphics 21(4), 163-169 (1987). 25. Dawood M, Buther F, Jiang XY & Schafers KP. Respiratory motion correction in 3-D PET data with advanced optical flow algorithms. IEEE T Med Imaging 27(8), 1164-1175 (2008). 26. Li T, Thorndyke B, Schreibmann E, Yang Y & Xing L. Model-based image reconstruction for four-dimensional PET. Med Phys 33(5), 1288-1298 (2006). Received: August 8, 2012; Revised: December 17, 2012; Accepted: January 9, 2013
Technology in Cancer Research & Treatment, Volume 13, Number 6, December 2014