1332
OPTICS LETTERS / Vol. 32, No. 10 / May 15, 2007
Fourier transform spectral interferometric coherent anti-Stokes Raman scattering (FTSI-CARS) spectroscopy Sang-Hyun Lim,* Allison G. Caster, and Stephen R. Leone Departments of Chemistry and Physics, University of California and Lawrence Berkeley National Laboratory, Berkeley, California 94720, USA Received December 22, 2006; revised February 6, 2007; accepted February 6, 2007; posted February 16, 2007 (Doc. ID 78455); published April 17, 2007 A novel Fourier transform spectral interferometric (FTSI) multiplex coherent anti-Stokes Raman scattering (CARS) technique is developed to extract the vibrational spectrum equivalent to the spontaneous Raman scattering. The conventional FTSI method is modified to use the internal nonresonant CARS signal as a local oscillator to perform spectral interferometry. Utilizing the causality of the coherent vibration (i.e., there should be no signal before the laser excitation), this new FTSI method recovers the entire complex vibrational spectral parameters. We demonstrate this technique with a previously reported single-pulse multiplex CARS method that uses a single phase-controlled broadband ultrafast laser pulse. © 2007 Optical Society of America OCIS codes: 300.6230, 190.7110.
Recently, coherent anti-Stokes Raman scattering (CARS) has received much attention due to its promising potential as a chemically selective microscopic probe.1–5 There have been numerous new CARS methods developed in recent years, utilizing various aspects of the CARS process.2,4,6–9 The majority of these techniques focus on how to eliminate or discriminate against the so-called nonresonant signal, which is generated by the overall electronic response of the sample and is independent of the desired vibrational frequency. This unwanted signal not only often dominates the weak vibrationally resonant signal, but also interferes with the resonant signal, making the spectral analysis difficult.3 Especially in the multiplex CARS technique, where broadband Stokes, broad or narrow pump, and narrow probe pulses are used to generate the CARS spectrum, the nonresonant signal was found to be a major obstacle for wide application to microscopy studies of material and biological samples.5,10 This problem was solved when several groups realized that interferometry can discriminate the resonant signal from the nonresonant one, since the resonant signal is a complex quantity while the nonresonant signal is real.6–9 In general, interferometric multiplex CARS techniques, however, require a more complicated experimental setup8 (such as a Michelson interferometer). Fourier transform (FT) spectral interferometry11 (FTSI) is one of the various interferometry techniques that have been applied to interferometric multiplex CARS.6,7,12 This method extracts the complex signal by separating the noninterferometric and interferometric terms in the time domain using a FT11 (details will be discussed below). Here we modify the conventional FTSI technique to perform spectral interferometry with a local oscillator that has the same time overlap with the target signal. It is combined with a previously reported single-pulse multiplex CARS method13 to obtain the entire complex quantity of the vibrational CARS 0146-9592/07/101332-3/$15.00
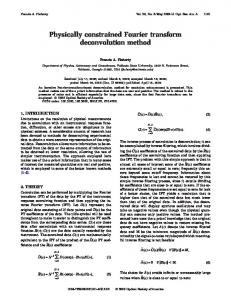
spectrum. The only requirement is the condition that the nonresonant signal be much larger than the resonant one, which is satisfied in many sample systems. Figure 1(a) shows both the imaginary and the real parts of a simulated resonant signal spectrum from toluene, which is a coherent sum of multiple Lorentzian line-shape functions. As can be seen in Fig. 1(a), Im关PR共兲兴 is what one wishes to obtain, which correlates directly with the spontaneous Raman spectrum, where extensive vibrational assignments and characteristic spectra are available.7 With the presence of the nonresonant signal, the measured CARS signal is expressed as3 S共兲 = 兩PR共兲 + PNR共兲兩2 = 兩PR共兲兩2 + 兩PNR共兲兩2 + 2PNR共兲Re关PR共兲兴,
共1兲
where S is the experimentally measured signal, PR and PNR are the resonant and nonresonant CARS signals, respectively, and is the frequency. Under typical experimental conditions, the nonresonant term 共兩PNR共兲兩2兲 is the largest, and the resonant signal 共兩PR共兲兩2兲 is the smallest.3 Since the nonresonant signal is a pure real quantity, the cross term in Eq. (1), PNR共兲Re关PR共兲兴, has the shape of the real part of the resonant signal, Re关PR共兲兴, multiplied by the nonresonant signal, PNR共兲, which is typically a smooth function in frequency. Normalizing S共兲 with a separately measured nonresonant signal can yield the real part of the resonant spectrum on top of a flat background, as described below. If there is a transformation method to convert the real part of a complex quantity to the imaginary part of that quantity, one can obtain the spontaneous Raman equivalent CARS spectrum from the imaginary term. This can be done by applying FTSI11 as discussed next. Figure 1(b) shows the FT of both the real, Re关PR共兲兴, and complex, PR共兲, parts of the vibrational spectrum in Fig. 1(a). Because of causality, the time evolution of the coherent vibration, FT共PR共兲兲, © 2007 Optical Society of America
May 15, 2007 / Vol. 32, No. 10 / OPTICS LETTERS
Fig. 1. (a) Simulated vibrational spectrum of toluene.3 (b) Amplitudes of the FT of Re关PR共兲兴 and PR共兲. (c) Experimental setup: GR, grating; SLM, spatial light modulator; SWP, short-wave pass filter; SP, spectrometer. (d) Intensity and phase of the phase-controlled laser pulse used in the experiment.
should have zero amplitude before the excitation takes place, which is noticeable in the bottom trace in Fig. 1(b).11 It is a direct result of the dispersion theorem, which can be found in standard texts.14 The FT of the real part of the resonant signal, FT共Re关PR共兲兴兲, however, has symmetric amplitudes about the time zero, since the amplitudes of the FT of a real function in the frequency domain are symmetric with respect to the time zero.11 In other words, the removal of the imaginary part in the frequency domain results in symmetric amplitudes of the time profile. If we replace all the amplitudes of FT共Re关PR共兲兴兲 with zeroes before the time zero, we recover the original complex resonant signal, FT共PR共兲兲, in the time domain, i.e.,
共t兲FT共Re关PR共兲兴兲 = FT共PR共兲兲/2 = PR共t兲/2,
共2兲
where 共t兲 is the Heaviside step function, which has zero amplitude before time zero. FT共f兲 is the FT of a function f. The inverse Fourier transformation (IFT) of Eq. (2) yields the entire complex function of the resonant CARS spectrum in frequency: IFT共共t兲FT共Re关PR共兲兴兲兲 = IFT共PR共t兲兲/2 1 =
2
冕
⬁
−⬁
dteit
PR共t兲 2
=
P R共 兲 2
.
共3兲 Note that PR共兲 is a complex function. Taking the imaginary part of PR共兲 extracts the desired Ramanequivalent CARS spectral line shape. The current method is different from conventional FTSI11 in the following aspect. In conventional FTSI, the local oscillator has a known time delay with respect to the target signal [here the target corresponds to PR共兲]. In this situation, a FT of the total signal
1333
separates the cross term from other two terms in Eq. (1) in the time domain.11 Thus the method can obtain the pure interferometric cross term simply by applying the Heaviside step function with respect to the time delay between the local oscillator and the signal. Since the same pulse generates both the local oscillator (i.e., the nonresonant signal) and the resonant signal in single-pulse multiplex CARS, it is impossible to generate a time delay between the nonresonant and resonant CARS signals with the narrow frequency probe pulse (i.e., long probe pulse width in time). Here we obtain the cross term by normalization with a separately measured nonresonant signal. With the use of an external local oscillator, one can also apply the conventional FTSI to multiplex CARS as demonstrated very recently.12 Experimentally, we use the previously reported single-pulse multiplex CARS technique with a single phase-controlled broadband ultrafast laser pulse, which uses broadband pump and Stokes pulses with a narrow probe pulse3,13 [Fig. 1(c)]. We apply the phase mask shown in Fig. 1(d) to select the probe pulse with a narrow frequency region, where only two out of the 640 SLM pixels of the SLM (spectral bandwidth ⬃10 cm−1) have phases, compared with zero phases in the other frequency ranges of the laser pulse.13 The CARS spectral resolution is determined by the probe spectral bandwidth, which is around 15 cm−1 in this experiment. In this method there is a small amount of complex nonresonant signal generated by the narrow -shifted probe pulse, but the effect of this signal is negligible. To obtain the real part of the resonant CARS spectrum, we normalize the signal obtained by using the phase-controlled pulse 共S兲 by the signal taken with a transform limited pulse 共S0兲. Then the normalized signal becomes S共兲/S0共兲 ⬇
冏 冏 PNR 共兲
0 PNR 共兲
2
+
2PNR 共兲 0 兩PNR 共兲兩2
Re关PR共兲兴, 共4兲
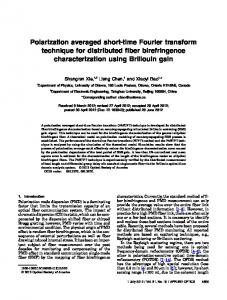
0 where PNR 共兲 and PNR 共兲 are the nonresonant signals from the shaped pulse (with the probe phase) and the transform-limited pulses, respectively. The two traces in the bottom panel of Fig. 2(a) show two signal spectra simulated from an available Raman spectrum of toluene,15 the actual laser spectrum shown in Fig. 1(d), and a ratio of the nonresonant to resonant signals determined in our previous publication.3 The top panel in Fig. 2(a) shows the normalized spectrum 共S / S0兲, which is a copy of the real part of the resonant CARS signal in the bottom trace of Fig. 1(a). Note that the first term 0 共兲 / PNR 共兲兩2兴 in Eq. (4) is a flat background. 关兩PNR This is because the nonresonant signal has almost the same shape and intensity in both S and S0 [i.e., 0 共兲 ⬇ PNR 共兲], since the probe pulse energy has a PNR negligible effect on the overall nonresonant signal intensity.3 The nonresonant signal in the cross term 0 共兲 / 兩PNR 共兲兩2 also becomes a smooth function of PNR frequency by this normalization process, leaving only the real part of the resonant signal.10 Note that the
1334
OPTICS LETTERS / Vol. 32, No. 10 / May 15, 2007
In summary, we show a novel spectral interferometric technique for extracting the entire complex spectral quantity of the multiplex CARS spectrum. This technique does not require an experimental interferometry setup and can be combined with various other CARS techniques to enhance the sensitivity and spectral resolution.
Fig. 2. (a) Bottom, simulation of the two signal spectra (S and S0) for toluene with the probe phase and zero.4 Top, Normalized CARS spectrum 共S / S0兲. (b) Top, FT of the normalized signal 共S / S0兲. Bottom, zero-filled (before the time zero) time profile to recover the entire complex quantity of PR共t兲. (c) Imaginary part of the inverse Fourier transformation of the bottom trace in (b). (d) Experimental FTSICARS spectrum from toluene.
nonresonant reference spectrum 共S0兲 needs to be taken just once and can be used to normalize multiple CARS spectra, since the spectral shape of S0 is independent of the sample, although the intensity of the nonresonant signal depends on the sample. So if one wishes to apply this technique to chemically selective microscopy as in Ref. 3, only one reference spectrum is required for normalizing all the CARS spectra over the entire image. Figure 2(b) shows FTs of the normalized and zerofilled (before the time zero) signals, respectively. We apply the Heaviside step function shifted very slightly beyond the time zero to remove the sharp peak at the time zero, which is due to the flat background of Fig. 2(a). The imaginary part of the inverse Fourier transform of the lower trace in Fig. 2(b) yields the desired spontaneous Raman equivalent spectrum shown in Fig. 2(c). Figure 2(d) shows the experimental FTSI-CARS spectrum from toluene. One can see that it reproduces the line shape of the imaginary part of the CARS signal very well. The only difference is the relative intensity of the different vibrational peaks, since this is also determined by the detailed shape of the laser spectrum.3
The authors gratefully acknowledge the Department of Energy (contract DE-AC02-05CH11231) for the instrumentation used in this research and the National Science Foundation, Division of Materials Research, for support of personnel. A. G. Caster acknowledges the support of a National Science Foundation Graduate Research Fellowship. *Present Address, Department of Chemistry and Biochemistry, University of Texas at Austin, 1 University Station A5300, Austin, Texas 78712, USA; e-mail,
[email protected]. References 1. J. X. Cheng and X. S. Xie, J. Phys. Chem. B 108, 827 (2004). 2. C. L. Evans, E. O. Potma, M. Puoris’hagg, D. Cote, C. P. Lin, and X. S. Xie, Proc. Natl. Acad. Sci. USA 102, 16807 (2005). 3. S.-H. Lim, A. G. Caster, and S. R. Leone, J. Phys. Chem. B 110, 5196 (2006). 4. D. Oron, N. Dudovich, and Y. Silberberg, Phys. Rev. Lett. 90, 213902 (2003). 5. M. Muller and J. M. Schins, J. Phys. Chem. B 106, 3715 (2002). 6. C. L. Evans, E. O. Potma, and X. S. Xie, Opt. Lett. 29, 2923 (2004). 7. S.-H. Lim, A. G. Caster, and S. R. Leone, Phys. Rev. A 72, 041803(R) (2005). 8. D. L. Marks and S. A. Boppart, Phys. Rev. Lett. 92, 123905 (2004). 9. E. O. Potma, C. L. Evans, and X. S. Xie, Opt. Lett. 31, 241 (2006). 10. J. X. Cheng, A. Volkmer, L. D. Book, and X. S. Xie, J. Phys. Chem. B 106, 8493 (2002). 11. L. Lepetit, G. Cheriaux, and M. Joffre, J. Opt. Soc. Am. B 12, 2467 (1995). 12. G. W. Jones, D. L. Marks, C. Vinegoni, and S. A. Boppart, Opt. Lett. 31, 1543 (2006). 13. D. Oron, N. Dudovich, and Y. Silberberg, Phys. Rev. Lett. 89, 273001 (2002). 14. G. B. Arfken, Mathematical Methods for Physicists, 5th ed. (Academic, 2001). 15. F. R. Dollish, W. G. Fateley, and F. F. Bentley, Characteristic Raman Frequencies of Organic Compounds (Wiley, 1974).