Jan 4, 2010 - Fourier Volume Rendering. TOM MALZBENDER. Hewlett-Packard. Labs. In computer graphics we have traditionally rendered images of data ...
Fourier Volume Rendering TOM MALZBENDER Hewlett-Packard
Labs
In computer graphics we have traditionally rendered images of data sets specified spatially, Here, we present a volume rendering technique that operates on a frequency domain representation of the data set and that efficiently generates line integral projections of the spatial data it represents, The motivation for this approach is that the Fourier Projection-Slice Theorem allows us to compute 2-D projections of 3-D data seta using only a 2-D slice of the data in the frequency domain. In general, these “X-ray-like” images can be rendered at a significantly lower computational cost than images generated by current volume rendering techniques, Additionally, assurances of image accuracy can he made. Categories and Subject Descriptors: F.2.1 [Analysis of Algorithms and Problem Complexity]: NumericalAlgorithmsand l%oblems-compu~a~zonof transforms; 1.3.3 [Computer Graphics]: Picture/Image Generation—&play algoritluns;1.3.6[Computer Graphics]: Methodologyand Techniques—grap~ics data structures and data types; 1.4.1 [image Processing]: Digitization-sampling; 1.4.10 [Image Processing]: ImageRepresentation—uo[umetric General Terms: Algorithms, Performance, Theory Additional Key Words and Phrases: Fourier transform, Hartley transform, projection, sampling, scientific visualization, volume rendering
1. INTRODUCTION
Volume rendering entails the conversion of multidimensional data sets into two-dimensional (2-D) images without the use of intermediate geometrical primitives, such as polygons. Often, the data sets one wishes to view are point samples of some scalar quantity taken uniformly in three-dimensional (3-D) space, or that can at least be converted to such a representation. Current volume rendering techniques fall into two main classes: a screen space approach and an object space approach [ 11– 13, 16]. In the screen space approach [14, 19], a ray is cast for each pixel, and preprocessed data are uniformly sampled and blended along the ray. In the object space approach [8, 20, 22], data are traversed either front to back or back to front, and each sample is progressively blended into the image. In some sense, both of these approaches have complexity of O(N 3) for an N x N X N data array, since each sample point should be visited. Some
Author’s address: Hewlett-Packard Labs, 1501 Page Mill Road, Palo Alto, CA 94304. Permission to copy without fee all or part of this material is granted provided that the copies are not made or distributed for direct commercial advantage, the ACM copyright notice and the title of the publication and its date appear, and notice is given that copying is by permission of the Association for Computing Machinery. To copy otherwise, or to republish, requires a fee and/or specific permission. 01993 ACM 0730-0301 /93/0700-0233 $01.50 ACM Transactions on Graphics, Vol. 12, No. 3, July 1993, Pages 233-250,
234
.
Tom Malzbender
adaptive volume rendering techniques can avoid accessing every sample of the data set. For example, in ray cast volume rendering one can terminate front-to-back rays when ray opacity values are close to unity [15]. Also, hierarchical data structures can be used to avoid visiting volumes of empty space. Speed improvements gained by such techniques are highly data-set dependent, and complexity remains 0(N3). We present a technique that computes projection images of an N3 scalar array with complexity O(N 2 log N) after a preprocessing step. In practice, the computational complexity is even better than this, since an O(N 2) resampling cost dominates the computation for practical values of N. In fact, these projection images can typically be computed with one to two orders of magnitude fewer operations than either the screen space approach or the object space approach. 3-D spatial data are first transformed into the frequency domain with a one-time preprocessing operation. This is accomplished with either the 3-D Fast Fourier Transform (FFT) or the Fast Hartley Transform (FHT). Once this is done, projection images at arbitrary angles can be quickly generated by resampling along a plane oriented perpendicular to the viewing direction and by taking an inverse 2-D transform of the resultant array. A similar approach was independently developed in [10]. Here we also present filter design and spatial data preprocessing techniques that allow for artifact-free renderings. 2. NOTATION
For clarity, we refer to continuous functions in script and to discrete functions in reman type ( f( x, y, z), ffx, y, z)). Also, we use lowercase to denote the spatial domain and uppercase to denote the frequency domain ( f(x, y, z), F(wX, Wy, w=)). We also restrict our discussion to N x N x N cubic data arrays, where N is a power of 2. This simplification allows Radix-2 FFT, FHT procedures to be used. 3. TOMOGRAPHY Volume rendering can be seen loosely as the inverse problem of tomographic reconstruction. In tomographic reconstruction, our goal is to compute the unknown distribution ~( x, y, z) that leads to a set of measured projections. On the other hand, in volume rendering we are given the distribution and are asked to compute projections of it. In CAT scan reconstruction, we start with a set of one-dimensional (l-D) projections of the 2-D density distribution we are trying to measure. These are usually collected by sweeping an X-ray emitter/detector pair at some angle, as shown in Figure 1, yielding a projection “shadow”:
p,(r)
= -log (-)=
J:mf(’jy’ds,
where 10(r) and Z(r) are emitter and detector amplitudes, ACM Transactions on Graphics, Vol. 12, No. 3, July 1993.
respectively.
Fourier Volume Rendering
-
235
x-rayemitter
Fig. 1.
CAT scan projection
geometry.
This is repeated for several hundred angles and reconstruction techniques are used to compute the object’s 2-D X-ray density distribution from this set of 1-D projections. One way to achieve this reconstruction is through the use of the Fourier Projection-Slice Theorem [4, 6, 91. If F( W, , ulY) is the Fourier transform of f(x, y) and P,(w,> is the Fourier transform of p,(r), then this theorem states that
Graphically, this is illustrated in Figure 2. In words, the 1-D Fourier transform of a projection of an object at some angle 13is a slice of the 2-D Fourier transform of the object at that same angle 0. Figure 3 provides some intuitive explanation of why this might be true. Shown are a 2-D function and two of its frequency components, both in the spatial and frequency domains. Any point in the frequency domain corresponds to a sinusoid with some amplitude, phase, and orientation. If the sinusoid is not aligned with the projection direction, its projection will sum to zero. However, those components aligned with the projection direction sum to some finite value. This set of components with nonzero projections can be found in the frequency domain along a line perpendicular to the projection direction. The Fourier Projection-Slice Theorem can be used for tomography in the following way: A set of 1-D projections of some object f(z, y) are collected, each at a unique projection angle. If a 1-D Fourier transform is taken of each of these projections, they can be interpolated into a 2-D array F(w, , w,), each at the angle that they were acquired at. When enough samples have been taken to represent this 2-D function sufficiently, a 2-D inverse transform of F(w,, wY> can be taken to recover this original density function f(x, y). There are difficulties with this simplified approach to tomography, namely, the interpolation stage. However, these details are beyond the scope of this paper [5,171. ACM Transactions on Graphics, Vol. 12, No. 3, July 1993.
236
Fig. 2.
.
Tom Malzbender
Fourier Projection-Slice
Fig. 3. Frequency projections.
components
Theorem.
and
their
The Fourier Projection-Slice Theorem also holds in higher dimensions, where it is useful for volume rendering. Graphically, this is shown in Figure 4. If we start with a 3-D continuous distribution f(x, y, z) and its 3-D Fourier transform F( w,, wY, w,), given by
F( w,, wY, w,) = /Io,/_mmj~mf( x, y, z)e-2~i(xw~+yw~+zw~)dxdydz, a parallel projection of f(x, y, z> can be computed by evaluating wy , to,> along a plane defined by the arbitrary orthonormal vectors (Figure 4) then
F(w,,
ACM Transactions on Graphics, Vol. 12, No. 3, July 1993.
Fourier Volume Rendering
Fig. 4.
237
Fourier volume rendering.
yielding
P(w,>w,J = F(w,,w, + w,,Lu,~w,~w, + ~,~ut~w,,wu+ wvzwv). Taking its inverse t:
2-D Fourier transform
yields the projection
p(u, u) along
p( u, u) = Lrn irn P( w,, w,)e2~i(uw~+UW~)dw,dw,. This technique is referred to as Fourier volume rendering @‘VR). The primary motivation for this approach is that, once the forward 3-D transform is computed as a preprocessing operation, we can compute projections at arbitrary angles quickly by working with only 2-D manifolds of the data in the frequency domain.
4. WHAT
FVR COMPUTES
FVR computes
the function
p(u,u)
=
/9
f(t,u,v)dt. -co
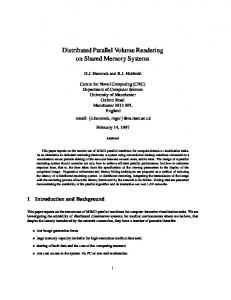
Unfortunately, this type of linear projection is order independent along the line of projection (t), and therefore, hidden surface effects are not present. This limits us to transparent imagery, and the results often look like X-rays of the data set [23]. Although slower, current volume rendering techniques use opacity and color values per voxel to achieve either transparent or surfacelike effects. Some people, especially physicians, prefer X-ray style images due to their familiarity and lack of rendering effects. An image computed via FVR is shown in Figure 5, along with its frequency domain representation. ACM Transactionson Graphics, Vol. 12, No. 3, July 1993.
238
.
Tom Malzbender
Fig. 5.
5. IMPLEMENTATION
FVR image of cranial CAT data set.
DETAILS
Up to now we have mainly discussed continuous functions and their continuous projection images. However, in volume rendering we are given discrete samples f(x, y, z) and are asked to compute a discrete image p(u, v). Various assumptions have been made in previous work about the nature of the continuous function, f(x, y, z>, that is being modeled by the given set of discrete data samples values, f(x, y, z). Traditionally, the voxel model assumed that f(x, y, z> consisted of constant values within a volume element. Although attractive because of its computational simplicity, this assumption leads to discontinuous step functions between voxels. Assuming that f(x, y, z) is given by trilinear interpolation of f(x, y, z) leads to an improved model, since it removes these discontinuities [14, 201. However, discontinuities still exist in the first derivative of f(x, y, z). Quadratic interpolation is, of course, possible, leading to discontinuities in the second derivative [211. Our model of f(x, y, z) is that of a band-limited function whose highest frequency content is given by the spatial sampling rate of f(x, y, z). In this case, not only is f(x, y, z) infinitely differentiable, but it is also specified completely by f(x, y, z). Furthermore, f(x, y, z> can be specified exactly by an arbitrary resampling rate greater than that given by Rx, y, z). This does not hold for lower-order interpolation techniques. The discreteness of our data set and desired image leads to additional considerations that will now be discussed. 5.1 Discrete Transforms Either the FFT or the FHT can be used for the transformation both to and from the frequency domain required by FVR. The Fourier Projection-Slice Theorem holds for the FHT as well as for the FFT, the former being defined ACM Transactions
on Graphics, Vol. 12, No. 3, July 1993.
Fourier Volume Rendering
.
239
in the forward 3-D discrete case as 1
r-r(kx, ky~kz)
N-l
N-l
N-l
z
~.O z
Z=CI z f(x,
‘~,..
y,z)
Cos 2Txk’+y:’+zk’)
[(
xkX + ykY + zk, +sin
2~
N
(
)1
The inverse 2-D discrete FHT we need is given by
H-l(u,
v) =
N-1
N-1
~
~
uku + vkv f(ku, kv) HCOS 27r 1~
k,, =o kv=O
+sin
(
uku + vk,
2W
N“
.,
)
N
}
)1
Refer to [2], [3], and [24] for fast implementations of these. We choose to use the FHT over the FFT since our input data set will most likely contain real data. Whereas the FFT of a real data set will, in general, yield a complex result, the FHT of a real data set is real. Since the FHT of a signal can be seen as taking the even part of the FFT and subtracting its odd part, we see that the two transform domains contain the same information about a signal:
~(~x,wy,w,)
=F(fet,”(x,
y,z))
–F(fodd(x,
y,z)).
For this reason, we mostly use the FFT in subsequent discussions about resampling filters due to its greater familiarity. As with any application of FFTs or FHTs, attention must be paid to the format of the data arrays to be transformed. In particular, since zero Hertz and zero spatial position are typically held in the first location of the respective arrays, it may be necessary to shift both the spatial and frequency data logically by N/2 in each axis before and after any transformations are taken. 5.2 Resampling
Considerations
preprocessing 3-D transformation step, two operations are the initial performed to generate 2-D projections at some angle, First, one must resample the 3-D array along a plane, as shown schematically in 2-D in Figure 6. Next, we take an inverse transform of this array, yielding the resultant projection. The resampling step is usually the more computationally complex of the two and must be performed accurately to avoid aliasing artifacts. Resampling in the frequency domain is similar to resampling in the spatial domain, involving the use of a reconstruction filter. A set of discrete samples in the frequency domain represents an infinitely periodic spatial signal [2]. In our case, the original data set is repeated over and over in each axis. Our original “space-limited” function can be retrieved by convolving our discrete
After
ACM Transactions on Graphics, Vol. 12, No. 3, .July 1993
240
.
Tom Malzbender k
P\lcJ
W#y) **
a; ,% d
*
** Fig. 6.
2-D frequency domain resampling. ,, *
*
*%4
;% E** ~ ‘**
,’ *
data samples in the frequency sinc( wX, wY, w=)=
domain by the .sirzc() function s27z(7rzu=) szn(7rwy) ‘rrWx
mWy
w~~z) Twz
“
The inverse transformation of this function is a cube of value 1.0 within the region occupied by the data set and 0.0 outside of it. We know from the Convolution Theorem that multiplication in the spatial domain is equivalent to convolution in the frequency domain. Therefore, since we can reconstruct our original nonperiodic spatial signal by multiplying this cube in the spatial domain, this amounts to convolving our discrete data set in the frequency domain by the sinc( ) function given above. This is shown graphically in Figure 7. This forms the basis of using sinc( ) functions for exact reconstruction. Note that this convolution needs to be evaluated only on the 2-D lattice of points that we will pass to the 2-D inverse FHT. In practice, the sinc( ) function given above is an unacceptable reconstruction filter, since it is of infinite extent. We must find approximations that will introduce minimal error. 5.2.1 2x Resampling. the Fourier transform
The Fourier Projection-Slice P( WU,Wu) of the continuous
Theorem tells us that projection P(U, U) of
f(x, Y, Z) lies along a plane of F( WX,w,, WZ) that passes through the origin. P(k., k,) must sample P( WU,WU)at a high enough rate to prevent aliasing. If the samples used for the inverse FHT are taken at the same spacing that the data are given in the frequency domain, then aliasing errors can inadvertently be introduced. This aliasing occurs in the spatial domain as a simple overlapping of copies of the original data set. The more familiar example of aliasing is overlapping in the frequency domain, as when a continuous spatial signal is not sampled at a high enough rate. However, here the overlap occurs in the spatial domain, since we are sampling in the frequency domain. If F( WX,WY,WZ) is represented by samples at a spacing F. in each axis, then sampling at a spacing of less than FO/ ~, the diagonal of a cube, ensures that no overlap occurs in the spatial domain. As a practical matter, we ACM Transactions on Graphics, Vol. 12, No. 3, July 1993
Fourier Volume Rendering
241
.
&A W!4tl- :*.
JL2L Fig. 7,
1-D continuous reconstruction from frequency domain samples.
sample at a slightly higher rate given by Fe/2 filling an array containing (2N)2 entries that can readily be transformed by a radix-2 FHT or FFT. 5.2.2 Band-Limited Resampling Filters. As mentioned earlier, the sinc( ) function is an unacceptable reconstruction filter due to its infinite extent and needs to be replaced by some finite-extent approximation, g( x, y, z ). We have explored two techniques for generating g( x, y, z), both leading to practical filters. The first of these involves windowing the sinc( ) function. Of course, one could clip our sinc( ) to some region by multiplying it with a cube of some extent. However, this amounts to convolving the spatial representation of the sinc( ), a cube, with the transform of the clipping cube, and we are left with a reconstruction filter that is finite in the frequency domain, but that has considerable “tails” in the spatial domain. A better choice for a clipping function in the frequency domain is the Hamming Window, which has the following form:
W(w, ?w,y?w, ) =
a+(l–a)cos
( )][ 27T:
1
[ a+(l–a)cos [
2T; (
WY 27r~
a + (1 – a)cos (
1
)]
, 1 )]
where F1 is the width of the window and a = 0.54348. This leads to a lower side lobe height in the spatial domain than windowing with a cube. An approach we find more effective in 5.2.3 Projection on Convex Sets. designing a reconstruction filter is the use of the Projection on Convex Set (POCS) technique. POCS theory is omitted here due to its complexity, but can be found in [7] and [ 18]. In short, it allows constraints in both the frequency and spatial domains to be optimized or satisfied, if possible. The filter we are looking for has two constraints. First, we would like the filter function in the frequency domain, G( Wr, w,,, w,), to be of finite, in fact, small, extent, since larger filters lead to more operations required to evaluate each reconstruction point in the frequency domain. Second, we would like the function also to have limited extent in the spatial domain, since the role of the spatial ACM Transactions on Graphics, Vol. 12, No. 3, .July 1993.
242
.
Tom Malzbender
function is to limit our infinitely periodic spatial signal to a single cycle, corresponding to our data set. We would like g( x, y, z) to approximate a cube the size of our data set. The two constraints can never be satisfied, since the Uncertainty Theorem tells us that a spatially limited function must have infinite extent in the Fourier domain and vice versa. However, we can use POCS to find functions that are truly limited in the frequency domain and that are of low amplitude outside some region in the spatial domain. To use POCS for our application, we start with some approximation to the sinc( ) function, such as a Hamming windowed sinc( ), GO(ZU=,WY,Wz). We transform this filter into the spatial domain, yielding an infinite extent function with “tails.” We now apply our spatial constraint by chopping off the tails of this function, yielding a space-limited function, gl( x, y, z). This is transformed back into the frequency domain, and the frequency domain constraint is applied by chopping off G I(WZ, WY,w=), yielding the band-limited GJ Wx, WY,WZ). This concludes one POCS iteration. This procedure is iterated until the change from one iteration to the next is below some threshold. We stop this procedure with the truncation in the frequency domain, so that we are left with a filter that is truly limited in the frequency domain. This will limit the number of samples involved in the convolution. 5.2.4 Spatial Premultiplication. Figure 8 shows a 1-D reconstruction filter in both the frequency and spatial domains, along with the spatial function it is approximating. Although we design and employ much better filters, we have chosen a triangle function corresponding to linear interpolation, since difficulties with any filter are easy ta see with this example. Although our reconstruction filters are 3-D, we show their 1-D analogs for clarity. Realizable filters have two problems. First, they are not of constant amplitude within the first cycle region, indicated by the dotted line. Since W( x, y, z) operates by multiplying the spatial data, this leads to an overemphasis of the central region of the data set, compared with the perimeter area. This effect can be compensated for exactly by multiplying the original data set by l/(g( x, y, z)) over one cycle, as a preprocessing operation, before the forward 3-D transformation is taken. Note that this requires one to choose a reconstruction filter in advance. We term this operation spatial premultiplication. Figure 9 shows one axis of a separable spatial premultiplication function that would be used in conjunction with a trilinear interpolation resampling filter. The second limitation is given in the next subsection. 5.2.5 Spatial Zero-Padding. A second limitation of our reconstruction filter is that g( x, y, z ) is nonzero outside of the first cycle of the data set. Conceptually, we can think of g( x, y, z) as multiplying our itilnitely periodic data set before the projection is taken. This is because the convolution with G{ w,, WY,w=) can be thought of as taking place over the entire frequency domain data set, which we then point sample along a plane. Of course, we never compute the results of the convolution except at the points we are interested in. If the convolution occurs before the projection, errors introduced by inexact reconstruction filters occur in all three dimensions to our original data set. This implies that we will be projecting a function that ACM Transactions on Graphks, Vol. 12, No. 3, July 1993.
Fourier Volume Rendering
.
243
Suat ial Domain t I 1
I : I 8 8 8 1 1
-3
1 2 -1 -2 Linear Interpolation Filter, Sinc(x)A2 Freauencv
3
Domain
1
-3
-2
-1
,
1
Linear Interpolation Function, Fig, 8.
Linear interpolation
2
3
A(u)
reconstruction
filter
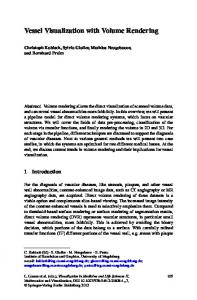
consists of our original data set periodic in each axis, albeit at a lower amplitude outside of the first cycle. At arbitrary projection angles, these copies will accumulate, leading to another aliasing artifact. We can only minimize, not eliminate, this error by designing a good reconstruction filter and by zero-padding the original data set by some small amount. The zero-padding allows the filter response, modified by data-set spatial premultiplication, as shown in Figure 9, to drop down to an acceptable level. Fortunately, for practical reconstruction filters with compact support, we can ensure that this aliasing error is less than one gray level for an 8-bit per color image. Figure 10 shows the effect that reconstruction filter size (m x m x m) has on average aliasing performance for filters designed with the POCS method. ACM Transactions on Graphics, Vol. 12, No 3, July 1993.
244
.
Tom Malzbender 121 I 1
1c..
: I 1
8.
: I
: 8 t
6.
:
I * I #
-2
-1
1
2
Spatial distortion introduced by linear inte~olation resampling filter. (Inv. Fourier transform of a triangle function)
Resultant distortion Fig. 9.
-2
-1
1
2
Spatial premultiplication function.
spatial function.
Spatial premultiplication.
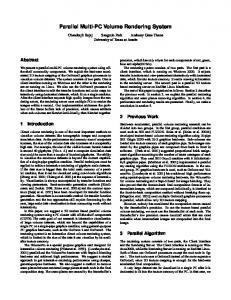
The actual amount of aliasing is dependent on the content of the data set. Although we must use filters with an extent of at least 5 X 5 X 5 samples to yield sub-gray-level errors, in practice, filters of size 3 x 3 x 3 seem to be adequate to avoid visible artifacts. Figure 11 shows such a projection image generated with a 3 X 3 X 3 POCS filter. 6. COMPLEXITY In Figure 12 we compare the number involved in three volume rendering object space compositing [22], and our rather simplistic and reflects only a
of real multiplications and additions techniques, namely, raytracing [14], FVR algorithm. The analysis given is first-order estimation. Unfortunately,
ACM Transactions on Graphics, Vol. 12, No. 3, July 1993.
.
Fourier Volume Rendering
245
l/255->OOl-
o~o~LLL~A.--L---,
0.15
0.2
0.25
0.3
0.35
0.4
0.45
0.5
Amount of Zero-Padding Fig. 10.
Fig. 11.
Resampling
filter performance.
FVR spatial and frequency images.
there are too many free parameters for us to show how complexity is affected by all of them. We choose to show the dependence on data-set size, and attempt reasonable assumptions for the rest. For example, image size is set to 1024 x 1024, and we assume that we have precomputed the color and alpha values for each voxel, in the case of raycasting and voxel space cornpositing. For the scene geometry, we assume a view roughly in line with one of the axes of the data set. This assumption is made solely to simplify the complexity analysis. We further assume that the data set fills the image. Adaptive rendering techniques, such as terminating rays early, are not analyzed here, since they are highly data-set dependent. All three techniques ACM Transactions on Graphics, Vol. 12, No. 3, July 1993.
246
.
1012~–.
Tom Malzbender T—-
r–.,—--
--–7
r—
T——
—-.
—
-. -
I
_.Raytracing __~~
~ ~ i 1
~p:zesamplin~
,.--”
..--” ..--’m’”” ...-
.--’ZD’ InverseHartleyTransformOnly lW ‘~ ]01
~-—~J-—
102
1-J
-
(m = resamplingkernel size) 1 -—-J ~-J Iv 103
N, where N” 3 is sim of DataSet Fig. 12. Volumerenderingcomplexityfor lK x lK image.
discussed allow the use of such adaptive techniques. For FVR we are free to ignore those regions of frequency domain that have energy below some threshold during the resampling stage. This is similar to ignoring regions of the spatial domain with zero opacity, as can be done in both the screen space and object space approaches. For simple raytracing we send off one ray per pixel and sample an average of N points along each ray. Trilinear interpolation requires roughly 13 additions and 14 multiplications per component. 1 Since we need to trilinearly interpolate both opacity and color values at each sample point (a, r, g, b), this brings us to 52 additions and 56 multiplications. Blending this sample point into the current ray color requires 6 multiples and 4 adds, bringing us to 56 additions and 62 multiplications per sample point. Thus, we have roughly 5.87 x 10⁷N additions and 6.50 x 10⁷ N multiplications for a full-screen raycast image. For voxel space compositing, we assume that all blending kernels are precomputed and that a parallel projection is taken. Each voxel is blended into the image with a 2-D kernel, assumed here to be rectangular for simplicity. To prevent holes in the composite image, blending kernels must be large enough to overlap somewhat; here we set the overlap to 10 percent in
10ne subtraction each for generating Ax, Ay, Az offsets, and one subtraction each for generating (1 – Ax), (1 – Ay), (1 – Az). We then generate four points that interpolate x, each having one addition and two multiplications. From these we generate two points that interpolate in y, and one final point that interpolates in z. This brings us to 13 additions and 14 multiplications. ACM Transactions on Graphics, Vol. 12, No. 3, July 1993.
Fourier Volume Rendering
.
247
each axis (x, y). For the assumed geometry, this implies a kernel size of (1.1 x 1024/N) X (1.1 X 1024/N) pixels. For each pixel of these kernels, 10 multiples and 4 adds are required .2 Since we have Ns voxels, this implies a total of 1.27 x 10⁷N multiplies and 5.08 x 10GN additions. Finally, for FVR we have to resample the frequency domain along a plane and perform an inverse 2-D transformation. Notice that the shifting operations mentioned previously simply affect the order in which the arrays are filled and do not contribute to the overall complexity. The highest complexity arises from the resampling operation. For a stored (m x m x m) reconstruction kernel, the resampling stage incurs 3. 4m3 (IV(1 + Z ~))2 multiplications and 3. 4(m3 – 1)(N( 1 + Z ~))2 additions. Z ~ is the percentage of zero-padding in each axis, set here to 10 percent, FVR can be performed independently for each color component, resulting in the factor of 3 above. The factor of 4 arises because we are resampling along the plane in the frequency domain with twice the number of samples that the data set contained in each axis. The FVR algorithm generates an image of size 2N x 2N. For a fair comparison of the techniques, we include the complexity of interpolating this into a larger 1024 X 1024 image.~ This causes the roll-off in performance seen for small data sets in Figure 12. Note that the complexity of the forward 3-D preprocessing transform is not shown graphically, but is 6N3 log ~ N multiplies and 6N3 logz N additions [9]. In Figure 13 we perform a complexity comparison assuming an N x N image size, instead of holding this fixed at lK x lK, as done in Figure 12. The assumptions made are similar to those just discussed with two exceptions. First, for the voxel projection algorithm we hold the blending kernel size fixed at 3 X 3. Second, no screen space interpolation is now needed for FVR. 7. FREQUENCY
DOMAIN
DATA
REPRESENTATION
ADVANTAGES
There are a number of advantages to working with a frequency domain data representation, as opposed to a spatial representation. First, progressive refinement is a natural consequence of the representation. We are free to limit the samples taken to the low-frequency region of the slicing plane near the origin. This allows the complexity of both the resampling and inverse transformation stages to be reduced, resulting in a smaller image that can be interpolated up to arbitrary size. Spatial filtering operations are also simple and computationally inexpensive to implement with a frequency domain representation. Spatial filtering
2Voxel colors and a’s are weighted by the footprint kernel values. This requires 4 multiplies per kernel pixel. (1 – a,) is also required by the over operation, which needs 2 multiplies and 1 add for each of the three color components. Therefore, we need 10 multiplies and 4 adds for each pixel of the blending kernel associated with each voxel. ‘]Screen space interpolation can be done in two passes, one in each axis, Between two points in y, we incur one subtraction, one shift, and (1024/2N – 1) adds. There are roughly 4N 2 pairs of such points. In x we incur the same number of operations per pair of points, but now there arc 2048N such pairs. This yields a total of (2N + 1024)Z operations. ACM Transactions on Graphics, Vol. 12, No. 3, .July 1993.
248
.
Tom Maizbender
10’2~
‘
.,--6
‘1
Inverse Hartley Transform Only (m = resampling kernel size)
l(po~ 1(P
1
1o’1
N, where N A 3 is size of DataSet Fig. 13. Volume rendering complexity for N x N image.
is often applied in image processing, where mild high-boost filters can lead to the overall appearance of increased image sharpness. Arbitrary low, high, and bandpass filters can all be defined and implemented in the frequency domain as simple multiplications of each frequency value by a precomputed filter coefficient. This is to be contrasted with performing a more expensive convolution in the spatial domain. Cross-correlations are useful for feature detection in image processing and can also be employed for 3-D scalar data sets [1]. If a feature q(x, y, z), with transform Q(wX, WY,w, ), is present in our data set, then it can be found by finding the maximum of the cross-correlation: Z(x, y,z)
=
N-IN–IN–1 ~ ~ ~ f(x, y,z)q(x tz=o ty=o tx=o
+tx,
y+ty,
z+tz).
For typical discrete 3-D data sets, however, this operation is expensive. For large data sete, this computation can be performed more efficiently in the frequency domain, since z(wx,
wY, w.)
=F(wx,
wy, wz)Q*(w,,
wy, wz),
where Q*( ) is the complex conjugate of Q( ). Therefore, domain representation, we only need to compute z(x, y,z)
= FFT-l[F(wX,
using the frequency
wY, wZ)Q*(wX, wY, wZ)~
and to find its maximum. ACM‘lYansactions on Graphics,Vol. 12,No. 3, July 1993.
Fourier Volume Rendering
8. CONCLUSION
AND
FUTURE
.
249
WORK
We have developed a technique for using the Fourier Projection-Slice Theorem in volume rendering. It allows one to compute the projection of a 3-D scalar function by evaluating only a 2-D slice of the function represented in the frequency domain. The technique is computationally less expensive than current approaches and should allow interactive display when implemented on current digital signal processing chips. The projection image computed is a strict line integral of the function, which gives it the quality of looking like an “X-ray” of the data set. The difflcult problem of overcoming this limitation and of introducing hidden surface effects, perhaps through the use of alternative nonlinear transforms, is an unexplored issue. ACKNOWLEDGMENTS
Ken Neighbors deserves thanks for the implementation of the Hartley Transform Code as well as for being instrumental in helping uncover the various aliasing mechanisms present in a naive prototype. Ron Pulleyblank is responsible for suggesting spatial premultiplication and was an effective “signal processing sounding board.” The need for spatial data shifting was pointed out by John Jackson, of Stanford’s MRI group. FFT code was provided for early prototypes by Vasudev Bhaskaran. The medical data set used in the figures is courtesy of I. Jackson, U. Bite, and G. Forbes at the Mayo Clinic. REFERENCES ANUTA, P. Spatial registration of multispectral and multitemporal digital imagery using fast Fourier transform techniques. IEEE Trans. Geosci. Electron. GE-8, 4 (Oct. 1970), 353-368. 2. BRAc~ww.]., R. The Fourier Transform and Its Applications. Rev. 2nd ed. McGraw-Hill, New York, 1986, pp. 385-410. .3. BKAr~wM.[.,R. Assessing the Hartley transform. LEEE Trans. Acoustics, Speech Signal
1.
Process. 38, 12 (Dee.
1990), 2174-2176,
4. BRR;IiAM, E. The Fast Fourier Transform. Prentice-Hall, Englewood Cliffs, N. J., 1974. t5. BINWKS, R. Computational principles of transmission CT. In Medical Physics of CT and [Ultrasound. American Institute of Physics, New York, 1980, pp. 37-52. 6. CAHTWIUGHT,M. Fourier Methods for Mathematicians Scientists and Engineers. Ellis Horwood, New York, 1990. 7. CIVANLAR, M. R., AiWI NOBAKHT, R. A. Optimal pulse shape design using projections onto convex sets. In ICASSP 88 Proceedings, vol. 3, (New York, Apr. 11– 14). IEEE, New York, 1988, pp. 1874-1877. 8. DRFUHN,R., CARIWNTIiR, L., ANO HANRAHAN, P. Volume rendering. Comput. Graph. 22, 4 (1988), 65-74.
D,, ANDMERS~R~A(J, R. Multidimensional Signal Processing. Prentice-Hall, N.J., 1984, pp. 81, 82, 363-383. S., NAPM,,S., ANO RLTn, B. Fast reprojection of volume data. In Proceedings of the 10. DLT~PW, 9.
DI”IXWON,
1st Conference
on Visualization
in Biomedical
Computing.
1990, pp. 11-18.
11 FL’(’HS, H,, LEVOY, M., PIZ~R,S., AND ROSENMAN, J. In NCGA ’89 Conference Proceedings, vol. 1. (Apr.). 1989, pp. 118-131. 12. HANRAHAN, P. Three-pass afhe transforms for volume rendering. Computer Graph. 24, 5 (Nov. 1990), pp. 71-78. 13. KA(’i’MAN, A. Volume Visualization. IEEE Computer Society Press, Los Alamitos, Calif., 1991. ACM Transactionson Graphics,Vol. 12, No. 3, July 1993.
250
.
Tom Malzbender
14, LEVOY,M. Display of surfaces fmm volume data. IEEE Cornput. Graph. AppL 8, 3 (May 1988), 29-37. 15. LEVOY,M, Display of surfaces from volume data. Doctaral dissertation, Dept. of Computer Science, Univ. of North Carolina at Chapel Hill, May 1990. 16. LEVOY,M. Viewing algorithms. In Volume Visualization. A. Kaufman, Ed., IEEE Computer Society Press, Los Alamitos, Calif., 1991, pp. 89-92. 17, MERSEREAU, R., AND OPPENHEIM, A. Digital reconstruction of multidimensional signals from their projections. Pmt. IEEE 62, 10 (Oct. 1974), 1319-1338. 18. PAPOULW, A. A new algorithm in spectral analysis and band limited extrapolation. IEEE Trans. Circuits Syst. CAS-22, 9 (Sept. 1975), 735-741. 19. SABELLA, P. A rendering algorithm for visualizing 3D scalar fields. COrnput. Graph.22, 4 (Aug. 1988), 51-55. 20. UPSON, C., ANDKEELER, M. V-Buffer Visible volume rendering. Comput. Graph. 22,4 (Aug. 1988) 59-64. 21. WEBBER,R. Ray tracing voxel data via biquadratic local surface interpolation. Visual Cornput. 6, 1 (Feb. 1990), 8-15. 22. WESTOVER,L. Footprint evaluation for volume rendering. Comput. Graph. 24, 4 (Aug. 1988), 367-376. 23. WHI’ITED,T. An improved illumination model for shaded display. Commun. ACM 23, 6 (June 1980), 343-349. 24. YANG,D. New fast algorithm ta compute two-dimensional discrete Hartley transform. Electron. Lett. 25, 25 (Dec. 1989), 1705-1706. Received May 1991; revised May 1991; accepted April 1992 Editor: Alain Fournier
ACM Transactions on Graphics, Vol. 12, No. 3, July 1993.