Mar 21, 2008 - artificial objects made of biocompatible materials is surface roughness. ..... analyses for particular applications, accompanying software does not allow ... Custom-made procedure for fractal dimension calculation based on ...
FRACTAL APPROACH FOR SUBSTRATES SURFACE TOPOGRAPHY IMAGE EVALUATION B. Bojovic1, M. Kalajdzic1, Z. Miljkovic 1, B. Babic 1 1. University of Belgrade, Faculty of Mechanical Engineering, Production Engineering Department, Kraljice Marije 16, Belgrade 35 11120, Republic of Serbia
ABSTRACT It is well known that bio/non-bio interface between the living tissue and the artificial object is established through its surface. The main physical attribute of these artificial objects made of biocompatible materials is surface roughness. Surface characterization, as a part of the coating characteristics, needs to be defined in order to describe the surface complexity. The roughness of coatings and substrate surface was found to demonstrate fractal properties. This is why fractal dimension is suggested as a parameter for the evaluation of contact lens surface topography images. KEYWORDS: Fractals, Coatings, Surface, Image
1.
INTRODUCTION
The contact lens (CL) surface can be manufactured either directly with appropriate surface finish, as the case is with rigid gas permeable contact lens (RGP CL) or by additional surface engineering, such as coating with a flexible oxygen-permeable DLC-film /1/ , which is done in case of soft silicon CLs. The main reason for applying surface coating in this case is to enhance wettability and hydrophilicity. Some examples of mentioned CLs are given in following figures: for RGP CLs see figure 1, and for soft CLs see figure 2.
Figure 1: An unworn RGP contact lens made of Enflufocon B III 3 material, with saline solution droplet on it.
Figure 2: Soft silicon rubber contact lenses: the lens on the left hand side is coated with a flexible oxygen-permeable DLC-film and the one on the right hand side is uncoated, where both have a water-droplet on them. Figure was taken from /1/. Proceedings of the 3rd International Conference on Manufacturing Engineering (ICMEN), 1-3 October 2008, Chalkidiki, Greece Edited by Prof. K.-D. Bouzakis, Director of the Laboratory for Machine Tools and Manufacturing Engineering (ΕΕΔΜ), Aristoteles University of Thessaloniki and of the Fraunhofer Project Center Coatings in Manufacturing (PCCM), a joint initiative by Fraunhofer-Gesellschaft and Centre for Research and Technology Hellas, Published by: ΕΕΔΜ and PCCM
443
The materials for soft silicon rubber contact lenses have to be modified with diamond-like carbon (DLC) coating produced by plasma-assisted physical vapour deposition (PAPVD). The plasma-based surface modifications of strongly hydrophobic substrate surface results in a hydrophilic soft lens surface. Evidence of this can be observed by comparing the water-droplet on the coated surface with the one on substrate surface in figure 2. A leading provider of metrology and process equipment solutions reports, on the company website, an interesting example /2/ of the novel hydrophobic polymer lens material, which is coated with a hydrophilic film. The pits on the uncoated hydrophobic substrate surface were the reason for occurrence of unexpected sub-micron spots with different material properties on the coated lens surface. During the coating process, the hydrophilic coating filled in the pits and, upon exposure to water, swelled to form the sub-micron spots. In order to avoid such shortcoming the lens manufacturer has had to modify the process in order to eliminate the pits in the hydrophobic substrate. As opposed to RGP lenses, which are made of material that already has a hydrophilic surface, soft contact lenses made of silicon rubber require additional coating in order to obtain biocompatibility. The above-mentioned example has proven the necessity of surface coating, as well as problems that may occur in the course of such treatment. Inappropriate surface topography, in particular the dip pits in case of CL substrate, can cause problems in further modification. Thus, surface characterization, as a part of the coating characteristics, needs to be defined in order to describe the surface complexity. In this paper the authors aim to draw attention to fractal analysis for substrates surface roughness as a method for establishing the parameter for optimal surface topography investigation.
2.
SURFACE CHARACTERIZATION
2.1 Standard parameters shortcomings The following questions are of particular importance in the characterization of coated surface textures: • • • • • •
How to describe the changes in roughness between substrate and coated surface? What features of substrate surface topography change after coating? How to describe these changes numerically? Which CL surface will retain fluid, meaning tears? Which CL surface will adhere well? Which CL surface is susceptible for organic depositions?
There is no single standard parameter that can provide answers to these questions. Use of more then one roughness parameter will enable comparison of surfaces, because it exhibits more shortcomings. This is mainly due to the partial information contained in each descriptor. Authors belong to the group of researches who prefer fractal parameter characterization as opposed the standard ones, because the latter are simply not good enough. While average roughness (Ra) remains useful as a general guideline of surface textures, it fails to describe the surface’s functional nature. Ra makes no distinction between peaks and pits, nor does it provide information about spatial structure. One is supposed to use a number of standard surface parameters to distinguish surfaces, compare them and predict functional behaviour in use. 3D parameters provide more details calculated from 3D topographical measured data. European consortium has adopted a set of standard S parameters in four general categories /3/: amplitude, spatial, hybrid and functional. 3D parameter set considerably extends the degree to which surface analysis can uniquely characterize both sample shape and function. However, there is still a need to use, for instance, amplitude and functional parameters for characterization and functional prediction of CL surface adhesion in the eye. The need to describe the surface characteristics with more then one parameter is the most important constraint in texture surface standard implementation.
444
3rd ICMEN – 2008
2.2 Fractal surface roughness analysis In order to significantly improve surface characterization, fractal parameter uniquely distinguishes not only surface roughness but functionality as well. A careful surface technology study will result in better understanding of functional characteristics, more controllable process and, ultimately, better surface performance. Mandelbrot describes self-similar fractals using single parameter, fractal dimension D, which is the intrinsic property of the surface and is not related to the scale of measurement. Real surfaces are called self-affine and additional parameter is needed for their description. This is a scaling factor called topothesy, according to Thomas, et al., who established milestones for fractal surface roughness analysis /4/. Machined surfaces are likely to be multifractal because they are usually produced by several processes. The rough preliminary machining produces the form and waviness of the surface. The finishing process produces the final roughness of the surface. Over the last decades, a number of scholars have provided fractal descriptions of engineering surfaces, with a general conclusion of fractal approach usability. Each biomedical surface of CL (inner and outer) is designed to be application-specific. To produce them, micro-machining are used for either direct polymer surface generation or tooling for molding processes. After micro-machining, the polishing as a finishing process takes place. According to /1/, some soft CL surfaces need to be improved in order to enhance wettability and hydrophilicity. Surface engineering, in terms of surface coating, is an addition of a layer of different material to the original surface, called the substrate, as defined in /3/. The substrate is selected based on mechanical and physical characteristics and manufacturability. Regardless of surface manufacturing, the main surface physical attribute is surface roughness. The results of applying fractal dimension to the evaluation of the surface topography of substrates and relating them to the preferred subsequent coating topography have proven that fractal dimension properly evaluates the surface roughness. Hence, this paper focuses on the quantification of the textures of CL substrate surfaces, applying a method differing from the standard parameters characterizations. Fractal analysis was used for quantitative characterizations of substrate surface textures. One obvious way to describe the changes is to investigate height distribution. Fractal geometry provides a useful tool for the analysis of complex and irregular structures such as surface topography. These fractal analyses are based on image analysis methods that consider an image as a 3D surface. The image pixels are identified by their x, y position and the grey tone function is the z dimension. Two widely applied methods for calculating fractal dimension of surface will be given in this section. These methods presuppose surface recording as an image, mainly by using scanning electron microscopy (SEM) or scanning probe microscopy (SPM). The slit-island method (SIM) for fractal dimension calculation was proposed by Mandelbrot /5/, who describes it as a relation between island area A and perimeter P, and discovered the existence of fractal dimension D in it, see eq. 1. The exponential law stands for this relation /6/. The slit-island method consists of sectioning the surface images with a plane at a given height. As a result, different island-like areas appear for different height values. Fractal dimension can be obtained from double logarithmic diagram, which represents the relation between the island area and corresponding island perimeter, see eq.2.
P 1 / D ∝ A1 / 2
(1)
log P = 0.5 D log A + c
(2)
The skyscrapers analysis was originally suggested by Caldwell for fractal dimension calculation of digitized mammography. Pixels that constitute an image can be considered as skyscrapers, the height z(x,y), of which is represented by the intensity of the grey. The surface area of the image A is obtained by measuring the sum of the top squares, representing skyscrapers roofs
Surfaces and Materials Characterization
445
and the sum of the exposed lateral sides of the skyscrapers, according to /7/ and shown in eq.3. The roof of skyscrapers increases subsequently by adjacent pixel grouping and averaged the gray levels. The square size ε is 2n. The fractal dimension of the surface is determined by plotting a double log graph of surface area of the images vs. square size. The linear regression line was used for fitting plot, and the fractal dimension was obtained from the slope.
[
A(ε ) = ∑ ε 2 + ∑ ε z (x, y ) − z (x + 1, y ) + z (x, y ) − z (x, y + 1)
]
(3)
Since fractal analysis began with image recording, the next section deals with SPM techniques suitable for CL surface texture measurement.
3.
MEASUREMENT OF CL SURFACE TEXTURE
3.1 Choice of SPM techniques The adequate measurement of surface texture provides valuable data for its characterization that helps improve substrate performance. The measurement is relevant as an integral part of surface characterization in order to advance R&D and quality control. Contact lens is fragile and made of non-conducting material, which conditions the choice of tapping mode atomic force microscopy (AFM) for measurement. In order to obtain quality images, it is critical that the microscope tip does not damage the surface being scanned, but at the same time make contact with the surface, so as to provide high resolution measurements. This is where tapping mode imaging excels and for contact lens materials this technique provides the highest resolution possible without sample damage. The tip in tapping mode imaging is alternately put in contact with the surface, to provide high resolution, and then lifted off the surface, so as to avoid dragging the tip across the sample. The interaction with the surface (tapping) leads to energy loss and reduced oscillation amplitude, demonstrated in Figure 3. The reduction in oscillation amplitude is used to identify and measure surface features, as explained in /8/. Essentially, as the tip passes over a bump in the surface, the cantilever has less room to oscillate and the amplitude of oscillation decreases. Conversely, when the tip passes over a depression, the cantilever has more room to oscillate and the amplitude increases (approaching the maximum free air amplitude).
Free amplitude
Tapping
Fluid layer Amplitude reduced
Figure 3: Tapping mode cantilever oscillation amplitude in free air and during the scanning, taken from /8/. 3.1 Experimental work Recent literature reports the practice of coating soft CL and CL cases with thin layers of DLC, in order to improve CL hydrophilicity and reduce biofilm formation. Also, a significant number of
446
3rd ICMEN – 2008
soft CL users render substrate surface roughness characterization a practical example of considerable importance. Absence of coating lens manufacturers in our country, on the one hand, and their plans for development, on the other, justify our selection of CL surface instead of CL substrate surface for fractal methodologies development. Experimental work has been conducted on commercial JOEL scanning probe microscope JSPM 5200. The tapping mode AFM was used on account of its ability of non-destructive highresolution imaging of soft and fragile samples in ambient environment. Measuring parameters are shown in table 1. Table 1: JSPM-5200 measuring parameters set for CL. 2 Inputs(512):AFM AC: Topography(FW) Image size : 3.450 x 3.45 μm Image height : 0.289 μm Reference : -2.76 V Bias Voltage : 0.000 V No of pixels (512,512) Filename :E:\contact lens\004\ contact lensA0000000004.tif Created on 2008-03-21 at 14:57:25 Saved on 2008-03-21 at 15:11:19 General : Measured by JSPM-5200 SPM PARAMs : Clock speed : 666.67 us Image Angle : 0deg Feedback Filter : 0.01 Hz Loop gain : 16 Image Offset : 0.000 x 5025.3 nm CANTILEVER : Peak Frequency : 53.853 [kHz] Q Factor : 167.582 OSC PARAMs : OSC Frequency : 53.593 [kHz] Output Amp. : 2.784 [V] Phase Shifter : -18.330 [deg] Phase Polarity : Normal H-Pass Filter : 0 [kHz] L-Pass Filter : 0 [kHz] RMS-DC Output : 10 RMS Filter : Normal High Output : ON External OSC : OFF PROCESSING : Subtract Background Data 0x0000: 0.000 Data 0xffff: 288.640 AC
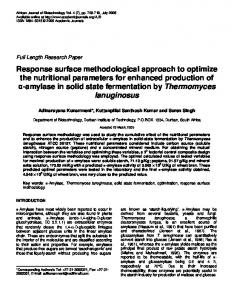
Topography image of CL surface was recorded under conditions given in table 1, and shown in figure 4. CL surface was manufactured by turning with diamond tool, producing the circular
Surfaces and Materials Characterization
447
pattern of lay of direction. Careful observation of topography image shows the area representing the spacing of the radial grooves on polymer surface.
Figure 4: AFM tapping mode generated Topography image of CL surface.
Microscope JSPM5200 accompanied by software, provides, among others, analysis of the surface characterization using standard roughness parameters, either profile or surface ones. Accompanying software offers images in various popular formats and ASCII file with five digits numbers associated to image pixels. If a user wants to generate their own, unique data analyses for particular applications, accompanying software does not allow exporting of 3D surface data. In order to process such data through custom algorithms in other software environment, like Matlab, ASCII file was analyzed concurrently with image stored in .tiff format, reported in following section.
448
3rd ICMEN – 2008
5.
FRACTAL DIMENSION CALCULATION
Matlab, as a high-level technical computing language and interactive environment, was used for image processing, data visualization, data analysis and data computation of microscopy recorded images, as well as of data stored in ASCII files. In particular, the image processing toolbox provides a set of reference-standard algorithms and graphical tools for image processing, analysis, visualization, and custom algorithm development, which was useful for fractal dimension determination. 5.1 Fractal dimension analysis by SIM Image analysis and custom-made procedures have been used to calculate the fractal dimension by the SIM. The image analysis results are shown in figure 5. Placed in the centre is the plot of the image shown in figure 4, which was sliced on ten levels, making slit regions distinguished by grey scale. It is obvious that island-like entities appear in image represent cut off region. For fractal analysis image height is divided on thirty levels suggesting in /9/. Images generated on such way is converted in black and white, where white areas represent cut-off surface, and black represents the remaining one. Peripheral black and white plots in figure 5, show certain slice levels.
Figure 5: Presentation of SIM including appropriate slit regions. Area determination and adequate perimeters was done using image processing graphical tools and custom-made application. Area of white image region is calculated as sum of pixels con-
Surfaces and Materials Characterization
449
taining digits 1, and perimeter is calculated using specialized function (bwperimeter). When the graph of log(Perimeter) versus log(Area) is rectilinear, the fractal dimension is deduced from the slope. Since expected distribution of the graph was missing, it was impossible to apply linear fitting. The possible reason for that failure is existence of image boundaries. Only a small part of CL surface was recorded and slicing by the levels caused coast-like appearance rather then lakes or islands. Problems appearing in SIM application were reported earlier in /9/ and various adaptation of original SIM can be found. According to reference /6/, there is a possibility of coast line method incorporation for partial island fractal dimension calculation. Further effort is invested in order for SIM to be applied in substrate surface roughness. It resulted in method modification assuming fractal validness only in upper quarter of image height. Applying SIM in 30 levels slicing in restricted height it was able to calculate fractal dimension Ds=2,4739. The loglog plot, shown in figure 6, is fitted by line and its slope is used in eq.4 for fractal dimension determination.
log P =
Ds − 1 log A + c 2
(4)
Figure 6: The graph of log(Perimeter) versus log(Area) with fitted line. 5.2 Fractal dimension analysis by skyscrapers method Custom-made procedure for fractal dimension calculation based on “skyscrapers” method is generated using image processing toolbox, as well as custom-developed algorithm. Topographic image recorded in tapping mode AFM is imported in tiff format. The image is of 512x512 pixels in, accompanied by ASCII file, which contains 262144 five-digit numbers. That image is considered as an intensity image type, and represents 512-by-512 array of 8-bit integers that are linearly scaled to produce colormap indices in range [0,255]. ASCII data is modified into matrices size 512-by-512, converting the numbers in 16-bit integer. Such matrix represents an intensity image type with grey scale colormap. The range of values is [0, 65 535]. The image generated from ASCII file is more sensitive compared to tiff image. For that reason gray scale 16-bit image was modified for skyscrapers area calculation. The roof of skyscrapers is increased subsequently by adjacent pixel grouping, causing averaging of the gray levels. The first four of all six images are shown in figure 7. They are generate for adequate square size, where ε is 2n. There are obvious changes in appearance caused by subsequent averaging.
450
3rd ICMEN – 2008
Surface area for images is determined using eq.3. These pairs of points (P,A) in double log graph are arranged along the straight line (shown in figure 8). The linear regression is used for fitting the plot and the fractal dimension is obtained from slope using eq. 5, using custom-made procedure for calculation. Fractal dimension generated for image shown in figure 4, by skyscrapers method is Ds=2.496.
log A = (2 − Ds) log ε + c
(5)
Figure 7: The images with square size ε=1,2,4,8. Area
log-log plot
ε
Figure 8: Area vs. square size in double log plot with linear fitting.
Surfaces and Materials Characterization
451
Fractal dimensions calculate by two different method are very close. Substrate surface topography with that fractal dimension can be considered as inappropriate given the probability of dip pit appearance, which causes problems during coating process. Fractal dimension should be closer to 2, which would represent a less rough surface.
6.
CONCLUSIONS
Polymer products used as biomaterials, including contact lenses, have represented one of the fastest growing sectors in the medical devices industry. Coatings are used for optimizing functional characteristics such as wetting, unimpeded tear-flow and tears retention. The problems occurring during coating treatment caused by inappropriate surface topography, in particular the dip pits in case of CL substrate, can make problems in further modification. Surface roughness characterization was obtained in two steps: tapping mode AFM measurement and quantification of the surface roughness using MatLab images processing toolbox and custom procedures. Subsequent fractal analysis consisted of two methodologies for surface fractal dimension determination: slit-island and skyscrapers analysis. By applying fractal dimension to the evaluation of the surface topography of substrates and relating it to the properties of surface coatings, it was concluded that fractal dimension calculated by skyscrapers analysis properly evaluates surface roughness, as opposed to slitisland analysis, which demonstrates shortcoming in this case.
7.
REFERENCES
1. Engemann J., Impact of wide dynamic range plasma sources for advanced plasma processing, Surface and Coatings Technology 169 –170, (2003), 14 -19. 2. Serry, F.M., “Application of Atomic Force Microscopy for Contact Lens Manufacturing”, Metrology & Instrumentation Application Notes, AN22, www.veeco-europe.com 3. Ramsden J.J., Stephenson D.J., Alcock J.R., Peggs G.N., Fuller G. and Goch G., The Design and Manufacture of Biomedical Surfaces, Annals of the CIRP, Vol.56/2, (2007), 687711. 4. Thomas T.R., Rosen B.G., Amini N., Fractal characterization of the anisotropy of rough surfaces, WEAR, Vol. 232 (1999), 41-50. 5. Mandelbrot, B., FRACTALS-Form, Chance and Dimension, W.H. Freemanand Co., San Francisco, (1977). 6. Yuan C.Q., Li J.,Yan X.P., Peng Z., The use of the fractal description to characterize engineering surfaces and wear particles, WEAR, Vol.255, (2003), 315-326. 7. Chappard D., Degasne I., Hure G., Legrand E., Audran M., Basle M.F., Image analysis measurements of roughness by texture and fractal analysis correlate with contact profilometry, Biomaterials, Vol. 24, (2003), 1399-1407. 8. Prater, C.B., Maivald, P.G., Kjoler, K.J., Heaton, M.G., “Tapping Mode Imaging Application and Technology”, Metrology & Instrumentation Application Notes, AN04, www.veecoeurope.com 9. Bigerelle, M., Iost, A., Statistical artefacts in the determination of the fractal dimension by the slit island method, Engineering Fracture Mechanics 71, (2004), 1081-1105.
452
3rd ICMEN – 2008