they are broadly categorized as feature-based (FB) classifiers and likelihood-based .... The SRM itself is implemented in Python and C++ con- sisting of three ...
Framework for Automatic Signal Classification Techniques (FACT) for Software Defined Radios Jithin Jagannath, Hanne M. Saarinen and Andrew L. Drozd ANDRO Advanced Applied Technology, ANDRO Computational Solutions, LLC, Rome NY, USA {jjagannath, hsaarinen, adrozd}@androcs.com Abstract—The objective of this work is to design and implement a novel framework for automatic signal classification techniques (FACT) for software defined radios (SDR) capable of classifying multiple signals simultaneously. The focus of this work is to create a modular classification framework to facilitate the testing and implementation of new classification methods. The framework is divided into three parts: (i) Sensor resource manager (SRM), which performs the initial signal detection, preprocessing and the delegation of secondary receivers to the corresponding signals of interest (SOIs); (ii) Modulation classifier block (MCB), which takes the received signal from SRM and performs the required modulation classification and (iv) Data library and statistical block contains all the templates required to perform classification, thresholds for signal detection and also known parameters of expected signals. To prove the feasibility of the framework, FACT is implemented and tested on a Universal Software Radio Peripheral (USRP) test bed using GNU radio signal processing toolkit. We evaluate the performance of signal detection based on the probability of detection (Pd ) in varying signal-to-noise ratios (SNR). Additionally, the USRP based experiments demonstrate FACT operating as a single unit, preforming both blind detection and classification of multiple SOIs using different classification methods.
I.
I NTRODUCTION
With an increasing number of wireless devices, the radio frequency (RF) spectrum is becoming increasingly congested. Spectrum sharing using cognitive radio will maximize the utilization of the existing spectrum. An important functionality of cognitive radio is detection of available spectrum (i.e spectrum holes) by classification and identification of primary user signals. Additionally, signal detection and classification are paramount to several civilian and military applications such as dynamic spectrum access (DSA), authentication, threat detection etc. Signal detection and classification are challenging tasks, especially in a non-cooperative environment where various factors like interference, low SNR, fading, phase and frequency offsets cause distortion to the received signal. SDRs are widely used for the various civilian and military applications mentioned above. The flexibility provided by SDRs makes them ideal for implementing a framework that performs blind detection and classification of unknown signals. The objective of this paper is to design and implement an SDR based framework in order to perform signal detection and classification of multiple SOIs. The framework is beneficial in all the cognitive radio applications discussed above and it enables easy integration with existing systems. It will also serve as a common platform for the evaluation of multiple
detection and classification techniques under controlled experimental conditions. Automatic modulation classification (AMC) is an intermediate step between signal detection and demodulation. In a hostile non-cooperative environment, it is important to detect a friendly signal and demodulate it securely, while simultaneously detecting and jamming the intruder signal. AMC is an important element that helps to detect and classify the unknown signal. It is advantageous to exploit the flexibility of SDRs and re-configure the transceiver between various modulation schemes in response to the available spectrum or channel condition. Since feedback is traditionally provided by the transmitter prior to the reconfiguration, an intelligent transceiver equipped with AMC will increase the transmission efficiency of the radios by automating the reconfiguration process without the need for feedback. Due to the non-cooperative nature and real-world scenarios, AMC faces various challenges due to unknown carrier frequency and phase offset, time offset, signal power, multipath fading, frequency selective fading etc. These techniques have been studied for more than a decade and they are broadly categorized as feature-based (FB) classifiers and likelihood-based (LB) classifiers. Due to the various kinds of digital modulation techniques and similarly the wide variety of detection and classification methods, it is difficult to select a single detection and classification method that is applicable in all scenarios. This work focuses on developing and implementing a flexible framework that is capable of using algorithms and techniques to perform blind detection and classification of unknown RF signals. Depending on the application or the expected SOI, the framework will dynamically select between different techniques to maintain the desired performance. This dynamic nature will also allow the transceiver to adapt to the QoS requirements of the system. This framework implemented using USRPs will also become a platform for facilitating the implementation and testing of new AMC algorithms and detection techniques for SDRs. The aim of this paper is to discuss the design and implementation of FACT and demonstrate the framework’s capability to use real hardware platforms to detect and classify multiple SOIs. The rest of the paper is organized as follows. In Section II, we review common approaches in detection and classification. We discuss the design of FACT in Section III. Next in Section IV, we describe the experimental configuration used to evaluate FACT. Finally, the conclusion and future work is presented in
c 2015 IEEE 978-1-4673-7557-3/15/$31.00
Section V. II.
R ELATED WORK
Signal detection is the necessary first step in automatic signal classification when the signal parameters such as the center frequency and bandwidth are not known prior to classification. Various detection techniques have been developed for cognitive radio networks. The authors in [1] give an overview on the recent advances in spectrum sensing by describing multiple spectrum sensing strategies including energy detection, cyclostationary based detectors, second-order statistical detectors and cooperative sensing methods. Energy detection has been widely implemented due to its simplicity and good performance in high SNR. Low SNR environments require more computationally complex methods such as the cyclostationary feature based detector described in [1]. The authors in [2] and [3] studied the performance of both, energy- and cyclostationary based detectors on a GNU Radio based test bed using commercially available SDRs. While the implementation of different detection techniques on various hardware platforms is an area of research on its own, the theoretical work on spectrum sensing provides the underlying algorithms which determine the performance of most signal detection schemes. In [4], the authors offer an adaptive spectrum sensing technique with an estimation of the unknown noise variance. A crucial part in the performance of an energy detector is the estimation of noise. The detection threshold is dynamically changed based on the current channel conditions using models based on the probability of false alarm, noise variance and number of collected samples [2], [3] and [4]. The next step after signal detection is AMC, which has been studied for over a decade and there is a large number of techniques available in the literature. Some preprocessing is usually applied on the received signal samples before iden˙ tifying the modulation type.This preprocessing may include noise reduction, estimation of carrier frequency, phase offset, signal power etc. The requirements of this preprocessing in terms of accuracy and processing time are dependent on the application and classification algorithm being employed. There are multiple techniques used for performing classification of modulation [5]. These techniques are broadly classified into two types, FB methods [6]–[14] and LB methods [15]–[20]. The advantage of the FB approach is the ease of implementation, low computational complexity and a near optimal performance when the classifier is designed well. On the other hand, the LB approach computes the likelihood of the received signal by assuming that the conditional probability density function of the received signal on a given modulation format is available. The final classification decision is made by testing multiple hypotheses. This method is optimal in the Bayesian sense but it is computationally complex. Some FB approaches use features that extract information in the instantaneous amplitude, phase and frequency of the received signal to make a classification decision. Examples of these features include maximum power spectral density of normalized centered amplitude, standard deviation of normalized centered amplitude, phase and frequency [6]. Usually such FB techniques implement a decision tree approach, such that the first stage decides whether the modulation belongs to classes such as ASK, PSK, FSK etc. Subsequently, in the
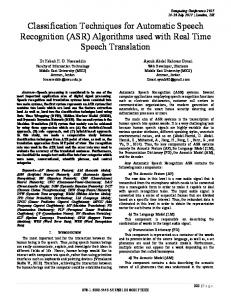
Fig. 1: Framework for automatic signal classification
next step the order of the modulation scheme is determined. Some other FB approaches include wavelet transform based algorithms [14] and signal statistics based algorithms which use cyclic cumulants [11]–[13]. The LB approach is divided into three main categories depending on how the unknown quantities are modeled. Average likelihood ratio test (ALRT) models unknowns as random variables, general likelihood based approach (GLRT) models unknowns as deterministic and hybrid likelihood ratio test (HLRT) models unknowns as both deterministic and random variables. The ALRT based algorithms usually have higher computational requirement when compared to HLRT and GLRT. There has been several works aimed to reduce the computational complexity of an LB approach [19]. Additionally, there are works which use multiple sensors to improve the classification performance [18]–[20] especially in the low SNR scenarios. Overall, it can be seen that the performance of LB schemes is optimal in the Bayesian sense but the total computational time it takes to get to a decision might be longer than what the system requires. Although some of the work mentioned above shows the ability to classify a wide range of modulation schemes, most of the proposed AMC techniques provide a solution to classify only a subset of modulation schemes used today. It can also be observed that efficiency of operation for each method may be limited by SNR, the assumptions made about time offset, frequency offset and computational complexity etc. In other words, one method (e.g. FB approach) of AMC may be suitable over the other (e.g. LB approach) depending on the application and existing scenario or vice versa. This induces the need to have multiple classification algorithms available for use to cover a wider number of modulation schemes and various operational configurations. A central decision center is also needed to detect various active SOIs and choose most appropriate modulation classification techniques for each SOI. To the best of our knowledge, there is very little work which
Fig. 4: Energy detection using GNU radio
A. Sensor resource manager Fig. 2: Sensor resource manager
Fig. 3: SRM frame structure
evaluates the performance of AMC using actual SDR hardware [2], [18] rather than simulations. Thus, the aim of this paper is to provide a novel SDR based framework to enable such capabilities and extract benefits of using hybrid (both LB approach and FB approach) classification techniques. Additionally, the intend is to encourage and facilitate the process of implementing detection and classification techniques on software defined hardware like the USRP.
III.
F RAMEWORK
DESIGN
Figure 1 depicts the overall design of FACT developed for a cognitive radio based test bed. FACT will perform detection and modulation classification of multiple SOIs. As illustrated in Fig. 1, the black and blue lines represent the received signal flow and the information and control flow respectively. The SRM acts as the intelligence center for FACT. SRM is attached to a wideband primary receiver which performs the initial signal detection. The primary receiver looks for any activity within the target spectrum assigned by the application to extract the center frequencies and bandwidths of the detected SOIs. Next, the SRM delegates the secondary receivers to monitor each detected signal individually and to collect data for the modulation classifier block. The SRM will then perform the initial preprocessing of the individual signals and divide them into multiple frames with corresponding headers referring to the type of modulation classification to be used by the classifier. This encapsulation process will be application specific and the SRM uses information from the preprocessing and the data library to choose an appropriate classification method. According to the headers provided by the SRM, MCB may have to perform multiple levels of classification instead of just one. The final decision is made by the MCB and this information is updated in the data library to provide feedback to the SRM and to evaluate the performance of FACT.
As shown in Fig.2, the SRM controls the operation of two types of sensors: (i) A primary receiver (RX) that continuously scans the target spectrum for potential signals. The receiver can be any commercially available SDR with a re-tunable radio front end that has a wide frequency range and large digital/analog bandwidths, both essential in wideband spectrum sensing. (ii) A variable number of secondary receivers (RX1 ... RXn ) that can be low cost sensors with lower frequency ranges and bandwidths than the primary receiver. The secondary receivers are assigned by the SRM for narrowband data collection at specific frequencies and sample rates depending on the signal detection results. In case of a spread spectrum signal, another primary classifier can be used for cyclostationary analysis at target frequencies. The SRM itself is implemented in Python and C++ consisting of three main software modules: signal detection module (energy detector), sensor assignment module and signal extraction module. The signal detection module is chosen by the SRM depending on the RF environment and the types of signals to be detected. Energy detector is initially chosen as the spectrum sensing module due to its simplicity and good performance in high SNR. After additional sensing modules become available, the SRM will adaptively choose between different sensing techniques. The sensor assignment module assigns secondary receivers based on the signal detection results. Meanwhile, the primary receiver continues to perform wideband spectrum sensing for any additional signals. The center frequency and bandwidth estimates of all detected signals are put into a queue by the signal detection module. Next, the sensor assignment module accesses this queue and evaluates the available resources to efficiently assign secondary receivers for each SOI in the queue. Finally, the signal extraction module performs the required preprocessing to extract the desired signal from noise or it combines signals from multiple sensors and encapsulates the data. The filtered complex data samples are arranged into frames with a corresponding header as shown in Fig.3. The header consists of a signal ID, frame ID, time of detection, estimated signal parameters such as the frequency and bandwidth, suggested classification method, Rx ID signifying which radio(s) collected the data, frame length and an empty reserve field for the classification result (modulation type) as shown in 3. These frames are passed on to the MCB which uses the information in the header to perform the required modulation classification. The method of signal detection that is currently implemented in FACT is explained below. The detection of a signal from received samples can be
treated as a binary hypothesis testing problem, given as [3] H0 : x [n] = w [n] + i [n] = wˆ [n] H1 : x [n] = h · s [n] + w [n] + i [n]
if signal is absent if signal is present
(1) (2)
where h and s [n] are the channel impulse response and target signal respectively, w [n] is additive white gaussian noise and i [n] represents other sources of interference; thus the equivalent noise observed at the antenna input is expressed by wˆ [n]. The energy detector is implemented using the GNU Radio signal processing toolbox and Python programming language together with a USRP N210 SDR. The GNU radio based flow graph of the energy detector is shown in Fig.4. The USRP source block supplies a stream of complex IQ samples at a requested sample rate from the radio through a Gigabit Ethernet (GbE) connection. The samples are then grouped into vectors of size N = 1024, where N is the number of points in the FFT. The vectors of complex samples go into a 1024-point FFT block, where a Blackman-Harris window is applied to each vector before computing the FFT. Next, the power is obtained by taking magnitude squared of each sample. The output frames go into a custom GNU Radio block called ed_statistics. First, it calculates a time average over multiple FFT frames at each FFT point, after which the block forms the test statistics and converts all results into decibels (dB). The detection test statistics are obtained based on the NeymanPearson criterion by computing the total power in a set of N samples [3] 1 N Y = ∑ |X [n]|2 (3) N n=1 where X [n] corresponds to the received samples in the frequency domain. The test statistics are written into a FIFO from where the SRM reads in these test statistics and compares it to a dynamically calculated detection threshold. The threshold is calculated as follows [2] Γ = µ + Q−1 (Pf a ) σ
(4)
where µ and σ are the mean and standard deviation of the time averaged FFT points respectively, Q−1 () represents the inverse Q-function and Pf a is the probability that the detection module chooses H1 while the correct decision is H0 . The decision rule can be modeled as [3] � Y 6 Γ → H0 D (n) = (5) Y > Γ → H1 If a signal is detected, the SRM estimates the center frequency and bandwidth and looks for a match in the data library or in case no match was found, updates the library with new signal parameters.
Fig. 5: Modulation classification block
based on the headers created by SRM. The MCB will be able to process n parallel SOIs from the SRM, where n will depend on the resources available in terms of sensors and computational capability. Each of these n parallel SOIs can be classified using different classification techniques. After the classification decision is made, MCB adds the result to the reserve field of the frame header previously created by the SRM. This frame with the classification decision in the header is then sent to the data library and statistical block where the results are stored for feedback to SRM and other components of the communication system (e.g. demodulator).
We present a specific scenario to better describe the advantages of having a framework capable of utilizing multiple techniques. The SRM will estimate the SNR of the detected signal during the preprocessing stage. While the estimated SNR is above a predetermined threshold, the SRM may choose a less computationally intensive approach using FB classification [6], [7], [9] which requires only a single sensor. But when the SNR falls below the threshold, the SRM will switch to multi-sensor LB techniques developed to improve classification in low SNR scenarios [18]–[20]. Hence, we utilize the hardware and computational resources efficiently to maintain the required performance of the classifier based on the existing scenario. In the above case, a hybrid approach was used with the assistance of the flexible framework. In other words, we use the advantages of both FB classifier and LB classifier to improve the performance of the system.
B. Modulation classifier block The received signal, preprocessed and encapsulated by the SRM, is fed to the MCB. According to the headers obtained from the SRM, this block may perform simple classification of modulation format or may choose to run multi-level classification techniques which may be FB decision tree scheme, computationally complex LB classification or both. All the required algorithms will be imported from the data library
Since the objective of this paper is to demonstrate the feasibility of using a hybrid classification approach, we first implement a simple FB classifier to perform the initial classification between FSK modulation and PSK. Then we use an LB approach to classify between 8PSK and QPSK. The feature used in our implementation is the maximum value of power spectral density of the normalized-centered instantaneous am-
plitude given by [7], [9] γmax =
max |FFT (acn (n))|2 Ns
(6)
where acn (n) =
a(n) −1 ma
(7)
where a(n) is the absolute value of the analytic form of the received signal. The number of samples is given by Ns and ma is the average of the instantaneous amplitudes given by (8)
The normalization of the instantaneous amplitude is required to compensate for the channel gain. Once γmax is calculated, it is compared to a predetermined threshold (T f b ) to distinguish PSK signals from an FSK signal. The signals that have γmax < T f b are classified as FSK signals and γmax > T f b are classified as PSK signals, after which the data is sent to the next stage of classification to determine whether it is a 8PSK or QPSK signal. Next, we implement an LB approach [19] which performs hybrid likelihood ratio test to perform classification. The author uses Expectation maximization (EM) algorithm to reduce the computational complexity. Since this approach is optimal in Bayesian sense, it should provide high probability of correct classification (Pcc ) between the PSK signals. Both these classification techniques are implemented in Python to work along with GNU radio used to control the USRPs. C. Data library and statistical block The data library encompasses various formulas corresponding to different classification techniques, estimated unknown signal parameters and other values such as detection thresholds with associated frame numbers, decisions made etc. The data library feeds updated data to the SRM to help it make a decision on the detection and classification techniques to be used for each frame that is processed. Depending on the application the framework is used for, specific variables or registers are defined and they are updated as the system performs detection and classification. The statistical block is used for evaluation of new algorithms that are implemented using FACT. This statistical block will compute metrics like Pcc , Pd , false alarm rate, and provide graphical representation of the performance. IV.
E XPERIMENTAL EVALUATION
In this section, we describe the implementation of FACT using open-source signal processing software called GNU radio. GNU radio is a commonly used framework to program various software defined algorithms that incorporate the USRP. GNU radio comprises of various signal processing and digital communication blocks which are used to implement transmit and receive chains for various digital modulation schemes. As shown in Fig. 6, the experimental setup consists of two Linux based host PCs, three USRP N210s used as primary receiver (RX) and secondary receivers (RX1 and RX2 ) and two USRP X310s used as transmitters (T X1 and T X2 ). The
1
0.9
0.8
d
1 Ns ∑ a(n) Ns n=1
Probability of detection (P )
ma =
Fig. 6: Experimental setup
0.7
0.6
0.5
0.4
0.3
0.2
P = 0.4 fa
0.1
P = 0.1 fa
0 -10
-8
-6
-4
-2
0
2
4
6
8
SNR (dB)
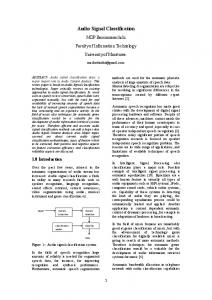
Fig. 7: FACT’s probability of signal detection (Pd ) vs SNR
SBX and CBX daughterboards are used with the radios, which cover frequency ranges from 400 MHz to 4.4 GHz and 1.2 GHz to 6 GHz. The receivers (USRP N210s), provide up to 40 MHz of instantaneous analog bandwidth. The analogto-digital and digital-to-analog converters on the motherboard use a 100 MHz master clock and sample at 100 MS/s and 400 MS/s respectively. The on-board Xilinx Spartan 3A-DSP 3400 FPGA performs the required digital interpolation or decimation to provide the required sampling rate. The host PC interfaces with the USRP using a Gigabit Ethernet (GigE) connection. These initial experiments were conducted to demonstrate the feasibility of FACT to perform detection and classification using real SDR hardware. The first set of experiments is conducted to evaluate the signal detection module implemented in the SRM. As discussed in section III-A, we implement the dynamic threshold based energy detection using (4). A single USRP X310 is set up as a transmitter and it is placed at a distance of 10ft from the primary receiver, USRP N210. Pd is computed by observing 50 consecutive attempts of detection by the energy detector module. This is repeated by using two values of Pf a in the threshold calculation; Pf a = 0.4 and Pf a = 0.1. Figure 7 depicts the plot of Pd vs SNR with the above mentioned set up. It can be seen from Fig. 7 that choosing a higher Pf a = 0.4 value to calculate the threshold enabled the detector to detect low SNR signals compared to using Pf a = 0.1. As expected, we noticed multiple false detections in case of Pf a = 0.4, especially at the lower SNR region. Although there were no false detections while using Pf a = 0.1 even at lower SNR, it performed adversely when
and estimates the center frequency of each distinguishable SOI. Then, the SRM delegates the secondary receivers (RX1 and RX2 ) to tune to each corresponding SOI and creates frames for the MCB to make a classification decision. According to the information in the header of each frame, MCB imports the required algorithm from the data library and makes the classification decision.
Fig. 8: Spectrum of three simultaneous transmissions
used to detect multiple signals simultaneously. Since the aim of the next set of experiments illustrates FACT operating as a single unit that monitors the desired spectrum to detect two SOIs and perform modulation classification using both FB and ML techniques, we chose to use Pf a = 0.4 for our threshold calculation. Test 1 Tx Gain QPSK
8PSK
20
0.96
1.00
15
0.96
1.00
5
0.88
1.00
1
0.88
0.96
TABLE I: Probability of correct classification (Pcc ): QPSK & 8PSK
Test 2
Test 3
Tx Gain
Tx Gain GFSK
8PSK
GFSK
QPSK
20
1.00
1.00
20
0.96
0.6
15
0.96
1.00
15
0.92
0.8
5
0.92
1.00
5
1.00
0.76
1
0.92
0.92
1
0.96
0.84
TABLE II: Probability of correct classification (Pcc ): GFSK & 8PSK
TABLE III: Probability of correct classification (Pcc ): GFSK & QPSK
For the next set of experiments we use the setup shown in Fig. 6. The transmitter is set to transmit at different frequencies using GFSK, 8PSK and QPSK modulation schemes. Figure 8 shows an example of the spectrum where all the three transmitters are active simultaneously. Due to the limitation of resources we only use two active transmitters in the following experiments. Thus, at any particular instant two transmitters are active at two distinct random frequencies transmitting two of the above three modulation schemes. The SRM uses the primary receiver (RX) to detect the presence of an active signal
In these three test scenarios, we have implemented a simple feature based approach to classifiy a FSK signal from a PSK signal. Then, if a PSK signal is observed, an LB approach is used to classify between 8PSK and QPSK. The receiver gains are set to a constant 1dB and the transmitter gain is varied from 1dB to 20dB. Since, the transmitters and receivers are placed close to each other even at 1dB of transmit gain we recorded high SNR values. We chose this setup because at this point the focus of this work was not to stress test the classification algorithms but to show the feasibility of implementing a FACT using real hardware. Tables I, II and III show the Pcc of each transmitted modulation with varying transmit gain. Pcc is calculated from 25 decisions made by the MCB using the frames acquired from the SRM which performs blind signal detection within the target spectrum. It can be seen from the Pcc values of tables II and I that the classifier’s performance decreases as the transmit gain reduces. The Pcc values of table III shows deviation from the expected result. Though Pcc values of GFSK are consistently high with small deviations, the Pcc value of QPSK seems to be low at high transmit gain but increases when transmit gain is low. Upon further analysis, it was discovered that QPSK was being classified as GFSK at high transmit power. This could be because GMSK transmitter was causing interference on the frequencies chosen by QPSK transmitter. Thus, when the transmit gain was reduced, interference decreased and the Pcc for QPSK increased. This will be further investigated in future works and we will also add multi-sensor classification techniques for low SNR scenarios. Overall, these experiments successfully demonstrate FACT performing as a cohesive unit; energy detector detected and estimated frequencies of SOI, SRM delegated secondary receivers to these frequencies and finally MCB used the frames obtained from SRM to make classification decisions. V.
C ONCLUSION
AND FUTURE WORK
In this paper, we have described the design and implementation of a flexible framework (FACT) for performing blind detection and classification of multiple simultaneous SOIs in the given spectrum. The feasibility of FACT is demonstrated through implementation of the framework using USRPs. The performance of the energy detector was evaluated using different thresholds. We successfully implemented a simple FB classifier and an LB classifier to show a hybrid AMC approach used to maintain good Pcc and demonstrated the blind detection and classification of multiple unknown signals using USRPs. Additionally, the implementation showed how FACT could be used by researchers as a common platform for comparing the performance of multiple detection and AMC techniques using real hardware and verify if it corroborates with the simulation results. In future, we would like to add more classification algorithms into our data library to classify a larger number of
modulations in various constrained environments. The performance of the energy detector is limited due to it’s noise sensitivity. Thus, we are implementing techniques like cyclostationary to improve the signal detection module. The current usage of the secondary receiver is simple and not optimized. We plan to use time sharing or similar techniques to enable a single secondary receiver to collect samples from multiple SOIs. Additionally, as a next step we want to formulate multi-objective optimization problems to optimize the use of available resources to maximize the performance of FACT interms of number of SOIs detected and classified accurately. R EFERENCES [1]
[2]
[3]
[4]
[5]
[6]
[7]
[8]
E. Axell, G. Leus, E. Larsson, and H. Poor, “Spectrum sensing for cognitive radio : State-of-the-art and recent advances,” Signal Processing Magazine, IEEE, vol. 29, no. 3, pp. 101–116, May 2012. T. J. O’Shea, T. C. Clancy, and H. J. Ebeid, “Practical signal detection and classification in GNU Radio,” in SDR Forum Technical Conference, 2007. A. Nafkha, M. Naoues, K. Cichon, and A. Kliks, “Experimental spectrum sensing measurements using usrp software radio platform and gnu-radio,” in Cognitive Radio Oriented Wireless Networks and Communications (CROWNCOM), 2014 9th International Conference on, June 2014, pp. 429–434. D. Joshi, D. Popescu, and O. Dobre, “Adaptive spectrum sensing with noise variance estimation for dynamic cognitive radio systems,” in Information Sciences and Systems (CISS), 2010 44th Annual Conference on, March 2010, pp. 1–5. O. A. Dobre, A. Abdi, Y. Bar-Ness, and W. Su, “Survey of automatic modulation classification techniques: classical approaches and new trends.” IET Communications, vol. 1, no. 2, pp. 137–156, 2007. E. E. Azzouz and A. K. Nandi, Automatic Modulation Recognition of Communication Signals. Norwell, MA, USA: Kluwer Academic Publishers, 1996. E. Azzouz and A. Nandi, “Procedure for automatic recognition of analogue and digital modulations,” Communications, IEE Proceedings-, vol. 143, no. 5, pp. 259–266, Oct 1996. A. Nandi and E. Azzouz, “Algorithms for automatic modulation recognition of communication signals,” Communications, IEEE Transactions on, vol. 46, no. 4, pp. 431–436, Apr 1998.
[9] A. Hazza, M. Shoaib, S. AlShebeili, and A. Fahd, “Automatic modulation classification of digital modulations in presence of hf noise.” EURASIP J. Adv. Sig. Proc., vol. 2012, p. 238, 2012. [10] A. Kubankova, J. Prinosil, and D. Kubanek, “Recognition of digital modulations based on mathematical classifier,” in Proceedings of the European Conference of Systems. Stevens Point, Wisconsin, USA: World Scientific and Engineering Academy and Society (WSEAS), 2010, pp. 245–249. [11] O. Dobre, Y. Bar-Ness, and W. Su, “Higher-order cyclic cumulants for high order modulation classification,” in Military Communications Conference, 2003. MILCOM ’03. 2003 IEEE, vol. 1, Oct 2003, pp. 112–117 Vol.1. [12] O. Dobre, A. Abdi, Y. Bar-Ness, and W. Su, “Selection combining for modulation recognition in fading channels,” in Military Communications Conference, 2005. MILCOM 2005. IEEE, Oct 2005, pp. 2499– 2505 Vol. 4. [13] O. Dobre, Y. Bar-Ness, and W. Su, “Robust qam modulation classification algorithm using cyclic cumulants,” in Wireless Communications and Networking Conference, 2004. WCNC. 2004 IEEE, vol. 2, March 2004, pp. 745–748 Vol.2. [14] K. Ho, W. Prokopiw, and Y. Chan, “Modulation identification of digital signals by the wavelet transform,” Radar, Sonar and Navigation, IEE Proceedings -, vol. 147, no. 4, pp. 169–176, Aug 2000. [15] W. Wei and J. M. Mendel, “Maximum-likelihood classification for digital amplitude-phase modulations,” Communications, IEEE Transactions on, vol. 48, no. 2, pp. 189–193, 2000. [16]
[17]
[18]
[19]
[20]
F. Hameed, O. Dobre, and D. Popescu, “On the likelihood-based approach to modulation classification,” Wireless Communications, IEEE Transactions on, vol. 8, no. 12, pp. 5884–5892, December 2009. J. Sills, “Maximum-likelihood modulation classification for psk/qam,” in Military Communications Conference Proceedings, 1999. MILCOM 1999. IEEE, vol. 1, 1999, pp. 217–220 vol.1. S. Foulke, J. Jagannath, A. Drozd, T. Wimalajeewa, P. Varshney, and W. Su, “Multisensor modulation classification (mmc): Implementation considerations – usrp case study,” in Military Communications Conference (MILCOM), 2014 IEEE, Oct 2014, pp. 1663–1668. O. Ozdemir, R. Li, and P. Varshney, “Hybrid maximum likelihood modulation classification using multiple radios,” Communications Letters, IEEE, vol. 17, no. 10, pp. 1889–1892, October 2013. Y. Zhang, N. Ansari, and W. Su, “Optimal decision fusion based automatic modulation classification by using wireless sensor networks in multipath fading channel,” in Global Telecommunications Conference (GLOBECOM 2011), 2011 IEEE, Dec 2011, pp. 1–5.