1 Professor, Department of Electrical and Electronics Engineering, Vel Tech Multitech,. Avadi .... The CHs forward the collected data through the same path.
International Journal of Applied Engineering Research ISSN 0973-4562 Volume 10, Number 9 (2015) pp. 23645-23663 © Research India Publications http://www.ripublication.com
Framework of Wireless Sensor Network for Power Quality Monitoring Rajkamal R1, Mohanram S2 , VimalrajAmbeth3, G.Panneerselvam4 1 Professor, Department of Electrical and Electronics Engineering, Vel Tech Multitech, Avadi, Chennai-62, Tamil Nadu, India. 2,3,4 Assistant Professor, Department of Electrical and Electronics Engineering, Vel Tech Multitech, Avadi, Chennai-62, Tamil Nadu, India.
Abstract Numerous applications can benefit from the application of WSNs. However, each application has its own specifications and requirements. The specification applying to certain applications may not necessarily apply to another. Extensive study carried in WSN various upon the different application scenario. Clearly PQ monitoring is a crucial application which needs support from sensor technology, communication technology and information processing technology. In this paper, a complete framework for energy efficient heterogeneous WSN is developed which can monitor the PQ disturbances regularly. Keywords: Wireless Sensor Network, Power Quality Monitoring, Sensor Node, Cluster Head, Energy Efficiency, Latency
Introduction In Sensor network sensor nodes forms the basic block and their characteristics helps in the design of network structures. Here we have presented a view of the structure and architecture of a sensor node. Knowing the structure of the node would help the application designer to choose the required sensor nodes for the specific application. The basic sensor node model also helps the designer to reuse, combine, or modify the architecture of a node to suit more complex needs. The authors have also discussed the various components of a sensor node, including its static and dynamic aspects, the advantages and constraints of a sensor node and its implementation details required to use sensor nodes for an application. The structure of the network describes the entire network composed of different classes of nodes such as sensor nodes, cluster heads and sinks. A pattern for sensor network that can be built using the sensor node characteristics as a unit is presented by [23]. Authors have presented an abstract view of the general architecture of a WSN that describes the generic structure for most of the sensor networks application. The design of a network is made simple and more convenient by using the network pattern. It can facilitate their integration with rest of the system. This helps to develop the framework of energy efficient generic structure of WSN suited for PQ monitoring. In the
23646
Rajkamal R
exploration through literature on WSNs‟ application, it is observed that PQ monitoring has not been fully explored by the experts in the field. It may be stated that this is a first attempt to describe the framework of energy efficient WSN targeting PQ monitoring. Ngai et al (2010) proposed a general reliability-centric framework for event reporting in WSNs which is also applicable for forest fire detection systems. They consider the accuracy, importance and freshness of the reported data in environmental event detection systems. They present a data aggregation algorithm that focuses on important data and a delay-aware data transmission protocol which has the aim of forwarding accurate data rapidly to the sink. WSN not only support military and Surveillance but also several civil work depending upon their requirement .Periodic sensing and monitoring of habitat are necessary in most of the application ,but network lifetime and reporting rate also plays vital role in each scenario . Specific communication paradigms are specified in the above mentioned literature survey .Data encryption ,data correctness and direct communication between source and destination is required.[1] [2] [3], environmental monitoring [4] [5], health monitoring [6] ,[7] ,structural health monitoring [8], [9], [10], [11], event detection and tracking [12], [13], [14], transport monitoring [15] and location-aware system [16]. Specific capabilities and underlying communication paradigms have been outlined in the literature. Wireless sensor nodes and networks have unique features which provide many advantages and challenges in their application to PQ monitoring. Limited power resources should be taken into account while constructing a solution for PQ monitoring. Considering the PQ monitoring in substations or in industries or in distribution system of a smart grid are complicating the installation of the network. The following are the design goals that are important to satisfy in order to operate a successful network: • Consuming energy in an efficient manner. • Reduction of end to end delay (latency). Since sensor nodes have limited power resources, a WSN to be deployed for the aim of PQ disturbances monitoring should have a highly efficient energy consumption strategy. The sensor nodes work with batteries, and therefore changing the batteries of the nodes after deployment or replacing a dead sensor node with a new one will be a very costly action. As a result, the sensor nodes should have an efficient energy consuming strategy. Improving the effectiveness of WSNs as tools for data collection and dissemination has attracted the attention of researchers who seek to bring energy efficiency to monitoring applications. The purpose of this chapter is to realize the energy efficient framework of WSN for PQ disturbances monitoring by assigning the heterogeneous functionalities for the sensor node and cluster head. In multi-hop WSNs for example, bringing efficiency gains in PQ monitoring necessarily involves in reducing end-to end delay. This is the time elapsed between the occurrence of an event at a source and its detection by a base station several hops away.
Members of WSN for PQ Monitoring This study aims to propose a comprehensive framework that considers the two basic goals of WSN for PQ monitoring
Framework of Wireless Sensor Network for Power Quality Monitoring
23647
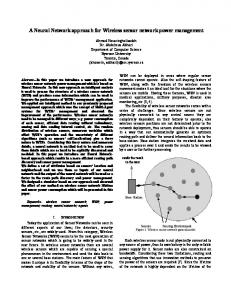
1. Low energy consumption. 2. Low latency. The operation is broken down into rounds where each starts with a setup phase and processed by a steady state data transfer phase. The next section is related to the network architecture. Following that, the communication scheme that is applied in the sensor nodes and the cluster-heads, and the communication scheme applied among the cluster-heads are described in detail. WSN Structure Heterogeneous WSNs contain nodes assigned with different capabilities. In sensor network nodes can logically organize to form a cluster .each cluster has its own cluster head with specific role. Typical nodes are resource constrained nodes whereas the cluster head are more resource full than the normal nodes. The network model is shown in Fig 1. Sensing Field
Sink - Cluster Head
- Sensor Node
Figure 1: WSN Model The network Comprise of Sensor Nodes, Cluster Heads (CH) and Base Station (sink) with different functionalities which are shown in the form of class diagram in Fig 2.
23648
Rajkamal R
Network + id + network name
+ add sink ( ) + add sensor node ( ) + add cluster head ( ) + add cluster ( )
Sensor Node
+ id + frequency + cluster id
+ timer ( ) + read sensor ( ) + event detection ( ) + process data ( ) + send FE data ( ) + receive query ( ) + send data ( )
Sink +id +frequency
+ receive event code () + change channel ( ) +receive data ( ) + send query ( )
Cluster Head
+ id + frequency
+ add sensor node ( ) + receive FE data( ) + send event code ( ) + change channel ( ) + routing ( ) + add sensor node ( ) + send data ( ) +receive/forward query ()
Figure 2: Class Diagram of WSN For PQ Monitoring Every cluster consists of one CH and many sensor nodes. Sensor nodes are one hop away from their CH. A delivery route construction mechanism among cluster-heads is done by the Minimum Transmission Energy (MTE routing) (Chuan chi weng et al 2007) to reach the base station. The sensor network for PQ monitoring has been configured with the following properties. • Nodes once deployed no movement is found. • Each Sensor Node has a unique pre-configure id. • Only one sink is available for sensing from outside the sensing area. • Continuous energy supply is provided to the sink. • Transmitting/receiving propagation channel is symmetric. The transmission range of each sensor node is fixed. Functionality of The Base Station Base Station / Sink (BS) is the destination for logging of all events detected by the nodes in the network. The BS has a continuous energy supply. The main purpose assigned to the sink is to generate query while monitoring repetitive event of PQ signals
Framework of Wireless Sensor Network for Power Quality Monitoring
23649
received. A query is used by the BS to get sensed data from the node .Queries are of three types namely: • Manual. • Self Generated. • Continuous A continuous query is used to get data from all or group of sensor in a consecutive round manner. A manual query asks one or more sensors to update the data.. In a selfgenerated query, Sensed data are updated automatically by sensor node itself. In this work, the BS is configured to generate manual query and asks a particular sensor node to send their sensed data. This process is automated by the algorithm which is framed to generate query, only when the frequency of occurrence of PQ events occur more than thrice from a particular sensor node. This helps the PQ analysis to be more efficient since the importance is given to frequent occurrence of events which demand event mitigation whenever events occur repeatedly. If a particular disturbance is detected in a particular node for more than three times, the particular PQ disturbance should be analyzed to mitigate the occurrence of the event. Hence it is required to have the disturbance data for analyses and help the power system engineers to take the proper mitigating action on the occurrence of the disturbance. The algorithm to generate query from the Base Station as follows 1: initialize counter [i]=0 ; i= 1,2,. . 9 2: if event[i] occurs 3: counter [i] + + 4: if counter [i] >=3 5: generate query
Dynamics of The Network The proposed network for PQ monitoring includes the major communication sequences such as Query Request, Data Gathering, and Forwarding Event. Query Request The base station is involved / required in get back some critical event data from sensor node that had frequently reported the event information. Since WSN is distributed and Cluster Heads is all distributed and not in direct communication with the base station; the Cluster Heads forwards the query request, hop by hop through other Cluster Heads‟s. The CHs forward the collected data through the same path. CH executes the MTE routing protocol in order to route information /data / query from one CH to another. Fig 3 shows the sequence diagram of the query request process.
23650
Rajkamal R
Sink
Cluster Head 2
Cluster Head 1
Send Query
Sensor Node
Sensor Node 2
Send Query Sense
Send Data
Send Data
Send Query
Forward Query
Forward Data
Forward Data
Forward Query
Sense
Send Data
Figure 3: Sequence diagram of the query request. • •
• •
The base station sends the query request to the data communicated CH node in the network. The cluster head receives the request from base station through multi-hop (based on routing protocol – Minimum Transmission Energy (MTE)) and forwards in single-hop to the respective sensor node which encountered the PQ event. Once request is received all Cluster Head behaves in same manner. All sensed data are are sent to the query requested node. This process continues till the sensed data reaches the base station.
Events Collection All sensor nodes in a given cluster are within the range of its cluster head (single- hop). Fig. 4 shows the sequence diagram of events collection process. Sensor Node 1
Cluster Head 2
Cluster Head 1
Sink
Sense
Process Data Classification Send to its CH
Received Query
Forward query to SN & get data
Forward Data / MTE
Event code/ Change of channel
Forward Data
Figure 4: Sequence diagram of events collection
Framework of Wireless Sensor Network for Power Quality Monitoring • • •
23651
Sensor nodes collects the data, then process (FEME, Time Stamp) the data and finally sends the data to its cluster head. the data are classified by the cluster head and its event codes are forwarded (based on event classification) to the next cluster head through routing or base station. The base station is configured to generate query to get the whole sensed data for further analysis on the critical event which may further be used help in mitigating the occurrence of the particular event.
Figure 5: Data Packet Format Forwarding Data / Information The algorithm in the sink is assigned to retrieve data from a particular sensor node which detects a particular event frequently. The cluster heads forward event code to the next cluster head (for multihop routed transmission) which in turn forwards event code to the sink. Fig 6 shows the sequence diagram for the forward data / information to the base station. • Sensor nodes in a cluster forwards data to its cluster head only. • Cluster head forwards the data to the base station based on MTE routing protocol through other CHs.
23652
Rajkamal R
Sink
Cluster
Cluster
Sensor
head
head
node 1
Sensor node 2
forward dat forward
forward
info
info
timer expired
classify
receive quer forward
forward
forward
data
dat
dat
Figure 6: Sequence Diagram of Forwarding Data / Information To The Base Station
Network Operation For Pq Monitoring It detect and estimates the signal energy for the desirable level known as energy detection (ED) . when ED is done ,if favorable signal are occupied ED can be performed and detection cannot be made .The receiver sensitivity depends on the low signal it can get hold off and demodulate with 1% packet error rate. IEEE 802.15.4 allows only 10db difference between receiver sensitivity and energy detection level. so a ED performance can detect energy signal as low as 10 db .ED is performed by physical layer by MAC Instruction . The result is given in 8 bit integer indicating energy level of the frequency channel. The energy level accuracy may be 6 dB or better. In CSMA/CD first the MAC require to perform a clear channel assessment (CCA) to make sure that channel are available .Three CCA modes are available and the IEEE 802.15.4 must be compatible with the modes .In CCA mode 1 ED level greater than threshold indicates busy state. CCA mode 2 CS s considered if value of CS and physical layer is equal then busy state CCA mode 3 is a combination of mode 1 and mode 2. Fig. 7 shows the data transfer sequence of sensor node to cluster head. Here the non beacon mode of communication is enabled. In this scenario, data transmission starts only when the channel is clear.The transmission of an acknowledgment by the CH is optional.
Framework of Wireless Sensor Network for Power Quality Monitoring
Sensor Node
23653
Cluster Head
Data
Acknowledgement (if requested)
Figure 7: Data transfer in non-beacon mode Cluster Head Selection Each cluster of WSN usually has a cluster head that is responsible for controlling, packet forwarding, configuration of nodes, cumulating the sensor readings and sending it to the sink .This excess responsibility results to higher rate of energy drain. Cluster Head play a vital role in the enhancement of the network performance and the same has different schemes which are discussed in the literature. LEACH a popular mechanism rotates the cluster head role among all nodes. But selection of being Cluster Head is chosen wisely which leads to non-optimal solution.In LEACH-C (Centralized) (Heinzelman et al 2002 Base Station are helpful in deciding the requirement no of Cluster Head‟s in a given distributed networks. In Heinzelman (2000), LEACH-F (Fixed clusters) Luster Head are selected Randomly ,in the fixed cluster. HEED (Younis and Fahmy 2004) selects CHs based on to save communication cost by calculating residual energy and node proximity to the neighbors. DECP (Wang and Zhang 2007) uses a threshold which uses residual energy as a scale to select CH candidate and its distance to the neighbors. In most of the distance-related protocols, GPS (Global Position System) function is required. However, this energy-hungry and expensive-cost device is not ubiquitously available. LEACH‟s stochastic algorithm is extended in Handy et al (2002) It determine the left out energy of each node to calculate the threshold. However to get real time value of a sensor we need routing protocol were HEED is used. HEED (Hybrid EnergyEfficient Distributed Clustering)selects node from the deployed level. HEED calculates hybrid of energy and communication cost in the selection of CH. In CEFL (Clusterhead Election Using Fuzzy Logic) algorithm (Guptha and Younis 2003used Fuzzy logic for selection of CH & data Transmission is done through synchronous clocking. (Lundelius and Lynch 1984). WSNs are usually classified into different types depending on the topology, order of data traversal, routing methods etc. They can also be classified as clustered or unclustered. In the case of un-clustered, sensed data are relayed to a single hop or multihop fashion to the base station. In the sensor networks which is based on cluster , sensor
23654
Rajkamal R
nodes can transmit their data to the elected cluster head. Data to the cluster heads are transmitted in a single and multi-hop fashion. CH is a special kind of node with higher energy, processing or memory. Base station or sensor nodes play a vital role in selection of Cluster Head ,in the cluster itself based on various selection parameters such as distance, energy, centrality, etc. Sensor nodes in cluster based network can be of fixed or dynamic in nature. Fixed cluster based network is composed of sensor nodes that are associated with a single cluster permanently from the moment they are deployed till they run out of energy. Dynamic cluster based network, the sensor nodes change their cluster depending on the parameter on which it is pre-programmed. The parameters are like distance, energy, proximity to the data sink, size of the cluster etc. In this work, fixed cluster based heterogeneous sensor network, where the special kind of node with higher energy is considered as CH. The CH node is configured with the following CH selection algorithm and also provided with twice the amount of energy (at the time of deployment) of the sensor node (initial energy) in the network to solve the communication over head problems for a great extent. A round can be the Time period from the moment when the cluster head is selected and the next reselection of cluster head. Each round consists of a setup phase and steady phase. In general, each setup phase, the nodes exchange network setup and maintenance messages to elect the cluster for next round of communication. The idea behind this algorithm is to make the one node fixed as cluster head always till the end of life time of the network.
___________________________________________________________________ Cluster head selection algorithm _____________________________________________________________________ Set up phase 1: round = 1 2: Energy level is broadcast by all nodes. 3: Energy level is sorted by ascending order. 4: The node with highest energy becomes Cluster Head which is available in the bottom of the list. 5: The CH broadcast the elected information to all other nodes and all the nodes join as the member of the cluster. Communication phase (Steady state phase) 6: Continue the subsequent rounds of data communication by fixing the same node as CH. _____________________________________________________________________ CH is equipped with twice the amount of initial energy compared with the other sensor nodes during deployment of the nodes. After deployment, in the first round of communication, particularly in the setup phase, exchange of nodes‟ energy level and
Framework of Wireless Sensor Network for Power Quality Monitoring
23655
messages to join in the cluster are taken place. According to the algorithm, CH is selected, the node having twice the initial energy of the sensor node. Then, other phases of communication are taken place for data / information communication. The algorithm in the CH is keep checking the residual energy of the CH after each transmission / reception of packets. If the residual energy of the CH is greater than the initial energy, of the sensor node, there will not be any process allowed for re-selection of CH. It is considered that all the sensor nodes in the cluster, sense the events at least once. Till the CHs‟ residual energy greater than or equals to the initial energy of the sensor node; for all the subsequent rounds of communication there is no cluster head election process. This can avoid the energy wastage due to communication overhead in the setup phase for greater extent. Hence, there is no possibility for any sensor nodes which have the initial energy after many rounds of communication. The proposed wireless sensor network to monitor PQ disturbances is adopted with the static clustering and heterogeneous nodes with respect to its functionality and energy. The proposed cluster head selection algorithm selects the CH in the first round. After selecting the CH in the subsequent round the CH checks for the residual energy. If the residual energy is greater than the initial energy of the sensor node there will not be any communication will take for selection of CH. Also it is considered that after many rounds of communication, there is no possibility for any sensor nodes which have their initial energy since it is considered that all the nodes have sensed events and processed atleast once. Moreover, the PQ disturbances monitoring application demands the classification of disturbances present in the PQ signal. In this context, the proposed CH is equipped with classification capability and event code (information) communication. The most of the other cluster head selection algorithms are rotating the CH responsibility to other nodes available in the cluster. But this will not be allowed since the sensor nodes and CH are equipped with different functionalities.
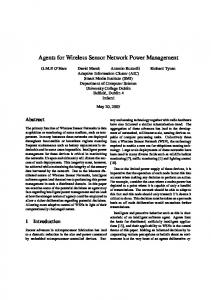
Energy Consumption (mJ)
Energy Consumption of Sensor Node and Cluster Head for Transmitting an event to Base Station 7 6 5 4 3 2 1 0 d=410
d=600
d=740
d=1000
No. of Samples Sensor Node
Cluster Head
Figure 8: Comparison of Energy Consumption of The SN And CH In PQ monitoring application, the computation cost due to NN algorithm running in the cluster head is always high compared with the computation cost of the sensor node since the CH is performing classification of PQ disturbances using NN classifier. But the communication cost of the CH is very low compared with the communication cost of the sensor node; since CH is transmitting only event code rather than whole-sensed data. Hence the total energy consumption of the sensor node is almost equal to the
23656
Rajkamal R
energy consumption CH node for an event to be communicated to the base station. This scenario is simulated in MATLAB, the communication and computational energy consumption of the sensor node and CH is observed for communicating one event to the base station is shown in Fig 8. Therefore, there is no possibility for a new node to become a CH in a cluster. This avoids the communication over head in the setup phase. Once the CH is selected in the first rounds‟ set up phase, it is fixed for all subsequent rounds of communication. Further in set up phase there will not be any CH selection process. In the steady phase, CH receives data from the sensor node and process for PQ event classification using NN and perform event communication to the base station. Event Communication To communicate an event to the base station, CHs of different clusters in the network are relayed on routing process which selects the path through which the information will be relayed to the base station. To relay the information to base station through multiple CHs the MTE routing is adopted. The operation of MTE consists of advertisement phase, CH selection phase and steady-state phase. In MTE routing protocol, all nodes can be a cluster-head, in order to select cluster-heads, MTE use a stochastic process that the percentage of cluster-heads is pt. Each node n generates a random number r(n) between 0 and 1. If r(n) < pt , the node n initiates advertisement phase. Advertisement is represented by ADn (E, Adn, h), where E is the node which has the highest energy level, „Ad‟ is an address of forwarding node to reach the cluster-head and is identical with its own address, and h is the number of hop counted from the node whose energy level is E, respectively. (Backhyum and Iksoo 2006) In MTE, CH is elected among the nodes that have the highest energy levels to keep the lifetime of wireless networks longer. Once the CH is elected, MTE executes the steady phase for data transmission. After completion of the successful transmission of data to the sink, MTE enters further in to advertisement phase of the next round to select the CH. In this work, CH is configured with the CH selection algorithm which follows the same principle of MTE in the first round. Once the CH is elected further there will not be any process related to advertisement and CH election phase is carried in the next round of communication. The CH configured in this work to monitor the PQ events is fixed for all the rounds of communication. No reelection of the CH is allowed. Hence for each round the advertisement and CH election is not executed. This leads to reduce the communication overhead to great extent there by the savings in energy is achieved. If a cluster-head wants to send data, it tries to connect to either another CH or the sink. When cluster-head CH reaches to the sink by one hop, its address is (Adsink+CHj). When CH is located at 1-hop away from CH and has been connected to the sink, the address of ((Adsink+CHj)+CHk). Furthermore, this method requires less amount of network bandwidth than cluster model with one hop propagation because it prevent data from flooding overall network and can be possible to send along the specified route. In this work, the simplest path-loss model, called free-space, assumes that there are no obstructions between transmitter and receiver is considered. The receiving power consumption of the transceiver (XBEE) is almost equal to the transmission at full
Framework of Wireless Sensor Network for Power Quality Monitoring
23657
power. Radio channel between transmitter and receiver can be established only when strength of the received radio signal is grater then receiver‟s sensitivity threshold. The reduction in signal power density, on the path between transmitter and receiver, is called path loss. Path Loss = (1/DIST) αl
(1)
where, αl – Path loss exponent (αl = 2 for free space (typical value)) and DIST is the distance between transmitter and receiver. From Fig. 9, it is observed that single-hop transmission is the most energy efficient for XBEE transceiver, irrespective of path loss exponent. This is because the reception power of XBEE transceiver is nearly equal to the maximum transmitting power. Since radio transmitter is more efficient at higher transmitting powers than lower transmitting powers, single-hop has less power consumption. Power Consumption (mW)
900 800 700 600 500 400 300 200 100 0 1
1.5
2
2.5
3
3.5
4
4.5
5
Path Loss Exponent value 1-hop
2-hops
3-hops
4-hops
Figure 9: Power consumption of transceiver in single-hop and multi-hop communication It is theoretically known from the literature (Mario Neugebauer et al 2006) (Szym on Fedor and Martin Collier 2007) that multi-hop routing is more efficient than any singlehop routing. This is in an opposite of observations in some real world WSN, which shows that single-hop to base station is much more energy efficient than multi-hop.
Performance Evaluation of The Network The energy consumption by the sensor node and cluster head in the network to transmit an event to sink is shown in Fig 10 and it is also observed that cluster head consumes more power than sensor node even though it is transmitting only event code (1 packet) to sink. The cluster head sends only information by receiving the data from sensor node and a classification process is carried out to identify the nature of the event. Hence to carry out all the said computation processes the CH consumes more energy compared to the sensor node.
23658
Rajkamal R
Energy Consumption (mJ)
Ene rgy Consumption of SN and CH for Transmitting an Event to Base Station 12 10 8 6 4 2 0 d=410
d=600
d=740
d=1000
No.of Samples Sensor Node
Cluster Head
SN + CH
Figure 10: Energy Consumption For An Event To Be Transmitted To The Base Station In The Network The proposed systems‟ energy efficiency is compared with the LEACH and TEEN. The following properties of LEACH are similar to the proposed system. (i) Cluster based (ii) data aggregation at cluster head (received data from sensor node, perform classification of the disturbance present then assign an event code corresponding to the event and transmit in the corresponding channel to the base station (iii) Cluster head communicate directly with sink. In reactive network the nodes react immediately to sudden and drastic changes in the value of a sensed attribute. TEEN is a protocol which is designed specifically for the reactive networks. Since the proposed system is a reactive network (a threshold value is configured in the sensor node which helps to detect the disturbances present in the signal). Hence, TEEN is considered for performance comparison with the proposed system. Several researchers have been improved LEACH and TEEN by considering the applications which are required nodes as homogenous or else a proactive network. Therefore, the other improved versions are not considered for performance analysis. Fig.11(a),(b) shows the energy consumption analysis of the network when a sensor node and a CH operating together for transmitting various number of events to the base station. The performance such as energy efficiency and latency under different situations (ranging from 5 clusters to 15 clusters and 10 nodes / cluster to 50 nodes / cluster) of the proposed network is studied and evaluated with LEACH and TEEN protocols. TEEN is an event driven data generation approach where energy is saved by limiting generation of the packets. To limit the number of packets, the protocol introduces two thresholds of sensed value namely a hard threshold and a soft threshold. Data is sent only to sink if the current value is greater than hard threshold or the difference between the current and previous value is greater or equal to soft threshold. LEACH is suitable for data fusion purpose and is helpful for constant monitoring and data reporting. LEACH involves two phases are: setup phase and steady state phase. The setup phase organizes the network into clusters and the selection of cluster heads. Since the LEACH and TEEN protocols are closely related to the proposed framework the comparison study is made on energy efficiency. The parameters considered in this work are radio range which is put to 30 m, the event rate of sensor node is 2 events /sec with the operating modes of the node is kept unaltered.
Framework of Wireless Sensor Network for Power Quality Monitoring
Energy Consumption (J)
Ene rgy Consumption Ana lysis
23659
of the Ne tw ork
12 10 8 6 4 2 0 0
200
400
600
800
1000
No. of e ve nts proce sse d 410 samples 740 samples
600 samples 1000 samples
(A) Residual Energy (J)
Re sidua l Ene rgy of the Ne tw ork (Initia l Ene rgy - 15 J) - for a n e ve nt to be tra nsmitte d to ba se sta tion 20 15 10 5 0 0
200
400
600
800
1000
No. of e ve nts proce sse d 410 samples 740 samples
600 samples 1000 samples
(B) Figure 11: Energy consumption analysis of the network (A) Number of events processed Vs Energy consumption (B) Number of events processed Vs Residual energy.
Energy Competence Average dissipated energy is the measurement of the total dissipated energy in a single node in the network to the no of event acknowledged by the sink. From the Fig 12, it is observed that the proposed network scheme can lessen more energy consumption compared with LEACH and TEEN. Average Energy Dissipation (mJ/node/event)
Ene rgy Efficie ncy 15
10
5
0 0
10
20
30
40
50
Netw ork Size / cluster (No. of cluster =5) Propos ed
LEACH
TEEN
(A) Average Energy Dissipation (mJ/node/event)
Ene rgy Efficie ncy 15
10
5
0 0
10
20
30
40
50
Netw ork Size / cluster (No. of clusters = 15) Propos ed
LEACH
TEEN
(B) Figure 12: Energy efficiency of the proposed scheme (d= 410) (A) Number of clusters = 5 (B) Number of clusters=15 There are three reasons for less energy consumption by the proposed scheme.
23660
Rajkamal R The first aspect is energy heterogeneous nature of the node in the network which reduces unnecessary communication overhead in the setup phase that is involved during the selection of CH. The second aspect is that the major communication cost is saved since only reduced set of the sensed data is transmitting / receiving. The third aspect is that the CH is sending one packet (PQ information in the form of event code rather than transmission of the whole processed data) to the sink.
Latency Latency is the measurement of time when the sink receives the primary data after sending the query request on the particular node. Since the reduced data set and event code communication is taken place in the projected network method the latency is convincing compare to LEACH and TEEN protocols as observed from Fig 13. In this, the second method of event communication (change of channel) is not considered. Since, it is applicable for PQ events which are without immediate operational consequences. From the literature study, the LEACH and TEEN protocols are performing better when the network is having 3 to 4 no of clusters. The increase in no of clusters of the network leads to increase in the latency to reach the base station due to multi-hop communication. In this work, the latency is observed by considering the time taken for data transmission, data processing of sensor node and cluster head.
Time of receiving the first data (ms)
Late ncy Analysis 11
10
9
8 0
10
20
30
40
50
Ne tw or k Size / clus te r (No. of clus te r s = 5) Proposed
LEA CH
TEEN
(A)
Late ncy Analysis
Time of receiving the first data (ms)
12 11 10 9 8 0
10
20
30
40
50
Ne tw ork Size / clus te r (No. of clus te r = 15) Proposed
LEACH
TEEN
(B) Figure 13: Latency analysis of the proposed scheme (A) No. of clusters = 5 (B) No. of clusters=15
Framework of Wireless Sensor Network for Power Quality Monitoring
23661
Conclusion Network life time must hold the fundamental design for any Wireless sensor network. Extension of Energy life time in Wireless sensor network is a very challenging process. Specialized, resource rich nodes in terms of functionalities are deployed in the network, which could achieve longer network life time. The network is organized into clusters. The communication overhead in CH selection in each round is reduced by fixing one node permanently as CH for all rounds of communication thereby considerable saving in energy is achieved. Each cluster is having a CH which is single hop with its sensor nodes. CHs helps in the communication of the event to the BS after assigning the event code / change of channel using MTE routing either single hop or multihop to the base station. The entire network‟s steady phase working is discussed in the form of sequence diagram. The query request is originated from base station; event collection is originated from the sensor node and event code communication is initiated by cluster head and they taken for discussion here. The proposed framework shows prominent energy efficiency in PQ disturbances monitoring application in comparison with other protocols such as LEACH and TEEN.
Acknowledgement The authors would like to express their gratitude towards the immense support for laboratory development by the department of science and technology, india for sponsoring fist project (sr/fst/college-189/2013). and also to express their gratitude towards the immense support for laboratory development by the aicte, new delhi for sponsoring modrobs project (ref:12/aicte/rifd/mod(policy-3rd)/pvt- 129/2012-13)
References [1]
[2]
[3]
[4]
[5]
Juang, P. Oki, H. Wang, Y. Martonosi, M. Peh, L. S. and Rubenstein, D. “Energy- efficient computing for wild-life tracking: Design tradeoffs and early experiences with ZebraNet”, ASPLOS‟02, ACM, 2002. Mainwaring, A. Polasrte, J. Szewczyk, R. Culler, D. and Anderson, J. ”Wireless sensor networks for habitat monitoring”, WSNA‟02, Atlanta, Georgia, USA, 2002. Szewczyk, R. Mainwaring, A. Polasrte, J. Anderson, J. and Culler, D. “An analysis of a large scale habitat monitoring application”, SenSys'04, Baltimore, Maryland, USA, 2004. Allen, G. W. Lorincz, K. Ruiz, A. Marcillo, O. Johnson, J. Lees, J. and Welsh, M. “Deploying a wireless sensor network on an active volcano”, IEEE Internet Computing, Vol. 10, No. 2, pp. 18-25, 2006. Martinez, K. Padhy, P. Riddoch, A. Ong, H. L. R. and Hart, J. K. “Glacial environment monitoring using sensor networks”, REALWSN'05, Stockholm, Sweden, 2005.
23662
Rajkamal R
[6]
Jovanov, E. O‟Donnell Lords, A. Raskovic, D. Cox, P.G. Adhami, R. and Andrasik, F. “Stress monitoring using a distributed wireless intelligent sensor system”, IEEE Engineering in Medicine and Biology Medicine, 2003. Otto, C. Milenkovic, A. Sanders, C. and Jovanov, E. “System architecture of a wireless body area sensor network for ubiquitous health monitoring”, Journal of Mobile Multimedia, Vol. 1, No. 4, Chintalapudi, K. Fu, T. Paek, J. Kothari, N. Rangwala, S. Caffrey, J. Govindan, R. Johnson, E. and Masri, S. “Monitoring civil structures with a wireless sensor network”, IEEE Internet Computing, 2006. Kottapalli, V.A. Kiremidjian, A. S. Lynch, J. P. Carryer, E. Kenny, T. W. Law, K. H. and Lei, Y. “Two-tiered wireless sensor network architecture for structural health monitoring”, Proceedings of SPIE‟s 10th Annual Symposium on Smart Structures and Materials, San Diego, USA, 2003. Paek, J. Chintalapudi, K. Caffrey, J. Govindan, R. and Masri, S. ”A wireless sensor network for structural health monitoring: performance and experience”, Proceedings of the 2nd IEEE Workshop on Embedded Networked Sensors (EmNetS-II), Sydney, Australia, 2005. Schmid, T. Dubois-Ferrière, H. and Vetterli, M. “Sensor scope: experiences with a wireless building monitoring sensor network”, REALWSN‟05, Stockholm, Sweden, 2005. Dreicer, J. S. Jorgensen, A.M. and Dors, E.E. “Distributed sensor network with collective computation for situational awareness”, AIP Conference Proceedings, Vol. 632, pp. 235-243, 2002. Simon, G. Balogh, G. Pap, G. Maroti, M. Kusy, B. Sallai, J. Ledeczi, A. Nadas, A. and Frampton, K. “Sensor network-based counter sniper system”, SenSys‟04, Maryland, USA, 2004. Coleri, S. Cheung, S.Y. and Varaiya, P. “Sensor networks for monitoring traffic”, University of California Berkeley Technical Report, 2004. Brignone, C. Conners, T. Lyon, G. and Pradhan, S. “Smart locus: an autonomous, self-assembly sensor network for indoor asset and systems management”, Hewlett-Packard Development Company Technical Report, 2005. Mihaela, C. Eduardo, B. F. and Anupama, S. “A pattern for sensor network architecture”, 2nd Asian Conference on Pattern Languages of Programs (AsianPlop'2011), 2011. Heinzelman, W. Chandrakasan, A. and Balakrishnan, H. “An applicationspecific protocol architecture for wireless micro-sensor networks”, IEEE Transactions on Wireless Communications, Vol. 1, No. 4, pp. 660-670, 2002. Younis, O. and Fahmy, S. “Distributed clustering in ad-hoc sensor networks: a hybrid energy efficient approach”, Proceedings of IEEE INFOCOM, 2004.
[7]
[8]
[9]
[10]
[11]
[12]
[13]
[14] [15]
[16]
[17]
[18]
Framework of Wireless Sensor Network for Power Quality Monitoring [19]
[20]
[21]
23663
Wang, X. and Zhang, G. “DECP: A distributed election clustering protocol for heterogeneous wireless sensor networks”, series of Lecture Notes on Computer Science. Berlin, Germany: Springer Berlin Heidelberg, Vol. 4489, 2007. Handy, M. J. Haase, M. and Timmermann, D. “Low energy adaptive clustering hierarchy with deterministic cluster-head selection”, Proceedings of the 4th International Workshop on Mobile Lundelius, J. and Lynch, N. “An upper and lower bound forclock synchronization”, Information and Control, Vol.62, No. 2,pp. 190-204, 1984.