FreeEye - Interactive Intuitive Interface for Large-scale Image Browsing Kan Ren
Janko Calic
I-Lab, CCSR, University of Surrey Guildford GU2 7XH, UK +44(0)1483684704
I-Lab, CCSR, University of Surrey Guildford GU2 7XH, UK +44(0)1483684739
[email protected]
[email protected]
ABSTRACT Intuitive interfaces have become increasingly important multimedia applications, from personal photo collection to professional management systems. This paper presents a novel intuitive interactive interface for browsing of large image collections that visualizes underlying structure of the dataset by its size and spatial relations. In order to achieve this, images are initially clustered using an unsupervised graph-based clustering algorithm. By selecting images in a hierarchical layout of the screen, user can intuitively navigate through the collection. The experimental results demonstrate a significant speed-up in a content search scenario compared to a standard browsing interface, as well as inherent intuitiveness of the system.
Categories and Subject Descriptors H.3.1 [INFORMATION STORAGE AND RETRIEVAL]: Content Analysis and Indexing – Abstracting methods; H.3.7 [INFORMATION STORAGE AND RETRIEVAL]: Digital Libraries – User issues; H.5.2 [INFORMATION INTERFACES AND PRESENTATION]: User Interfaces – Graphical user interfaces, Screen design, User-centered design.
General Terms Algorithms, Performance, Design, Experimentation, Human Factors.
Keywords Multimedia systems, image browsing, HCI, image clustering
1. INTRODUCTION Nowadays, personal media devices such as digital camera or video recorders have become a commonplace. Users can easily take hundreds of photos and many video clips on a daily bases. However, only a few generate high-level annotations at the time of its import into their personal computers. Currently, the photos only have capture date and time as a default metadata, while video clips by default do not have any metadata assigned. This implies that the user’s local storage is filled with photos and video clips in a disordered state. The problem of browsing and retrieving content Permission to make digital or hard copies of all or part of this work for personal or classroom use is granted without fee provided that copies are not made or distributed for profit or commercial advantage and that copies bear this notice and the full citation on the first page. To copy otherwise, or republish, to post on servers or to redistribute to lists, requires prior specific permission and/or a fee. MM’09, Oct. 19–24, 2009, Beijing, China. Copyright 2009 ACM 978-1-60558-608-3/09/10...$10.00.
from such collections is becoming a major challenge of multimedia management systems. There are two major approaches that tackle this problem. One approach is to ask users to manually annotate images every time they import the media. This approach has been proven unfeasible, mainly due to the proliferation of everyday digital media produced by a common user. The other option is to generate annotation automatically using content-based media analysis, computer vision and machine learning. However, due of the problem of “semantic gap” between the low level features such as color, texture, etc. and high-level semantic understanding of the media, the content-based retrieval cannot deliver the satisfying results. The work presented in this paper makes a shift towards more usercentered design of interactive image browsing interface by augmenting user's interaction with more content rather than learning the way users create related semantics. This shift enables not only efficient retrieval of the desired content, but offers more intuitive access to vast visual data and often gives unexpected perspective of the explored dataset. Finally, this approach facilitates more intuitive and effortless browsing, enabling exploitation of the system by a wider user base. The paper is structured as follows. The work related to this area is presented in Section 2. Section 3 brings the methodology used in designing the browsing interface, starting with image clustering and describing the interface layout. In order to evaluate the presented system Section 4 describes the experimental setup, while Section 5 discusses the achieved results. In Section 6 we reflect upon the results and outline the future plans, while the references are given in Section 7.
2. RELATED WORK There has been a lot of effort put in the scientific research as well as commercial development of user-friendly image browsing applications. Most of the browsing applications are based on the time domain clustering of the personal photo collections, having the temporal metadata readily available from the digital cameras. The applications simply cluster the images based on the time when the photo or video clip was generated [1][2][3]. But the disadvantage of this approach is that the user needs to type manually an event name for a group of photos, which can be inexact and unreasonable given the fact that events can span more groups and vice versa. Given the proliferation of the GPS technology, some of the new applications are using the image similarity based on the location where the operator took the photos [4][5]. Being a new technology,
GPS modules are still rarely built into the camera, so users often need to assign the location information manually.
chosen as the similarity metric, but the choice of the metric is completely independent of the browsing interface.
Recently, some commercial applications introduced semi-automated annotation of images by using the face recognition technology [5]. The application first detects face region in the photo and then attempts to identify and tag the image by using face similarity algorithm. However, this approach is unfeasible for many photos, such as landscape photos, animals, etc., since people are not always the major subjects in a captured scene.
3.1 Image Clustering
There have been a number of approaches to develop visualization that would augment the usability of interfaces to large image collections. In [6], Huynh et. al. introduced a method that trades off screen space for better presentation of temporal order in photos. In addition, some systems utilized methodologies to analyze the underlying data structures to present image collections [7] in a more accessible way. However, the interaction with large image collections has not been addressed in an intuitive way. Derived from its definition in [8], intuition implies correlation between system inference and the user’s expectations. By following this definition, we developed an intuitive interactive interface (FreeEye) for browsing of large image collections, based on the efficient image clustering method and hierarchical interface.
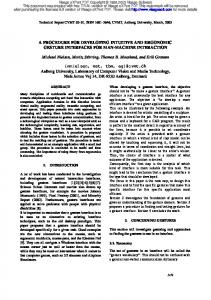
3. IMAGE BROWSING INTERFACE In order to interactively browse large image collections an intuitive browsing interface has been developed. It follows the idea of ranked image representation, where more relevant images should be more apparent and thus displayed bigger. User selects an image from the dataset, which is positioned centrally, and the remaining dataset is hierarchically represented on the screen. By doing this, user practically moves the point from which the collection is explored by each click. The image browsing system comprises two main modules: image clustering engine and the interface generation, as depicted in the Figure 1. The main driver for the image importance is defined by the level of similarity between the user-selected central image and other images from the database by using perceptual features. In this paper a three-dimensional HSV colour histogram has been
To achieve system scalability and algorithm complexity nearly linear to the number of key-frames, a specific graph based clustering algorithm is utilized [9]. Although initially formulated in the image segmentation context, this algorithm can be extended to a more generic dataset scenario. Its ability to preserve detail in lowvariability clusters while ignoring detail in high-variability regions maintains notion of global features of the dataset in the process of making greedy decisions locally. Following a common approach to graph based image clustering, this method forms edges of a graph G=(V,E), where each image corresponds to a node vi∈V in the graph, and certain images are connected by undirected edges (vi,vj)∈E. Weights of each edge w(vi,vj) measure the dissimilarity between the two corresponding images. The graph node grouping is defined by a graph predicate D(c1,c2), which evaluates if the two regions c1 and c2 should stay disconnected by comparing inter and intra regional differences:
D(c1,c 2 ) : Ext(c1,c 2 ) > mInt(c1,c 2 )
(1)
The internal difference of a component c is defined as the largest weight in the minimum spanning tree of the component. The joint internal difference measure mInt(c1,c2) is given as:
mInt = min(Int(c1 ) + τ (c1 ),Int(c 2 ) + τ (c 2 ))
(2)
The threshold function τ(c)=k/|c|, where k is some constant parameter and |c| denotes the size of c, controls the degree to which the difference between the two components must be greater than their internal differences. The intra component difference is defined as the minimal weight edge connecting the two components. The technique adaptively adjusts the merging criterion based on the degree of variability in neighboring regions of the dataset. The node grouping is iteratively repeated until there is no more component merging. In order to represent the dominant content of the selected section of video, each component is represented with a frame closest to the component’s centre of the mass.
Figure 1. Building blocks of the image browsing interface
3.2 Interface
5. RESULT ANALYSIS
The interactive interface is generated as follows. The centre image is displayed at 100% of its size. If the user clicks on an image, the image will move the centre of the next screen, and the display will adapt itself to represent perceptual neighborhood of the central image. The second level of frame sizes contains 12 images from the same cluster that are most similar to the central image. These frames are displayed at 50% their original size. The third level contains 36 images displayed at 25% size, separated into two parts: four edges and four corners. The 32 images located at the four edges are the centers of clusters closest to the central image. To support knowledge discovery and help users locating other areas of interest, four random pictures are located at four corners of the screen. Every time the user clicks, the system re-arranges all images as described above.
The basic statistics of the experimental results shows that the average time for a user to finish the whole experiment is 8 minutes and 20 seconds in 50 mouse clicks. This gives an average of around 100 seconds time and 10 mouse clicks needed for a user to find an image from the database of 3000 images. Assuming that in the case of thumbnail presentation users need to inspect all images from the data set, the average number of images inspected by using the FreeEye tool is 6 times smaller.
The tool is designed to record the user history: images they selected, timings and locations. Thus, user’s initial screen shows the favorite 45 images from the user history. Otherwise, if the user has never used the tool before, it will display random 49 images from the database on the initial screen.
In order to evaluate the interface intuitiveness, the user history records are studied. The Figure 3 shows user’s browsing paths and distribution of user clicks for all 26 users in all 5 tasks. The left column of the Figure 3 presents the distance between the desired image and the central image for each user click from the start of the task until the desired image is found. The right column in the Figure 3 shows a histogram of user clicks needed to find the desired image for all 5 tasks.
4. EXPERIMENT The image content used is a selection of cca. 3000 color images from the Corel image database. In order to test the effectiveness of the browsing tool, the database subset includes multiple semantic concepts such as the wild animals (leopard, eagle, fox, etc.), nature scenery (forest, ocean, etc.), historical buildings (western temples, Asian buildings, etc.), portrait, plants (flower, garden, etc), etc. The subjective tests were conducted by inviting 26 people to join the Grand Challenge “Find me a postcard” [10] in finding 5 images from a set of 3000 only by the means of interactive interface described above. Of 26 people involved, 18 persons were male, and 17 had the advanced computer knowledge. All users were using the tool for the first time and the only requirement was to have a basic knowledge of manipulation with a mouse. The gender, racial and cultural diversity of the subjects was excellent.
Figure 2. Five images used in the subjective evaluation The task was to find the same 5 images in the same order. The content of the five images was varied, as presented in the Figure 2. We recorded the full browsing system state for every user step, which included indexes of all images on the screen, their positions, user selection and timing. This has enabled us to fully reproduce the browsing process for each user and analyze achieved results.
Figure 3. User browsing paths and distribution of user clicks From all 5 browsing paths, it is observable that after only a few clicks, the trend of the distance curves is to fall towards zero. This means that the users were rapidly converging towards the goal of the task just after a couple of clicks, implying system’s intuitive
character. This trend is obvious in the 2nd, 3rd and 5th task, while the initial task and the 4th task that was a more difficult one, demonstrated the same convergence, but required more user clicks. Since the timing and user clicks directly depend upon the difficulty of the task, we studied the distribution of the number of user clicks required to find the desired image in the database. From the histograms shown in the right column of the Figure 3, it can be observed that the distributions become increasingly skewed in a positive sense (right-skewed) as the users progress through the tasks. This represents that more users require less iterations to find the desired image as they use the interface. This characteristic demonstrates that without any assistance, users intuitively learn how to efficiently use the interface, regardless of the task difficulty. The same conclusions were made while studying the distribution of time required to find the desired image for each user. In addition to the click and time statistics, we have studied the spatial distribution of positions of images selected by users. As depicted in the Figure 4, where the region brightness represents frequency of its selection, images in the second level (neighboring frames of the central image) are selected more often than images in the third level. However, some of the random images in the four corners were occasionally selected, mainly to move away from the currently displayed set of images and test where they would take the user in his search attempt. Furthermore, the top area of the second level was slightly more popular than bottom area, while the right side was a more popular than left side.
making surprising links between the data subsets. In addition, the users could manipulate the visual interface without any specific introduction. Finally, the knowledge discovery element of four random images in the corners of the display has been proven as a very useful tool of the interface. The future work will be based on the initial findings that users tend to follow similar content in similar positions, enabling possible personalization of the interface and development of the visual tokens that would speed-up the initial selection of the area of interest in the feature hyper-space. In addition, new similarity measures and features will be explored as well as their combination, in order to improve system intuitiveness and usability in various application scenarios.
7. REFERENCES [1] M. Cooper, J. Foote, A. Girgensohn, and L. Wilcox. Temporal event clustering for digital photo collections. In Proceedings of the eleventh ACM international conference on Multimedia, pages 364–373. ACM Press, 2003. [2] A. Graham, H. Garcia-Molina, A. Paepcke, and T. Winograd. Time as essence for photo browsing through personal digital libraries. In Proceedings of the Second ACM/IEEE-CS Joint Conference on Digital Libraries, 2002. [3] A.Loui and A. E. Savakis. Automatic image event segmentation and quality screening for albuming applications. In IEEE International Conference on Multimedia and Expo, 2000 [4] Toyama, K., Logan, R., and Roseway, A. Geographic Location Tags on Digital Images. In Proc. of 11th Annual ACM International Conference on Multimedia (MM2003) (Berkeley, CA, November 2-8, 2003). ACM Press, New York, NY, 2003, 156-166. [5] Apple Ltd., iPhoto’09. http://www.apple.com/ilife/iphoto/ [6] Huynh, D. F., Drucker, S. M., Baudisch, P., and Wong, C. Time quilt: scaling up zoomable photo browsers for large, unstructured photo collections. In CHI '05 Extended Abstracts on Human Factors in Computing Systems, ACM, New York, NY, 1937-1940. 2005. [7] Bederson, B. “PhotoMesa: a zoomable image browser using quantum treemaps and bubblemaps”, Proceedings of the 14th annual ACM symposium on User interface software and technology, pp. 71 – 80, 2001.
Figure 4. Spatial distribution of positions of selected images
6. CONCLUSIONS AND FUTURE WORK In this paper we have introduced a novel interactive interface for intuitive browsing of image collections. The main aim of the browsing system was to enable intuitive and responsive browsing of large-scale image databases. The presented interface is not only targeting browsing of personal photo collections, but can be utilized in other applications such as video summarization and contentbased retrieval. From the initial experimental results, the system is very usable and intuitive, while offering pleasant browsing of visual data and often offering new perspectives of the same dataset by
[8] Jung, Carl G. Psychological Types. Princeton, New Jersey: Princeton University Press, 1971. [9] P. F. Felzenszwalb and D. P. Huttenlocher, “Efficient GraphBased Image Segmentation”, International Journal of Computer Vision, Vol. 59, No. 2, September 2004. [10] J. Calic, K. Ren, “Find me a Postcard - Interactive Search Challenge To Find Images In A Large Collection Using A Fun Image Browsing Tool” Feb, 2009; http://personal.ee.surrey.ac.uk/Personal/J.Calic/GrandChalleng eFlyer.pdf