FREQUENCY, MOISTURE, TEMPERATURE, AND DENSITY-DEPENDENT DIELECTRIC PROPERTIES OF WHEAT STRAW W. Guo, J. Yang, X. Zhu, S. Wang, K. Guo
ABSTRACT. The dielectric constant (ε′) and dielectric loss factor (ε″), components of the complex permittivity relative to free space, of wheat straw samples at moisture content of 10.4% to 20.3% wet basis (w.b.) were determined with a parallel-plate electrode assembly over the frequency range from 1 to 1000 kHz, bulk density range from 47.2 to 108.1 kg m-3, and temperature range from 5°C to 40°C. Obvious negative and linear relationships between logarithmic permittivities (ε′ and ε″) and logarithmic frequency were found below about 500 kHz. Over the investigated ranges of the variables, both ε′ and ε″ increased almost linearly with increasing temperature and increased obviously with an increase in moisture content and bulk density at higher levels. The relationship between the dielectric properties and moisture content, temperature, and bulk density at some selected frequencies could be described by third-degree polynomial equations. Analysis of variance showed that moisture content, temperature, and bulk density were all significant factors of these equations at a significance level of 0.0001. The equations were verified to be accurate in calculating the dielectric properties of wheat straw from a given moisture content, temperature, and bulk density at the selected frequency. This study offers useful information for developing moisture sensors of wheat straw from dielectric properties. Keywords. Dielectric constant, Dielectric loss factor, Dielectric properties, Permittivity, Straw.
S
traw includes most solid plant residues gathered from crops after the grain is harvested. In China, the gross collectable and usable quantity of straw resources in 2005 was about 686 million metric tons (Wang et al., 2010). Except for about 15% used for animal feed, much of this straw is burned after harvest. Facing the environmental problems caused by burning straw and the worldwide shortage of forest and energy resources, how to use straw as a renewable resource is a critical problem that must be solved effectively and in an environmentally friendly manner. Wheat straw is a major type of straw, with about 107 million metric tons produced in China in 2005 (Wang et al., 2010). Since it contains a large amount of fiber, wheat straw is used to make paper and produce particleboard in different densities (Mo et al., 2003; Wang and Sun, 2002). This can reduce wood consumption and ease excessive deforestation. Wheat straw also has excellent thermal and sound insulation properties, so it is used in construction (Lawrence et al., 2009). Moreover, the high energy content in wheat straw provides an opportunity to convert straw’s heat energy to electric power (Yang et al., 2007). Therefore, wheat straw is purchased by many factories for different purposes. This
Submitted for review in December 2012 as manuscript number FPE 10063; approved for publication by the Food & Process Engineering Institute of ASABE in April 2013. The authors are Wenchuan Guo, Professor, Jun Yang, Graduate Student, Xinhua Zhu, Associate Professor, Shaojin Wang, ASABE Member, Professor, and Kangquan Guo, Professor, College of Mechanical and Electronic Engineering, Northwest A&F University, Yangling, China. Corresponding author: Xinhua Zhu, College of Mechanical and Electronic Engineering, Northwest A&F University, Yangling, Shaanxi 712100, China; phone: +86-29-87092391; e-mail:
[email protected].
demand allows wheat straw to become a cash crop. Since the unit price of wheat straw is based on weight and straw decays when kept in a high-moisture state, moisture content is a main criterion in the wheat straw market. Moisture content is also an important factor in straw’s application. For example, wheat straw at high or low moisture content may produce disqualified particleboard. Only straw with the appropriate moisture level can ensure final product quality. In electric power plants that convert wheat straw’s heat energy to electric power, if the moisture content of wheat straw is higher than 16% wet basis (w.b.), then more energy is lost to vaporize the moisture during combustion (Yang et al., 2007). This greatly degrades the heat conversion rate. Therefore, moisture content detection is very important during wheat straw marketing, storing, processing, and use. The simplest and most reliable method of measuring moisture content is to weigh a sample of about 25 g and dry it in an oven at 103°C for 24 h (ASAE Standards, 2005). Obviously, the oven-drying method has major disadvantage for long-term measurement and is unsuitable for on-site measurement in the field. Although some industries use microwaves to measure moisture content, this method is also unsuitable for on-site use. Developing a portable, quick, and precise wheat straw moisture meter is an urgent need in the straw industry. Considerable data indicate that the dielectric properties of materials are mainly influenced by their moisture content. For example, the dielectric constant (ε′) and loss factor (ε″), which are the real part and imaginary part, respectively, of the relative complex permittivity (ε*), where ε* = ε′ − jε″ (j = 1 ), increase with moisture content in grains and cereals (Guo et al., 2008; Guo et al., 2010a;
Transactions of the ASABE Vol. 56(3): 1069-1075
© 2013 American Society of Agricultural and Biological Engineers ISSN 2151-0032
1069
Guo et al., 2012; Jiao et al., 2011; Lawrence et al., 1998; Nelson, 1981; Nelson and Trabelsi, 2006; Sacilik and Colak, 2010; Trabelsi and Nelson, 2004) and other foods (Fagan et al., 2005; Guo et al., 2010b; Guo et al., 2010c; Nelson and Bartley, 2000). In addition, the temperature and bulk density of the materials and the electric field frequency also affect the dielectric properties, such as in ground grains and cereals (Guo et al., 2008; Guo et al., 2010a) and unground grains and cereals (Lawrence et al., 1990, 1992; Sacilik and Colak, 2010; Sokhansanj and Nelson, 1988; Trabelsi and Nelson, 2006). Ko and Zoerb (1970) measured Thatcher wheat straw’s dielectric constant over temperatures from 10°C to 32.2°C, bulk densities from 28 to 70 kg m-3, and moisture contents from 11.2% to 19.2% dry basis at 100 kHz and 1000 kHz. They found that the effective dielectric constant of wheat straw was a function of its moisture content, temperature, density, and the frequency of the electric field. However, the dielectric loss factor was not detected. Moreover, the investigated frequencies were only at 100 kHz and 1000 kHz, and the bulk density range was a bit narrow. To offer more interesting information for developing a moisture sensor for wheat straw, the dielectric properties of wheat straw over a frequency range of 1 to 1000 kHz, a bulk density range of 47.2 to 108.1 kg m-3, a moisture content range of 10.4% to 20.3% w.b., and a temperature range of 5°C to 40°C were investigated in this study. Mathematical models relating the dielectric properties to moisture content, temperature, and bulk density at selected frequencies were developed. Their accuracy in predicting the dielectric properties was evaluated.
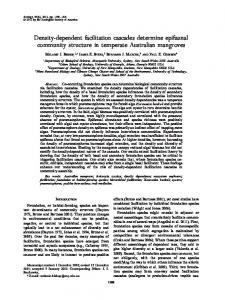
Figure 1. Diagram of the parallel-plate electrode assembly.
obtained for further tests. DETERMINATION OF DIELECTRIC PROPERTIES The dielectric constant of a material is frequently considered to be the ratio of the capacitance of a capacitor with the material as the dielectric to the capacitance of the same capacitor with air, or more properly vacuum, as the dielectric (Berbert et al., 2001; Nelson and Stetson, 1976): ε' =
WHEAT STRAW Wheat straw (variety Xinong 979) at a moisture content of 10.4% w.b. was collected from a local wheat experiment site in Yangling, China. The wheat straw was chopped in a blender and screened with a 3 cm sieve. The longer straw was cut with shears, and straw stalk lengths from 3 to 5 cm were used in the study. Samples were kept at room temperature at 23°C to 25°C before preparation. SAMPLE PREPARATION Calculated amounts of distilled water were added to the wheat straw stalks at the initial moisture content of 10.4% w.b. to prepare wheat straw samples at different moisture levels. For moisture contents higher than 15.0%, water was added three or four times with a one-day interval. The samples with added water were kept in polyethylene bags at room temperature of 23°C to 25°C for at least two days. The bags were shaken at least seven times per day to distribute the moisture evenly. Before the experiment, the sample moisture contents were determined by drying about 25 g samples in triplicate in aluminum dishes for 24 h at 103°C in a forced-air oven (WG-71, Tianjin Taisite Instrument Co., Ltd, Tianjin, China) (ASAE Standards, 2005). Wheat straw samples at 10.4% (initial moisture content), 12.8%, 15.4%, 17.9%, and 20.3% w.b. were
1070
(1)
where C and C0 are the capacitances (pF) of the samplefilled capacitor and the empty capacitor, respectively. The dielectric loss factor can be calculated as (Lawrence and Nelson, 1993): ε '' =
MATERIALS AND METHODS
C C0
G − G0 2πfC0
(2)
where G and G0 are the conductance values (Siemens) of the sample-filled capacitor and the empty capacitor, respectively, and f is the frequency of electric field (Hz). The capacitance and conductance measurements were taken with an LCR meter (3532-50, Hioki E. E. Corp., Nagano, Japan) at 51 discrete frequencies on a logarithmic scale over the frequency range from 1 to 1000 kHz. The wheat straw samples were placed into a vertically oriented parallel-plate electrode assembly, or sample holder, as shown in figure 1. The assembly consisted of two copper plate electrodes (1.5 mm thick) and two insulating vertical polytetrafluoroethylene (Teflon) plates (10 mm thick). The assembly was supported by two right-triangular Teflon plates on the outside of the vertical Teflon plates and by a Teflon plate (290 mm × 115 mm × 5 mm) as the base of the assembly. The mass of the electrode assembly was 1302 g, and the dimensions of the electrode chamber were 200 mm × 155 mm × 66 mm. The electrode assembly was connected to the LCR meter. EXPERIMENTAL PROCEDURE Prior to dielectric properties measurement, the LCR meter was turned on and allowed to warm up for about 1 h. The open and short calibrations of the LCR meter were done in sequence. Preliminarily measurements showed that
TRANSACTIONS OF THE ASABE
temperature had a negligible influence on the permittivity values of the empty (air filled) sample holder. Therefore, an initial measurement of the empty sample holder, covered with a Teflon plate on top, at 25°C was taken at 51 discrete frequencies from 1 to 1000 kHz. The obtained capacitance and conductance values were used as C0 and G0 in equations 1 and 2, respectively. The prepared wheat straw samples at each moisture level were divided into five subsamples, which were used independently to determine the dielectric properties at five bulk densities. The five bulk densities at each moisture content were labeled density levels 1 to 5. Density 1 was the loosest fill, and density 5 was the densest fill. The mass of the sample holder filled with straw was weighed, and the bulk density was calculated by dividing the mass of the sample by the volume of the holder. The five bulk densities obtained at each moisture level are listed in table 1. The sample holder filled with straw at a given moisture level and bulk density was covered with a Teflon plate on top and put in a refrigerator at -18°C for about 6 h to obtain samples with temperatures lower than 5°C. The sample holder was then taken from the refrigerator and placed in a constant-temperature oven (YHG-400BS, Shanghai Yuejin Medical Instruments Factory, Shanghai, China). To avoid moisture loss, the holder was covered with a Teflon plate with a 5 mm hole in the center. A type-T thermocouple was inserted through the hole to 34 mm depth. Figure 2 shows the experimental setup. The oven temperature was set at 5°C, 10°C, 15°C, 20°C, 25°C, 30°C, 35°C, and 40°C in sequence. After the straw sample temperature achieved the set level and remained constant, the capacitance (C) and conductance (G) were measured at 51 discrete frequencies from 1 to 1000 kHz with three replicates. Each bulk density was measured in Table 1. Bulk densities moisture content. Bulk Density Level 1 (loosest fill) 2 3 4 5 (densest fill) Computer
(kg m-3) of wheat straw samples at each
10.4 47.2 57.9 71.4 78.0 87.8
Moisture Content (% w.b.) 12.8 15.4 17.9 48.6 49.9 51.6 58.9 59.1 62.5 69.0 69.4 72.5 79.4 78.9 91.3 89.1 90.0 101.4
20.3 57.5 67.8 89.5 103.1 108.1
LCR meter
Thermocouple
Constanttemperature over Parallel-plate electrode assembly
Figure 2. Measurement system for determining dielectric properties of wheat straw.
56(3): 1069-1075
duplicate. The values of ε′ and ε″ were calculated using equations 1 and 2, respectively. Mean values for each combination of moisture content, bulk density, and temperature are reported. To determine the moisture loss during measurement, the mass of the sample holder with the straw sample was weighed after measurement. The mass difference before and after measurement showed that the moisture losses were less than 0.4%. MODEL REGRESSION AND EVALUATION The obtained permittivity data for wheat straw at selected frequencies were analyzed using Design-Expert 7.1.6 (Stat-Ease, Inc., Minneapolis, Minn.) to develop mathematical models describing the relationships between permittivities (ε′ and ε″) and moisture content, temperature, and bulk density. Analysis of variance (ANOVA) was used to evaluate the significance of each variable on the regression models. To determine the accuracy of the models, wheat straw samples at eight random moisture levels, ranging from 10% to 20% w.b., were prepared. Their permittivities were measured at randomly selected temperatures over the range from 5°C to 40°C and at bulk densities over the range from 47.3 to 108.1 kg m-3. Eightyeight measurements were done. Linear regressions between the permittivities measured with the parallel-plate electrode assembly and the calculated values based on the regressed mathematical equations were used to evaluate the accuracy of the models in predicting the dielectric properties of wheat straw at a given moisture content, temperature, and bulk density.
RESULTS AND DISCUSSION FREQUENCY-DEPENDENT DIELECTRIC PROPERTIES The obtained dielectric constants and loss factors of wheat straw samples at five moisture levels, bulk density level 3, and 25°C over the frequency range from 1 to 1000 kHz are shown in a log-log plot in figure 3. Figure 3 shows that the dielectric constant and loss factor both decreased with increasing frequency. Below 500 kHz, logε′ and logε″ decreased nearly linearly with the increase of logf. The relationships can be expressed as: logε' = a − blogf
(3)
logε′′ = c − dlogf
(4)
where a, b, c, and d are regression constants, and f is the frequency of the electric field (1 kHz ≤ f ≤ 500 kHz). The coefficient of determination (R2) is usually used as the primary criterion in evaluating the accuracy of a regression model. Table 2 lists regression constants and R2 values for equations 3 and 4 at five moisture levels, five bulk densities, and 25°C. All coefficients of determination are higher than 0.99, which means that the logarithmic dielectric constant and dielectric loss factor had outstanding linear relationships with logarithmic frequency. This conclusion was also applicable to other wheat straw samples.
1071
10.4%, 12.8%, 15.4%, 17.9%, 20.3%,
100
71.4 69.0 69.4 72.5 89.5
kg kg kg kg kg
10
1
0.1
103
104
105
100
-3
m m-3 m-3 -3 m m-3
Dielectric constant
Dielectric constant
1000
106
Frequency, Hz
1
(a)
100
71.4 69.0 69.1 72.5 89.5
kg kg kg kg kg
104
105
106
10
1
103
104
105
(a)
-3
m m-3 -3 m -3 m m-3
106
1000
Dielectric loss factor
10.4%, 12.8%, 15.4%, 17.9%, 20.3%,
1000 Dielectric loss factor
103
Frequency, Hz
10000
.1
5 OC O 10 C O 15 C O 20 C O 25 C 30 OC 30 OC 40 OC
10
5 OC 10 OC O 15 C 20 OC 25 OC 30 OC 35 OC 40 OC
100
10
Frequency, Hz
(b) Figure 3. Dielectric (a) constant and (b) loss factor of wheat straw samples at the indicated moisture contents, bulk density level 3, and 25°C over the frequency range from 1 to 1000 kHz. 2
Table 2. Regression constants and R values for equations 3 and 4 at five moisture contents, five bulk densities, and at 25°C. Regression Constants and R2 Values Bulk Equation 3 (logε′) Equation 4 (logε″) Density a b R2 c d R2 (kg m-3) 10.4% w.b. Moisture 47.2 -0.2797 1.5682 0.9705 -0.4598 1.9978 0.9835 57.9 -0.2995 1.7788 0.9783 -0.4469 2.1061 0.9883 71.4 -0.3254 1.9286 0.9835 -0.4630 2.2738 0.9942 78.0 -0.3527 2.1332 0.9892 -0.4709 2.4408 0.9963 87.8 -0.3590 2.2254 0.9878 -0.4863 2.5972 0.9973 12.8% w.b. Moisture 48.6 -0.3126 1.9154 0.9940 -0.3809 1.9107 0.9789 58.9 -0.3051 1.9251 0.9896 -0.4040 2.0602 0.9859 69.0 -0.3707 2.3622 0.9983 -0.4204 2.4035 0.9977 79.4 -0.4175 2.6584 0.9986 -0.4836 2.8652 0.9998 89.1 -0.3978 2.6148 0.9882 -0.4736 2.8399 0.9997 15.4% w.b. Moisture 49.9 -0.3414 2.2760 0.9987 -0.3359 2.0298 0.9956 59.1 -0.3192 2.3296 0.9998 -0.3887 2.4389 0.9931 69.4 -0.3669 2.6484 0.9999 -0.5059 3.1995 0.9917 78.9 -0.3791 2.8052 0.9999 -0.5013 3.2915 0.9922 90.0 -0.4394 3.1710 0.9995 -0.6213 4.0748 0.9954 17.9% w.b. Moisture 51.6 -0.3042 2.3619 0.9999 -0.4857 3.0382 0.9837 62.5 -0.3460 2.6407 0.9997 -0.5276 3.4045 0.9866 72.5 -0.3833 2.9315 0.9993 -0.6739 4.3798 0.9914 91.3 -0.4630 3.4142 0.9991 -0.6811 4.5950 0.9952 101.4 -0.4754 3.5485 0.9986 -0.7352 5.0092 0.9960 20.3% w.b. Moisture 57.5 -0.3296 2.5334 0.9995 -0.5593 3.5447 0.9819 67.8 -0.4208 3.2049 0.9990 -0.7503 4.9826 0.9943 89.5 -0.4841 3.6580 0.9991 -0.7202 4.9873 0.9963 103.1 -0.4922 3.8203 0.9964 -0.8192 5.7847 0.9972 108.1 -0.4804 3.8327 0.9958 -0.8104 5.7912 0.9966
1072
1
103
104
105
106
Frequency, Hz
(b) Figure 4. Dielectric (a) constant and (b) loss factor of wheat straw samples at moisture content of 15.4% w.b. and bulk density of 90.0 kg m-3 at the indicated temperatures over the frequency range from 1 to 1000 kHz.
Figure 4 shows the obtained dielectric constants and loss factors of wheat straw samples at 15.4% w.b. moisture content and 90.0 kg m-3 bulk density at eight temperatures from 5°C to 40°C over the frequency range from 1 to 1000 kHz. Obviously, temperature had no influence on the decreasing trend of dielectric constant and loss factor with increasing frequency below about 500 kHz. Moreover, the decrements of logε′ and logε″ were almost constant when the frequency increased from 1 to 500 kHz. The decrements of logε″ were 1.67, 1.74, and 1.82, respectively. Below 500 kHz, both ε′ and ε″ decreased monotonically with increasing frequency at all temperatures, moisture contents, and bulk densities. MOISTURE-DEPENDENT DIELECTRIC PROPERTIES Wheat straw samples of similar bulk density at five moisture levels were used to investigate the influence of moisture content on the dielectric properties. Figure 5 shows the measured dielectric constants and loss factors of wheat straw samples at bulk densities of 87.8, 89.1, 90.0, 91.3, and 89.5 kg m-3 (mean of 89.5 kg m-3 and standard deviation of 1.1 kg m-3) at moisture contents of 10.4%, 12.8%, 15.4%, 17.9%, and 20.3% w.b. at selected frequencies and 25°C. At a given frequency, the dielectric constant and loss factor both increased with increasing
TRANSACTIONS OF THE ASABE
60
35
40
Dielectric constant
Dielectric constant
30
10 kHz 50 kHz 100 kHz 500 kHz
50
30 20 10 0 10
-3
10.4%, 87.8 kg m -3 12.8%, 89.1 kg m -3 15.4%, 90.0 kg m -3 17.9%, 101.5 kg m -3 20.3%, 108.1 kg m
25 20 15 10 5
12
14
16
18
20
0
22
0
5
10
15
20
25
30
35
40
45
Temperature, oC
Moisture content, % w.b.
(a)
(a)
120
80 -3
10 kHz 50 kHz 100 kHz 500 kHz
80
10.4%, 87.8 kg m 12.8%, 89.1 kg m-3 15.4%, 90.0 kg m-3 17.9%, 101.5 kg m-3 -3 20.4%, 108.1 kg m
70 Dielectric loss factor
Dielectric loss factor
100
60 40 20
60 50 40 30 20 10
0 10
12
14
16
18
20
22
Moisture content, % w.b.
(b) Figure 5. Influence of moisture content on dielectric (a) constant and (b) loss factor of wheat straw samples at bulk density of 89.5 ±1.1 kg m-3 over the moisture range from 10.4% to 20.4% w.b. at the indicated frequencies and 25°C.
moisture content. The increase was larger at lower frequencies than at higher frequencies. Similar moisturedependent dielectric properties were also observed at other bulk densities and temperatures. TEMPERATURE-DEPENDENT DIELECTRIC PROPERTIES The influence of temperature on the dielectric constant and loss factor of wheat straw samples at 100 kHz at bulk density level 5 and each moisture level is shown in figure 6. At a given moisture content and bulk density, ε′ and ε″ increased almost linearly with an increase in temperature. Obviously, although the increment was larger at higher moisture contents than at lower moisture contents, the increase rates were smaller. An almost linear increase in ε′ and ε″ with an increase in temperature was also noted for other wheat straw samples. DENSITY-DEPENDENT DIELECTRIC PROPERTIES The effect of bulk density on the dielectric constant and loss factor of wheat straw samples at five moisture levels, 10 kHz, and 20°C is illustrated in figure 7. As expected, ε′ and ε″ increased monotonically with increasing bulk
56(3): 1069-1075
0
0
5
10
15
20
25
30
35
40
45
Temperature, oC
(b) Figure 6. Influence of temperature on dielectric (a) constant and (b) loss factor of wheat straw samples at 100 kHz at the indicated moisture contents and bulk densities.
density over the range of 47.3 to 108.1 kg m-3 at a given moisture content, temperature, and frequency. Since the relative dielectric constant of air is 1 and the value of the dry material of straw is 2 to 3, denser packing caused a reduction in porosity and an increase in the dielectric properties of the straw. In summary, the dielectric properties of wheat straw were frequency, moisture, temperature, and density dependent. MODELING AND MODEL EVALUATION The models describing the relationships between the permittivities and the moisture content, temperature, and bulk density of wheat straw at 10, 50, 100, 250, and 500 kHz were regressed. The results showed that all coefficients of determination (R2m) of the regression models were higher than 0.86, which indicated that ε′ and ε″ at selected frequencies had very good correlation with the variables of moisture, temperature, and bulk density of wheat straw. For ε′ and ε″, the models with the highest coefficients of determination were found at 10 kHz (R2m = 0.9937) and 500 kHz (R2m = 0.9866), respectively. These models are:
1073
100
120
Dielectric constant
80
60
Calculated dielectric constant
10.4% 12.8% 15.4% 17.9% 20.3%
40
20
0 40
50
60
70
80
90
100
100
R2=0.9959
80 60 40 20 0
110
0
Bulk density, kg m-3
20
40
60
80
100
120
Measured dielectric constant
(a)
(a)
300
25 Dielectric loss factor
200
Calculated dielectric loss factor
10.4% 12.8% 15.4% 17.9% 20.3%
250
150 100 50 0 40
50
60
70
80
90
Bulk density, kg m
100
110
2
R =0.9925
15 10 5 0
120
-3
0
(b) Figure 7. Influence of bulk density on dielectric (a) constant and (b) loss factor of wheat straw samples at the indicated moisture levels, 10 kHz, and 20°C.
′ ε10kHz = −151.1 + 11.2W + 1.55T + 4.50ρ −0.0845WT − 0.292W ρ − 0.0376T ρ +0.191W 2 + 4.30 × 10⁻³ T 2 − 0.0353ρ2 +1.48 × 10⁻³WT ρ + 1.04 × 10⁻³W 2T +0.0101W 2 ρ − 3.88 × 10⁻⁴ WT 2
(5)
+3.07 × 10⁻⁴ W ρ2 + 2.23 × 10⁻⁵ T 2ρ +1.63 × 10⁻⁴ T ρ2 − 8.82 × 10⁻³W 3 −7.98T 3 + 1.33 × 10⁻⁴ ρ3 ′′ ε500kHz = −64.6 + 4.98W + 0.584T + 1.80ρ −0.0377WT − 0.0736W ρ − 0.0116T ρ −0.181W 2 + 1.76 × 10⁻⁴ T 2 − 0.0181ρ2 +4.22 × 10⁻⁴ WT ρ + 6.66 × 10⁻⁴ W 2T +2.45 × 10⁻³W 2 ρ − 4.20 × 10⁻⁵ WT 2 +4.90 × 10⁻⁵ W ρ2 + 1.24 × 10⁻⁵ T 2ρ +4.62 × 10⁻⁵ T ρ2 + 6.78W 3 −4.83 × 10⁻⁶ T 3 + 7.77 × 10⁻⁵ ρ3
1074
20
(6)
5
10
15
20
25
Measured dielectric loss factor
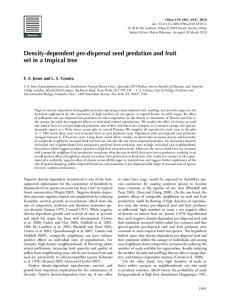
(b) Figure 8. (a) Measured dielectric constant against calculated values at 10 kHz using equation 5 and (b) measured dielectric loss factor against calculated values at 500 kHz using equation 6 with 88 measurements.
where W is moisture content (10.4% w.b. ≤ W ≤ 20.4% w.b.), T is temperature (5°C ≤ T ≤ 40°C), and ρ is bulk density (47.2 kg m-3 ≤ ρ ≤ 108.1 kg m-3). The ANOVA results for equations 5 and 6 showed that, except for the terms T2, W2T, WT2, Wρ2, T2ρ, W3, and T3, all terms influenced these models at a 0.005 significant level, and most terms had strong influence at a 0.0001 significant level. These models were significant at a 0.0001 level. Figure 8 shows the measured ε′ against the calculated values at 10 kHz using equation 5 (fig. 8a) and the measured ε″ against the calculated values at 500 kHz using equation 6 (fig. 8b) with known moisture content, temperature, and bulk density based on 88 measurements of randomly prepared wheat straw samples. The linear coefficients of determination between the measured permittivities and the calculated values were 0.9959 for ε′ (fig. 8a) and 0.9925 for ε″ (fig. 8b). These results demonstrate that the regression equations can accurately describe the relationships between the dielectric permittivities, moisture content, temperature, and bulk density of wheat straw. In other words, the moisture content of wheat straw could be predicted from the obtained permittivities, temperature, and bulk density by mathematical methods, such as Newton iteration, lookup table, etc.
TRANSACTIONS OF THE ASABE
CONCLUSIONS The dielectric constant and loss factor were both shown to be dependent on the moisture content (10% to 20% w.b.), temperature (5°C to 40°C), and bulk density (47.3 to 108.1 kg m-3) of wheat straw and the frequency (1 to 1000 kHz) of the electric field. Below about 500 kHz, the logarithmic dielectric constant and logarithmic loss factor had almost linear and negative relationships with logarithmic frequency. Both dielectric constant and loss factor increased with increasing moisture content, temperature, and bulk density, especially increasing almost linearly with temperature. At a given frequency, the moisture content, temperature, and bulk density were significant factors influencing the dielectric properties of wheat straw. Third-degree polynomial models were used to describe the relationships between the dielectric properties and moisture content, temperature, and bulk density at selected frequencies. The regression models were found to be accurate in calculating the dielectric properties of wheat straw from a given moisture content, temperature, and bulk density. If the dielectric properties, temperature, and bulk density are known, then the moisture content of straw could be determined. The study provides basic data for developing a wheat straw moisture meter based on dielectric properties. ACKNOWLEDGEMENTS This research was supported by a grant from the Chinese Universities Scientific Fund (ZD2012017, Northwest A&F University).
REFERENCES ASAE Standards. 2005. S358.2: Moisture measurement⎯Forages. St. Joseph, Mich.: ASABE. Berbert, P. A., D. M. Queiroz, E. F. Sousa, M. B. Molina, E. C. Melo, and L. R. D. Faroni. 2001. Dielectric properties of parchment coffee. J. Agric. Eng. Res. 80(1): 65-80. Fagan, C. C., C. Everard, C. P. O’Donnell, G. Downey, and D. J. O’Callaghan. 2005. Prediction of inorganic salt and moisture content of process cheese using dielectric spectroscopy. Intl. J. Food Prop. 18(3): 543-557. Guo, W., G. Tiwari, J. Tang, and S. Wang. 2008. Frequency, moisture, and temperature dependent dielectric properties of chickpea flour. Biosystems Eng. 101(2): 217-224. Guo, W., S. Wang, G. Tiwari, J. A. Johnson, and J. Tang. 2010a. Temperature and moisture dependent dielectric properties of legume flour associated with dielectric heating. LWT - Food Sci. Tech. 43(2): 193-201. Guo, W., X. Zhu, H. Liu, R. Yue, and S. Wang. 2010b. Effects of milk concentration and freshness on microwave dielectric properties. J. Food Eng. 99(2): 344-350. Guo, W., X. Zhu, Y. Liu, and H. Zhuang. 2010c. Sugar and water contents of honey with dielectric property sensing. J. Food Eng. 97(2): 275-281. Guo, W., J. Wang, and C. Liu. 2012. Predicating moisture content of pearl barley based on dielectric properties. Trans. CSAM 43(3): 138-142 (in Chinese with English abstract).
56(3): 1069-1075
Jiao, S., J. A. Johnson, J. Tang, G. Tiwari, and S. Wang. 2011. Dielectric properties of cowpea weevil, black-eyed peas, and mung beans with respect to the development of radio-frequency heat treatments. Biosystems Eng. 108(3): 280-291. Ko, R. S., and G. C. Zoerb. 1970. Dielectric constant of wheat straw. Trans. ASAE 13(1): 42-45. Lawrence, K. C., and S. O. Nelson. 1993. Radio-frequency densityindependent moisture determination in wheat. Trans. ASAE 36(2): 477-483. Lawrence, K. C., S. O. Nelson, and A. W. Kraszewski. 1990. Temperature dependence of the dielectric properties of wheat. Trans. ASAE 33(2): 535-540. Lawrence, K. C., S. O. Nelson, and A. W. Kraszewski. 1992. Temperature dependence of the dielectric properties of pecans. Trans. ASAE 35(1): 251-255. Lawrence, K. C., S. O. Nelson, and J. P. G. Bartley. 1998. Measuring dielectric properties of hard red winter wheat from 1 to 350 MHz with a flow-through coaxial sample holder. Trans. ASAE 41(1): 143-150. Lawrence, M., A. Heath, and P. Walker. 2009. Determining moisture levels in straw bale construction. Construction and Building Mater. 23(8): 2763-2768. Mo, X., E. Cheng, D. Wang, and X. S. Sun. 2003. Physical properties of medium-density wheat straw particleboard using different adhesives. Ind. Crops and Products 18(1): 47-53. Nelson, S. O., 1981. Frequency and moisture dependence of the dielectric properties of chopped pecans. Trans. ASAE 24(6): 15731576. Nelson, S. O., and P. G. Bartley Jr. 2000. Measuring frequency- and temperature-dependent dielectric properties of food materials. Trans. ASAE 43(6): 1733-1736. Nelson, S. O., and L. E. Stetson. 1976. Frequency and moisture dependence of the dielectric properties of hard red winter wheat. J. Agric. Eng. Res. 21(2): 181-192. Nelson, S., and S. Trabelsi. 2006. Dielectric spectroscopy of wheat from 10 MHz to 1.8 GHz. Meas. Sci. and Tech. 17(8): 2294-2298. Sacilik, K., and A. Colak. 2010. Determination of dielectric properties of corn seeds from 1 to 100 MHz. Powder Tech. 203(2): 365-370. Sokhansanj, S., and S. O. Nelson. 1988. Dependence of dielectric properties of whole-grain wheat on bulk density. J. Agric. Eng. Res. 39(3): 173-179. Trabelsi, S., and S. O. Nelson. 2004. Calibration methods for nondestructive microwave sensing of moisture content and bulk density of granular materials. Trans. ASAE 47(6): 1999-2008. Trabelsi, S., and S. O. Nelson. 2006. Nondestructive sensing of bulk density and moisture content in shelled peanuts from microwave permittivity measurements. Food Control 17(4): 304-311. Wang, D., and X. S. Sun. 2002. Low-density particleboard from wheat straw and corn pith. Ind. Crops and Products 15(1): 43-50. Wang, Y.-J., Y.-Y. Bi, and C.-Y. Gao. 2010. The assessment and utilization of straw resources in China. Agric. Sci. in China 9(12): 1807-1815. Yang, Y. B., R. Newman, V. Sharifi, J. Swithenbank, and J. Ariss. 2007. Mathematical modelling of straw combustion in a 38 MWe power plant furnace and effect of operating conditions. Fuel 86(12): 129-142.
1075