Published in Photonics, vol. 3, issue 3, no 47, 2016 which should be used for any reference to this work
hv
photonics
Article
Frequency Tuning and Modulation of a Quantum Cascade Laser with an Integrated Resistive Heater Kutan Gürel 1 , Stéphane Schilt 1, *, Alfredo Bismuto 2 , Yves Bidaux 2 , Camille Tardy 2 , Stéphane Blaser 2 , Tobias Gresch 2 and Thomas Südmeyer 1 1 2
*
Laboratoire Temps-Fréquence, Institut de Physique, Université de Neuchâtel, CH-2000 Neuchâtel, Switzerland;
[email protected] (K.G.);
[email protected] (T.S.) Alpes Lasers SA, CH-2072 Saint-Blaise, Switzerland;
[email protected] (A.B.);
[email protected] (Y.B.);
[email protected] (C.T.);
[email protected] (S.B.);
[email protected] (T.G.) Correspondence:
[email protected]; Tel.: +41-032-718-2917
Received: 23 June 2016; Accepted: 26 July 2016; Published: 30 July 2016
Abstract: We present a detailed experimental investigation of the use of a novel actuator for frequency tuning and modulation in a quantum cascade laser (QCL) based on a resistive integrated heater (IH) placed close to the active region. This new actuator is attractive for molecular spectroscopy applications as it enables fast tuning of the QCL wavelength with a minor influence on the optical output power, and is electrically-controlled. Using a spectroscopic setup comprising a low-pressure gas cell, we measured the tuning and modulation properties of a QCL emitting at 7.8 µm as a function of the active region and IH currents. We show that a current step applied to the IH enables the laser frequency to be switched by 500 MHz in a few milliseconds, as fast as for a step of the current in the active region, and limited by heat dissipation towards the laser sub-mount. The QCL optical frequency can be modulated up to ~100 kHz with the IH current, which is one order of magnitude slower than for the QCL current, but sufficient for many spectroscopic applications. We discuss the experimental results using a thermal model of the heat transfer in terms of cascaded low-pass filters and extract the respective cut-off frequencies. Finally, we present a proof-of-principle experiment of wavelength modulation spectroscopy of a N2 O transition performed with a modulation of the IH current and show some potential benefits in comparison to QCL current modulation, which results from the reduced associated amplitude modulation. Keywords: quantum cascade laser; frequency tuning; modulation spectroscopy
1. Introduction Quantum cascade lasers (QCLs) [1] are widely used in high resolution molecular spectroscopy and trace gas sensing applications in the mid-infrared spectral region owing to their unique spectral and wavelength tuning properties. QCLs can be designed to emit in a broad wavelength region ranging from below 4 µm to more than 10 µm based on the mature InP semiconductor material. Singlemode continuous wave operation with output powers reaching more than 100 mW is routinely achieved nowadays at room temperature using a distributed feedback (DFB) grating [2], or by placing the QCL chip in an external cavity configuration [3]. QCLs can be continuously tuned in wavelength through their temperature or injection current. Temperature tuning is rather slow as the QCL temperature is generally controlled with a thermo-electrical cooler (TEC) through a fairly massive sub-mount. However, with a typical temperature-tuning coefficient of (∆ν/ν)/T « 10´4 K´1 corresponding to ~3 GHz/K in the wavelength range of 8 µm, a large tuning range can be achieved by varying the QCL temperature with a moderate change of the optical output power. Temperature tuning is, thus, mainly used for large but slow frequency sweeping. On the other hand, the QCL wavelength can Photonics 2016, 3, 47; doi:10.3390/photonics3030047
www.mdpi.com/journal/photonics
Photonics 2016, 3, 47
2 of 12
be rapidly changed with the injection current, at frequencies exceeding 100 kHz [4]. However, the tuning range is limited and current modulation induces a significant change of the emitted optical power. QCL current modulation is widely used in sensitive spectroscopic techniques for trace gas sensing like wavelength/frequency modulation spectroscopy (WMS/FMS) [5,6] or photoacoustic spectroscopy (PAS) [7]. Each of these techniques involves a modulation of the laser wavelength and a harmonic demodulation of the output signal detected after light-gas interaction (optical signal in WMS or acoustic signal in PAS). A derivative-like signal of the gas absorption feature is thus obtained, which is used to quantify the gas concentration. However, the strong variation in the optical power induced by the QCL current modulation leads to residual amplitude modulation (RAM). This RAM can distort the harmonic signals of a gas absorption line, in particular by inducing an offset in the first harmonic signal (1f detection) that can be detrimental in some applications, for instance when using this signal as an error signal in a feedback loop to stabilize a laser at the center of a molecular or atomic transition. RAM also results in an asymmetry of the second harmonic signal (2f detection) of a gas absorption line. A novel tuning actuator in QCLs was recently developed by Alpes Lasers. It consists of a small heating element incorporated next to the active region of DFB QCLs [8]. This integrated heater (IH) is a resistive element driven by an electrical current, which heats the laser via Joule’s dissipation. This novel design allows the temperature of the active region to be varied much faster than by direct temperature control with a TEC, with a reduced associated change in optical power compared to QCL current modulation. These properties make this new tuning actuator attractive for gas phase spectroscopy applications. The IH current also constitutes a novel channel to apply fast corrections for frequency stabilization and noise reduction in a QCL. Electrical feedback applied to the QCL current is the standard approach to stabilize a QCL to an optical reference, such as a molecular transition or the resonance of an optical cavity, where an error signal proportional to the QCL frequency fluctuations is generated. However, other methods have been demonstrated for frequency noise reduction in QCLs that circumvent the use of an optical reference by exploiting the correlation observed between fluctuations of the optical frequency and of the voltage between the QCL terminals [9]. Using the QCL voltage noise as an error signal to reduce the frequency noise requires another actuator that enables fast internal temperature corrections to be applied to the QCL. The reason is that temperature variations were identified to be the major contribution in the conversion of the terminal voltage noise into frequency noise in QCLs [9]. Such a correction signal cannot be applied directly to the QCL current, as it would simply transpose the QCL voltage noise into current noise without significantly changing the fluctuations of the electrical power dissipated in the laser that are responsible for the frequency noise. Therefore, a fast control of the internal temperature of a QCL for noise reduction was implemented by Tombez et al. by illuminating the top surface of the QCL with a near-infrared laser radiation that could be quickly modulated [10]. A feedback bandwidth in the range of 300 kHz was, thus, obtained. Another approach reported by Sergachev et al., consisted of driving the QCL at constant electrical power instead of constant current, which was realized using fast signal processing of the measured voltage noise [11]. The novel actuator based on an IH is attractive for the realization of such noise reduction loops in a significantly simpler and more compact implementation. However, prior to this, a first step consists in properly characterizing the properties of this new IH actuator. In this article, we present a detailed characterization of the modulation properties of such new IH in a QCL emitting at 7.8 µm. The reported characterization includes the tuning coefficients, frequency modulation transfer function, as well as the step response. As an example of applications that can benefit from this new actuator, we present a proof-of-principle experiment of WMS of N2 O using a modulation of the IH current, and compare it to the standard approach of injection current modulation.
Photonics 2016, 3, 47
3 of 12
Photonics 2016, 3, 47
3 of 12
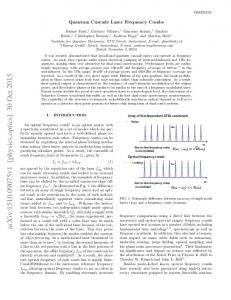
2. Materialsand andMethods Methods 2. Materials The by by Alpes Lasers incorporates an integrated resistiveresistive heater, asheater, described The QCL QCLmanufactured manufactured Alpes Lasers incorporates an integrated as by Bismuto et al. [8]. The laser is a buried-heterostructure DFB-QCL with a width of the active described by Bismuto et al. [8]. The laser is a buried-heterostructure DFB-QCL with a width region of the of 10.3region µm and a length of 2.25 mm. of The integrated has heater a thickness 2 µm and width active of 10.3 m and a length 2.25 mm. The heater integrated has a of thickness of 2a m andofa 8width µm, and is located at a distance of ~1 µm from the active region. The QCL emits in the spectral of 8 m, and is located at a distance of ~1 m from the active region. The QCL emits in the ´1 within a temperature range of 0 ˝ C to 45 ˝ C and delivers up to range between 1273 and1273 1278and cm1278 spectral range between cm−1 within a temperature range of 0 °C to 45 °C and delivers 80 mW of output power. It was mounted on aon copper sub-mount housed in ainmodified version of up to 80 mW of output power. It was mounted a copper sub-mount housed a modified version the laser laboratory housing (LLH) of Alpes Lasers, which accommodated the additional electrical of the laser laboratory housing (LLH) of Alpes Lasers, which accommodated the additional electrical connections to drive drive the the IH. IH. The at the connections to The laser laser and and the the IH IH share share aa common common electrical electrical potential potential at the laser laser cathode, as shown in Figure 1a, and were driven by two separate home-made low-noise current cathode, as shown in Figure 1a, and were driven by two separate home-made low-noise current sources upup to to 1 A1 and have a noise spectral density lowerlower than sources [9]. [9]. These Thesedrivers driverscan candeliver delivera acurrent current A and have a noise spectral density 1/2 1than nA/Hz at1/2Fourier frequencies higher thanthan 1 kHz. ThisThis feature generally enables accessing the 1 nA/Hz at Fourier frequencies higher 1 kHz. feature generally enables accessing frequency noise inherent to a QCL itself, without technical limitation resulting from the QCL current the frequency noise inherent to a QCL itself, without technical limitation resulting from the QCL source The[12]. IH has nearly response, as shownas in shown Figure 1b, with an1b, assessed current[12]. source Thea IH has ohmic a nearly ohmic response, in Figure with anresistance assessed of ~9 Ω that is almost independent of temperature. The QCL temperature was regulated at the mK resistance of ~9 Ω that is almost independent of temperature. The QCL temperature was regulated at level with a double-stage TEC and a negative thermal coefficient (NTC) resistor as temperature sensor, the mK level with a double-stage TEC and a negative thermal coefficient (NTC) resistor as controlled bysensor, a home-made temperature regulator. temperature controlled by a home-made temperature regulator.
Figure 1. 1. (a) Electrical connection Figure (a) Electrical connection scheme scheme of of the the QCL QCL with with IH IH with with their their respective respective current current source; source; (b) current-voltage response of the IH at a sub-mount temperature of 25 °C. The data points ˝ (b) current-voltage response of the IH at a sub-mount temperature of 25 C. The data points (light(light blue) blue) areapproximated well approximated theohmic pure ohmic response described the dashed darkline. blue line. are well by theby pure response described by theby dashed dark blue
The frequency tuning, impulse response and modulation transfer function of the laser were The frequency tuning, impulse response and modulation transfer function of the laser were measured using a spectroscopic set-up that involved a 10-cm long low-pressure gas cell filled with a measured using a spectroscopic set-up that involved a 10-cm long low-pressure gas cell filled with nominal pressure of 10 mbar of pure N2O. However, the imperfect tightness of the cell induced a a nominal pressure of 10 mbar of pure N2 O. However, the imperfect tightness of the cell induced contamination by air at a total pressure of ~70 mbar (see Section 3.1), which broadened the a contamination by air at a total pressure of ~70 mbar (see Section 3.1), which broadened the absorption absorption lines. The tuning coefficients as a function of temperature, injection current and IH lines. The tuning coefficients as a function of temperature, injection current and IH current were current were obtained by performing a large frequency scan with each actuator and comparing the obtained by performing a large frequency scan with each actuator and comparing the position of position of several N2O absorption lines to their reference frequency extracted from the HITRAN several N2 O absorption lines to their reference frequency extracted from the HITRAN database [13]. database [13]. The frequency modulation (FM) response of the QCL was measured by tuning the The frequency modulation (FM) response of the QCL was measured by tuning the laser to the side of laser to the side of an absorption line used as a frequency discriminator that linearly converted the an absorption line used as a frequency discriminator that linearly converted the frequency modulation frequency modulation of the laser (induced by a small modulation of the injection current or of the of the laser (induced by a small modulation of the injection current or of the IH current) into intensity IH current) into intensity modulation that was detected with a photodiode (PVI-4TE-5 from Vigo, modulation that was detected with a photodiode (PVI-4TE-5 from Vigo, Ozarow Mazowiecki, Poland, Ozarow Mazowiecki, Poland, with a bandwidth of 100 MHz). The resulting intensity modulation with a bandwidth of 100 MHz). The resulting intensity modulation was measured in amplitude and was measured in amplitude and phase using a lock-in amplifier and converted into frequency phase using a lock-in amplifier and converted into frequency modulation using the measured slope of modulation using the measured slope of the absorption line (see Figure 2). the absorption line (see Figure 2). Finally, the applicability of the IH for spectroscopy applications was evaluated by the Finally, the applicability of the IH for spectroscopy applications was evaluated by the measurement of the first harmonic WMS signal of a N2O transition obtained by modulating either measurement of the first harmonic WMS signal of a N2 O transition obtained by modulating either the the IH current or the QCL current at the same frequency of 25 kHz and at different IH or QCL currents. IH current or the QCL current at the same frequency of 25 kHz and at different IH or QCL currents.
Photonics 2016, 3, 47 Photonics 2016, 3, 47 Photonics 2016, 3, 47
4 of 12 4 of 12 4 of 12
Example ofNN 2O absorption line line used as aa frequency discriminator totomeasure the FMFM Figure Example Figure 2. 2. Figure 2. Example of of N22O O absorption absorption line used used as a frequency frequency discriminator discriminator to measure measure the the FM −1 −1 response of the QCL.The TheP11e P11eline lineof ofthe thevibrational vibrational band νν11 of N 2O atat1275.5 cm was used ´1 response of the QCL. band of N 2Olocated located 1275.5 cm response of the QCL. The P11e line of the vibrational band ν1 of N2 O located at 1275.5 cm was was used used in this case and is shown here. The absorption spectrum was measured by tuning the QCL or IHIH in this thiscase caseand andisis shown here. absorption spectrum measured by tuning theorQCL or in shown here. TheThe absorption spectrum was was measured by tuning the QCL IH current current and recordingthe thevoltage voltage of of the the photodiode photodiode at the output ofofthe reference gas The current and recording thecell. reference gascell. cell. The and recording the voltage of the photodiode at the outputatofthe the output reference gas The current axis was current axis was converted into a relative frequency using the separately measured tuning current axis was converted into a relative frequency using the separately measured tuning converted into a relative frequency using the separately measured tuning coefficient. The operating coefficient. The operating point is shown by the red circle and the linear range by the red line with a coefficient. Theby operating point and is shown by the red by circle point is shown the red circle the linear range theand red the linelinear with arange slopeby D.the red line with a slope D. slope D.
3. 3. Results Results 3. Results 3.1.3.1. Tuning Coefficients Tuning Coefficients 3.1. Tuning Coefficients The static tuning fromthe theposition positionofofvarious variousN2N The static tuningcoefficients coefficientsof ofthe the QCL QCL were were determined determined from O2 O The static tuning coefficients of the QCL were determined from the position of various N absorption lines measured during a scan (see Figure 3a) and plotted as a function of the reference absorption lines measured during a scan (see Figure 3a) and plotted as a function of the reference2O absorption lines measured during a scan (see Figure 3a) and plotted(T), asinjection a function of the reference frequency extracted from HITRAN database [13] temperature (T), injection current ) and QCL frequency extracted fromthe the HITRAN database [13] for for temperature current (I(I QCL ) and frequency extracted from the HITRAN database [13] for temperature (T), injection current (IQCL) and IH current (IIH ) tuning, respectively. IH current (IIH ) tuning, respectively. IH current (IIH) tuning, respectively.
Figure 3. (a) N2O absorption spectrum measured by tuning the QCL with the electrical power Figure 3. (a) N2 O absorption spectrum measured by tuning the QCL with the electrical power dissipated in the IH (bottom spectrum obtained at T = 25 ˝°C and IQCL = 450 mA) and corresponding dissipated in the IHabsorption (bottom spectrum obtained at T = C andthe IQCL = 450 mA)the and corresponding Figure 3. (a) N 2O spectrum measured by25tuning QCL with electrical power N2O absorption spectrum calculated from HITRAN database [13] for a N2O pressure of 10 mbar N O absorption spectrum calculated from HITRAN database [13] for a N O pressure of 10 mbar diluted dissipated in the IH (bottom spectrum obtained at T = 25 °C and IQCL =2 450 mA) and corresponding 2 diluted in air (total pressure of 70 mbar) over a pathlength of 10 cm (upper spectrum). The reference in (total pressure of 70 mbar) over a pathlength of 10database cm (upper spectrum). The reference spectrum N2air O absorption spectrum calculated HITRAN [13] N2O pressure 10 mbar spectrum is inverted for the clarity of from the figure. The total pressure infor theareference cell thatofresulted is inverted for(total the clarity of the figure. The total pressure in the reference cell that resulted from air diluted in air pressure of 70 mbar) over a pathlength of 10 cm (upper spectrum). The reference from air contamination arising from the imperfect cell tightness was estimated to be ~70 mbar from contamination arising from the imperfect cell tightness was estimated to be ~70 mbar from comparisons spectrum is inverted for measured the clarityand of the figure. The total(b) pressure in the reference cell that resulted comparisons between calculated spectra; corresponding static tuning curve as a between and calculated spectra; (b)experimental corresponding staticwas tuning curve as a be function of the IH from air measured contamination arising from the imperfect cell tightness estimated ~70 mbar from function of the IH current (green markers: points; red dashed line:toquadratic fit) and current (green markers: experimental points; redmarkers: dashed Experimental line: quadratic fit) and associated variation comparisons between measured and calculated spectra; (b) corresponding static tuning curve as a associated variation of the optical power (blue points; blue dashed line: 3rd of the optical power (blue markers: Experimental points; blue dashed line: 3rd order polynomial fit). function of the IH current (green markers: experimental points; red dashed line: quadratic fit) and order polynomial fit). The experimental data of the optical power were extracted from the measured The experimental data of the optical power were extracted from the measured transmission through the associated variation of the power (blue Experimental points; blue line: 3rd transmission through the optical N2O cell; the gaps in markers: the data result from the presence of Ndashed 2O absorption N O cell; thehave gapsbeen in the data result from the of N2 Opower absorption that have removed. 2lines that removed. order polynomial fit). The experimental datapresence of the optical were lines extracted frombeen the measured
transmission through the N2O cell; the gaps in the data result from the presence of N2O absorption
Tuning of the injection current or sub-mount temperature in a linear nearlyfrequency linear Tuning the QCL injection current or sub-mount temperature resultsresults in a nearly lines thatofhave beenQCL removed. frequency On the hand, tunes the frequency tunes quadratically withasthe IH current as3b, sweep. On thesweep. other hand, theother frequency quadratically with the IH current shown in Figure shown in Figure 3b, resulting from the Ohm’s law dependence. The quadratic response also shows Tuning theOhm’s QCL law injection currentThe or quadratic sub-mount temperature results a IH nearly linear resulting fromofthe dependence. response also shows thatinthe affects the frequency sweep. On the other hand, the frequency tunes quadratically with the IH current as shown in Figure 3b, resulting from the Ohm’s law dependence. The quadratic response also shows
Photonics 2016, 3, 47 Photonics 2016, 3, 47
5 of 12 5 of 12
that the IH affects the QCL frequency purely thermally through Joule’s dissipation. This leads to a Photonics 2016, 3, 47the laser frequency as a function of the electrical power dissipated in the5IH of 12that is linear response of QCL frequency purely thermally through Joule’s dissipation. This leads to a linear response of the displayed in Figure 4 in comparison withpower the temperature and QCL-current tuningincurves. The laser frequency as a function of the electrical dissipated in the IH that is displayed Figure that the IH affects the QCL frequency purely thermally through Joule’s dissipation. This leads to a 4 in assessed tuning coefficients are −2.9 GHz/K (vs temperature), −37 GHz/W (vs dissipated power in the comparison with the temperature and as QCL-current curves. Thedissipated assessedin tuning linear response of the laser frequency a function of tuning the electrical power the IHcoefficients that is active region from the QCL current) and −29 GHz/W (vs. dissipated power in the IH), respectively. The are ´2.9 GHz/K (vs temperature), ´37 with GHz/W (vs dissipated in the tuning active curves. region from displayed in Figure 4 in comparison the temperature and power QCL-current The the power tuningtuning coefficient for the isGHz/K slightly thanin forthe theIH), QCL current, as the heat dissipation assessed coefficients areIH −2.9 (vslower temperature), −37 GHz/W (vs dissipated power in the QCL current) and ´29 GHz/W (vs. dissipated power respectively. The power tuning occurs at a slightly larger distance from the active area, thus resulting in a lower heating of this latter active region from the QCL current) and −29 GHz/W (vs. dissipated power in the IH), respectively. The coefficient for the IH is slightly lower than for the QCL current, as the heat dissipation occurs at The corresponding thermal resistance th associated with heating theof laser active region power tuning coefficientfrom for the is slightly than for the current, asofthe heat dissipation aregion. slightly larger distance theIH active area,Rlower thus resulting inQCL athe lower heating this latter region. occurs at a slightly largerPresistance distance from active thus resulting a lower heating of this latter by the dissipated power was determined fromarea, the ratio of theinpower and temperature tuning The corresponding thermal Rththe associated with the heating of the laser active region by the region. The corresponding thermal resistance Rth associated with= the heating of the laser active region coefficients, R th = (Δν/ΔP)/(Δν/ΔT). It amounts to R th, QCL 12.8 (K/W) and R th, IH = 10 (K/W), dissipated power P was determined from the ratio of the power and temperature tuning coefficients, by the dissipated power P wasresulting determined from the ratio of theand power and temperature tuning respectively, for the heat sources QCL current R = (∆ν/∆P)/(∆ν/∆T). It amounts to R from the = 12.8 (K/W) and R IH current. = 10 (K/W), respectively, th coefficients, Rth = (Δν/ΔP)/(Δν/ΔT). It amounts th, QCL to Rth,
QCL
th, IHand Rth, = 12.8 (K/W)
for the heat sources resulting from resulting the QCLfrom current and IH current. respectively, for the heat sources the QCL current and IH current.
IH
= 10 (K/W),
Figure 4. Static tuning QCL measured measuredforfortemperature, temperature, QCL-current Figure 4. Static tuningcoefficients coefficients of of the the QCL QCL-current and and Figure 4. Static tuning coefficients of the QCL measured for temperature, QCL-current and IH-current IH-current tuning, respectively points; lines: Linear IH-current tuning, respectively(markers: (markers: Experimental Experimental points; lines: Linear fits).fits). tuning, respectively (markers: Experimental points; lines: Linear fits).
3.2. Tuning Speed 3.2. Tuning Speed 3.2. Tuning Speed tuning speed theQCL QCLhas has been been determined frequency stepstep response to a to a The The tuning speed of ofthe determinedfrom fromthethe frequency response change of the injection current, IH current, and temperature, respectively. For this measurement, Theoftuning speed of the QCL been and determined from the frequencyFor stepthis response to athe change change the injection current, IHhas current, temperature, respectively. measurement, the laser was tuned to the side of a N 2O absorption line, as illustrated in Figure 5. The optical power of the injection current, IH current, and temperature, respectively. For this measurement, the laser was laser was tuned to the side of a N2O absorption line, as illustrated in Figure 5. The optical power transmitted through theabsorption gas absorption cell was monitored on 5. anThe oscilloscopepower using transmitted a fast tuned to the side of a N2 O line, as illustrated in Figure transmitted through absorption cell monitored onfor antheoptical oscilloscope using a fast photodiode. A smallthe stepgas of current (1.2 mA forwas the QCL or 6.6 mA IH) or of temperature through the gas absorption cellcurrent was monitored an oscilloscope using fastthe photodiode. A small step photodiode. A small stepproducing of mA on for the QCL or 6.6 mA afor IH) or temperature (0.16 K) was applied, a (1.2 frequency change of approximately 500 MHz. Theoftemporal of current (1.2 mA for the QCL or 6.6 mA for the IH) or of temperature (0.16 K) was applied, producing (0.16evolution K) was of applied, producing frequency change ofinto approximately 500 MHz. The temporal the QCL frequency awas linearly converted a change of the transmitted optical aevolution frequency of 500 MHz.converted The temporal frequency was power of inchange the of approximately the absorption line. theside QCL frequency was linearly into evolution a change of of the theQCL transmitted optical linearly converted into a change of the transmitted optical power in the side of the absorption line. power in the side of the absorption line.
Figure 5. (a) Experimental principle of the QCL frequency step response measurement using an absorption line of N2O; (b) the side of the absorption profile (blue curve) corresponding to the P11e line5.of(a) N2O at 1275.5 cm−1 principle acts as a frequencyQCL discriminator (dashed red line) that linearly converts Figure frequency step response measurement using an Figure 5. (a)Experimental Experimental principleofofthe the QCL frequency step response measurement using the change of the laser frequency into a change of the transmitted optical power detected by a absorption line of N 2O; (b) the side of the absorption profile (blue curve) corresponding to the P11e an absorption line of N2 O;step (b) of the side of IH theorabsorption profile(from (blueIcurve) corresponding to the P11e photodiode. A current the QCL, TEC was applied 1 to I2, see inset) to produce an −1 acts as a frequency discriminator (dashed red line) that linearly converts line of of N N2O O at at1275.5 1275.5cm cm ´1 line acts as a frequency discriminator (dashed red line) that converts 2 exponential frequency change (schematized by the green line) of approximately 500linearly MHz that was the the change oflaser the frequency laser frequency into a of change of the transmitted optical power detected by a change of the into a change the transmitted optical power detected by a photodiode. recorded by an oscilloscope.
photodiode. A of current stepIH of or theTEC QCL, IHapplied or TEC (from was applied I1 to to I2, produce see inset)an toexponential produce an A current step the QCL, was I1 to I2 ,(from see inset) exponential frequency change (schematized by the green line) of approximately 500 MHz that was frequency change (schematized by the green line) of approximately 500 MHz that was recorded by recorded by an oscilloscope. an oscilloscope.
Photonics 2016, 3, 47 Photonics 2016, 3, 47
6 of 12
6 of 12
Photonics 3, 47 The2016, monitored
6 of 12 signals were recorded on the oscilloscope and are displayed in Figure 6 (for a The monitored signals were recorded on the oscilloscope and are displayed in Figure 6 (for temperature step) and in Figure 7 (for a step of the QCL or IH current). Here, the frequency change a temperature step) and in Figurerecorded 7 (for a step the QCL or IH current). Here, the frequency The monitored signals theofoscilloscope and in Figure 6 (for aa resulting from a step of thewere IH current is on nearly as fast as for a are stepdisplayed of the injection current: change resulting from a in step of the IH current isthe nearly as fast as for a Here, step of the injectionchange current: temperature step) and Figure 7 (for a step of QCL or IH current). the frequency frequency step of 500 MHz is achieved in a similar timescale of a few milliseconds. In comparison, a frequency step of 500 MHz is achieved in a similar timescale of a few milliseconds. In comparison, resulting from a control step of with the IH nearly as fast as fororders a step of of magnitude the injection current: the temperature thecurrent TEC isis approximately four slower. Thea thetemporal temperature control with the TEC is approximately four orders of magnitude slower. The temporal frequency step of 500 MHz is achieved in a similar timescale of a few milliseconds. In comparison, response observed for a temperature step applied to the QCL sub-mount is well response observed for a temperature step the QCL is~100 wells approximated the temperature with the TEC isapplied approximately foursub-mount orders ofofmagnitude slower. approximated by control a single exponential decay with to a long time constant (dashed lineThe inby temporal response observed for a temperature step applied to the QCL sub-mount is well a single exponential decay with a long time constant of ~100 s (dashed line in Figure 6). Figure 6). approximated by a single exponential decay with a long time constant of ~100 s (dashed line in Figure 6).
Figure 6. Temporal evolution of the QCL optical frequency measured for a step change of the TEC Figure 6. Temporal evolution of the QCL optical frequency measured for a step change of the TEC temperature of ~0.16 K, displayed in a semi-log scale. The inset shows a linear representation. The temperature of ~0.16 evolution K, displayed a semi-log scale. The inset shows a linear representation. Figure 6. Temporal of theinQCL frequency measured for aastep of of the~100 TECs experimental data are well approximated byoptical a single exponential decay with timechange constant Thetemperature experimental data are well approximated by a single exponential decay with a time constant of ~0.16 K, displayed in a semi-log scale. The inset shows a linear representation. The (dashed-dotted line). of ~100 s (dashed-dotted line). experimental data are well approximated by a single exponential decay with a time constant of ~100 s (dashed-dotted In contrast, theline). temporal response to a step of the QCL or IH current shows a very different In contrast, the response to a step of the from QCLaorsingle IH current shows a very different behavior (Figure 7) temporal characterized by a strong deviation exponential response, which In contrast, the temporal response to a step of the QCL or IH current shows a very different behavior (Figure 7) characterized by aconstants strong deviation fromina the single exponential response, which indicates that different thermal time are involved system. For a step of the QCL behavior 7) change characterized by constants a strong deviation from ainsingle exponential which current, a(Figure very fast of the optical frequency is first observed a time τ1