spheres with a random (Gaussian) distribution of summit heights but with a common radius. This is pushed into contact with a rigid flat surface and the number of ...
Friction in MEMS: From Single to Multiple Asperity Contact
1
1
1
Robert W. Carpick , Erin E. Flater , Jeffrey R. VanLangendon , Maarten P. de Boer 1 Department of Engineering Physics, University of Wisconsin-Madison 1500 Engineering Drive, Madison, WI 53706, USA 2 Sandia National Laboratories, Albuquerque, NM 87104, USA
2
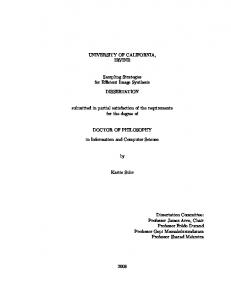
ABSTRACT We have studied the surface topography of polycrystalline silicon MEMS surfaces with a range of surface roughening treatments. We find that the atomic force microscope (AFM) resolves critical roughness features from the nm-to-µm scale. Controlled roughness of the lowest polysilicon layer is significantly transferred to subsequent layers. We derive surface roughness parameters from the AFM data and use a simple analytic model to estimate general contact properties of the MEMS interfaces. We find that the roughening procedure leads to smaller contact areas, but also to higher contact pressures that may approach yield values. This suggests that surface topographic design in MEMS should integrate surface imaging at the nanometer scale and contact asperity modeling in order to predict optimal surface preparations that minimize adhesion, friction, and wear. INTRODUCTION Microelectromechanical systems (MEMS) are in use or are being considered for many commercial products including accelerometers [1], gyroscopes [2], optical switches [3] and medical devices [4]. Surface micromachined MEMS with structural members of one-micrometer minimum dimension, can be fabricated in large quantities at low cost and do not require assembly. Polycrystalline silicon (polysilicon) is the material of choice in surface micromachined MEMS because of its high strength, low residual stress, and because complicated multi-level structures can be successfully fabricated [5]. Most commercially available MEMS operate without allowing contact between moving structures. However, if contact were allowed, many more MEMS applications could be brought to market. Possible applications of MEMS that would allow contact between surfaces include gears and transmissions [6] as in Fig. 1(a), mechanical discriminators, pop-up mirrors and digital mirrors [7]. Their market entry is hampered by critical operational reliability concerns such as adhesion, friction, and wear-related failures. Adhesive and frictional forces are relatively large at the micron scale because the surface-tovolume ratio increases as geometry decreases. Mechanical restoring forces diminish significantly because they scale with the cube of the dimension, and are hence not always able to overcome adhesive forces. Electrostatic actuators that induce motion are relatively weak, and therefore it is desirable to minimize frictional forces. In spite of the weak
(a)
(b)
Figure 1. (a) Advanced MEMS have numerous contacting and sliding interfaces that can be subject to a range of loads. (b) SEM image of wear debris in the ~10 µm receiver hole for a failed drive gear of a Si-MEMS device (from ref. [9]). forces, apparent operating pressures can be high because of the small contact areas involved. Indeed, depending on the device design and operating conditions, they may range from ~1 kPa to ~1 GPa. Furthermore, although polysilicon is strong, its bulk tribological properties are poor [8]. In particular, its fracture toughness is low. This makes it susceptible to wear which is an important mode of failure. Sub-micron wear particles can encumber motion. Also wear can proceed to the point that the structure fractures. An example is shown in Fig. 1(b), in which wear processes have thinned a pin joint until the point of fracture [9]. Using MEMS devices, the tribological properties of micronscale polysilicon have been investigated and reported in several studies. For example, friction and significant wear have been observed in wobble motors [10] and microengines [9,11]. However, in these designs, contacting surfaces are not held parallel during operation, and therefore the load is borne by a very small nominal contact area. It is also possible that during operation contact is not maintained in such designs, and therefore impact forces may also play a role in the wear processes. These issues can be addressed by MEMS test structures designed for the special purpose of measuring friction. For example, the coefficient of friction on horizontal (i.e. as-deposited) polysilicon surfaces and on vertical (i.e. etched sidewall) surfaces was measured at ~0.1 [12]. The two surface pairs were built side-by-side, and both were coated by monolayer coupling agents (octacdecyltrichlorosilane and perflurotrichlorsilane). The wear rate on the vertical surfaces was significant, and this was attributed to a large operating pressure (100 MPa). However, only impact testing was done on the horizontal
element modelers we are working with who wish to address the issues of local pressure and the relative importance of frictional versus mechanical interlocking forces. We also plan to measure friction in a series of MEMS friction test structures we are developing in which pressure is uniformly applied over a range from 0.1 MPa to 100 MPa. One such structure is an inchworm actuator described in ref. [19]. SAMPLE PREPARATION
Figure 2 (a) ground plane polysilicon (poly 0) oxidation (b) cantilever fabrication, (c) after release and drying surfaces, which were tested at ~25 kPa. Also, the topography of these surface pairs was quite different, and in detail neither surface pair achieved a true uniform pressure distribution. While refs. [9-12] and other studies (e.g., [13,14]) have provided valuable information on friction and wear in MEMS, more systematic studies of the role of surface topography and surface chemistry, as well as improved friction test structure design, are needed to advance our understanding of friction in MEMS. Surface roughness is an important parameter that affects the frictional and wear properties of bulk materials [15]. Because of the planar deposition technology, horizontal (i.e. asdeposited or annealed) polysilicon surfaces are quite smooth, with typical root mean square (RMS) surface roughness values of just a few nanometers. If surface textures are properly tailored and pressures are well controlled, it is conceivable that deformations will be largely elastic, and hence wear can be minimized. On the other hand, polysilicon asperities are highly curved, and so it may be difficult to avoid locally exceeding the hardness of polysilicon, 11 GPa [16]. Although surface roughness in MEMS has been discussed to some extent [17], we do not know of any studies that have integrated detailed topography measurements of MEMS surfaces to model true pressures. In this study, we characterize by atomic force microscopy (AFM) the surface topography of polysilicon surfaces roughened to various degrees. We use the data to characterize the surface topography by the GreenwoodWilliamson model [18]. The data will also be of use to finite
(a)
(b) 2
2
Figure 3. 10 x 10 µm (a) and 1 x 1 µm (b) topographic images of the Poly0 surface. The z-height range is 35 and 20 nm, respectively.
We used existing cantilever samples to study the surface roughness. Such samples consist of the same surfaces that we will use in our upcoming MEMS test structure friction studies, but could be fabricated in a much shorter time. Those surfaces are the top of a lower lying ground plane polysilicon, and the bottom of an upper polysilicon cantilever. The cantilevers were fabricated according to a three mask level process, schematically represented in Fig. 2. Texturing of the lower layer of polysilicon (300 nm thickness, “Poly0” in Fig. 2(a)) was accomplished by thermal oxidation in dry O2 at 900 C for increasing times. Table I indicates the times and 2 the RMS roughness as measured by several 10x10 µm AFM images of the samples. The texturing occurs because the grains are randomly oriented, and dry oxidation in the linear regime proceeds at different rates on different orientations of silicon [20]. Also, the grain boundaries are enhanced at increasing oxidation times, giving rise to grooves. These do not contribute significantly to the desired texturing because they comprise a small percentage of the surface area, and extend below the surface. A wet chemical etching process whereby the oxide is removed follows the oxidation step, exposing the textured surfaces. Standard deposition, lithography and etch techniques were used to fabricate the cantilevers (Fig. 2(b)), to form the upper layer of polysilicon (2500 nm thickness, “Poly 1/2” in Fig. 2(b)). They are supported on the left in Fig. 2 by a step-up support post, formed by filling a hole etched into the sacrificial oxide layer. A critical step is the release and drying of the cantilevers (Fig. 2(c)). We used two procedures: (1) supercritical carbon dioxide drying [21], and (2) a solventbased coating in which a self-assembled monolayer of perfluorodecyltrichlorosilane (FDTS, C8F17C2H4SiCl3) is applied, similar to ref. [22]. Surfaces produced using both types of finishing steps were examined and unless otherwise noted, results did not exhibit any significant dependence on the choice of release and drying procedure.
(a)
(b) 2
2
Figure 4. 10 x 10 µm (a) and 1 x 1 µm (b) topographic images of the oxidized and etched Poly0 surface. The zheight ranges are 100 and 50 nm, respectively.
(a)
(b) 2
2
Figure 5. 10 x 10 µm (a) and 1 x 1 µm (b) topographic images of the Poly1/2 surface counterpart to the unoxidized Poly0. The z-height ranges are 35 and 20 nm, respectively. Below are 3-D renderings of (a) and (b).
(a)
(b) 2
2
Figure 6. 10 x 10 µm (a) and 1 x 1 µm (b) topographic images of the Poly1/2 surface counterpart to the oxidized and etched Poly0. The z-height ranges are 100 and 50 nm, respectively. Below are 3-Drenderings of (a) and (b).
2
SURFACE TOPOGRAPHY CHARACTERIZATION The surfaces were studied to evaluate the geometry of contacting MEMS surfaces. The surface topography was measured using a Digital Instruments Nanoscope IV AFM with a silicon nitride AFM cantilever. The tip shape was tested before and after the measurements using in-situ tip imaging samples (Aurora Nanodevices, Edmonton, Canada) to ensure that it started and remained a sharp, single protrusion so as to minimize the effect of convolution of tip shape [23]. Numerous tips with blunt (>40 nm curvature radius), multiple, or asymmetric terminations were rejected. For measurements of Poly0 regions, the AFM tip was positioned over an exposed Poly0 region. Beams were then peeled off using an adhesive and placed facing underside up on an AFM sample holder to examine the underside of the Poly1/2 cantilever beams. Figs. 3 and 4 are topographic AFM images of the Poly0 layer for the two extreme cases of no oxidation and 400 minutes of oxidation respectively. Dark/bright correspond to low/high regions. The grain boundaries are clearly seen and reveal that the grains typically range in size from 50-500 nm laterally, with irregular boundaries. The oxidized sample exhibits deeper, wider grain boundaries as expected. The tops of grains have some intrinsic roughness, but overall roughness results from height differences between the grains, particularly for the oxidized sample. The height range of the tops of the grains is approximately 30 nm for the unoxidized sample and 80 nm for the oxidized sample. To characterize this more generally, the RMS roughness Rq was measured at different length scales for all
four oxidation times (Table I). For a 10x10 µm area, R q depends nearly linearly on Table I oxidation time, indicating the roughening effect of the Oxidation RMS oxidation and etching Time (min) Roughness process. However, at the 2 (nm) 100x100 nm scale with roughness measured on top 0 3.06 of an individual grain, Rq had no dependence on oxidation 20 5.11 time, being ~0.8 nm. 136 6.72 The highest grains will 400 11.5 obviously be the ones that first come into contact with the countersurface, although if wear occurs, lower grains may eventually come into contact. Therefore, we measured the intragranular roughness on both high and low grains to check for any changes as a function of grain height. Three of the highest and lowest grains were selected from the sample oxidized for 400 minutes to examine the extreme case. For each grain a series of images were acquired and roughness measurements carried out. The roughness was measured to be 0.75±0.12 nm and 0.87±0.39 nm for the highest and lowest grains respectively, where the error is given by the standard deviation of the measurements. Therefore, within error, the roughness on high and low grains is indistinguishable. The Poly1/2 layers were observed to have substantially different topographic features. Figs. 5 and 6 are topographic AFM images of the Poly1/2 underside, again for the two extreme cases of no oxidation and 400 minutes of oxidation respectively. The topography consists of two predominant features: small grains that are apparently the intrinsic grain
structure of the Poly1/2, and larger pits that appear to be a result of a conformal growth process. The pronounced nature of these latter features was not expected. The Poly0 grain roughness has been partially transferred through the sacrificial oxide, upon which the Poly1/2 layer was grown. Consistent with this, the pits in the Poly1/2 layer become larger with increasing oxidation time as seen by comparing Figs. 5 and 6. As well, the pits are seen to have a distribution that is similar in nature to the grain height distribution seen in Figs. 3 and 4 respectively. The pits in the Poly1/2 surface are more rounded than the grains of the Poly0 surface, which is a natural consequence of the expected reduction in feature definition that would occur when the oxide is grown on the Poly0. The underside of the cantilevers is therefore quasi-conformal with the Poly0, with these quasi-conformal surfaces separated by a 2 µm gap.
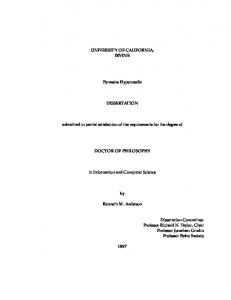
Figure 7. A rough surface (z-scale greatly exaggerated) with a flat rigid surface approaching from above (thick solid line). The undeformed surface is shown, where the shaded asperities would be deformed. At left is the height distribution function for the summits (solid line) and for the entire surface (dashed line). d represents the spacing between the summit mean plane and the approaching surface. The rigid surface is replaced by a rough deformable surface for our analysis.
DISCUSSION - CONTACT MODELING
m0 = z 2 , m2 =
Roughness is a key issue in tribological modeling. Even a small degree of roughness like that found for our surfaces will ensure that the true and apparent contact areas at an interface are vastly different. Reliable models of friction and wear require knowledge of the true contact area and local contact pressures at an interface [24,25]. A first step in developing sophisticated models of contact for evaluating MEMS surfaces is by using basic analytic approaches. The roadmap for such an approach was first provided by the Greenwood-Williamson (GW) model[18]. This has been followed by other more recent efforts that take into account adhesion, wear, and asperity shape changes [26-32]. We provide here an evaluation of the GW model applied to the MEMS surface topographies presented in Figs. 3-6 as an example of applying the most basic assumptions of rough contact. The surfaces shown in Figs. 3-6 are the two faces that will come into contact when the cantilever makes contact with the surface underneath, such as in an adhesion or friction test. To carry out this analysis we follow the treatment of McCool [33], who showed how to convert surface topographic measurements to appropriate input parameters for the GW model (as modified by Nayak [34]). The GW model assumes that the surface is composed of spheres with a random (Gaussian) distribution of summit heights but with a common radius. This is pushed into contact with a rigid flat surface and the number of contacts, total contact area, total load and asperity pressure ranges (including the fraction of asperities beyond a yield pressure) are calculated (Fig. 7). However, some adjustments to the GW model are required. Longuet-Higgins [35] showed that for a Gaussian distribution of surface heights, the distribution of summit heights is not itself Gaussian. Furthermore, the curvature of higher summits is generally higher (i.e. sharper) than for lower summits. Nayak [34] provided a model that takes these factors into account including the fact that asperities may be elliptical in nature. Finally, having both surfaces be rough and elastic instead of just one can be taken into account by simply adding the spectral moments of both surfaces together [33,36]. The effect of all these corrections is succinctly described by McCool [33]. To summarize, the analysis requires calculation of the three spectral moments of the surface topograph z(x,y) as follows:
60
d
60
40 40
20
0 20 -20 0
-40 -20 -60 1.2
1
0.8 0.6 0.4 0.2
0
-40
d 2z dz , m4 = dx 2 dx
where x is an arbitrary direction and
(1)
denotes a statistical
average. m0 is the mean square surface height, and so the RMS roughness Rq = m0 . From this one calculates the bandwidth parameter α = m0 m4 m2 2 , which is related to the asperity density. The true contact area Ac and total load P with respect to the apparent contact area A0 are calculated from the following equations provided by McCool [33]:
d Ac 1/ 2 = 0.0640(α − 0.8968) ⋅ F1 A0 σ s
(2)
d P 3/4 = 0.0333 E * m21/ 2 (α − 0.8968) ⋅ F3 / 2 A0 σ s
(3)
where
1 − ν12 1 − ν 2 2 E* = + E2 E1
−1
(4)
is a combination of the Poisson’s ratios and Young’s moduli of the two surfaces. For the calculations we use E=164 GPa and ν=0.23 for the two polysilicon surfaces. As well,
Fn ( t) =
1 2π
∫
∞
t
( x − t) n e − x / 2 dx . 2
(5)
which comes about from integrating the various quantities in the Hertz theory of contact over a Gaussian height distribution. The ratio d/σs is the summit mean plane separation d (Fig. 7) divided by the RMS summit height variation σs. As the surfaces approach, d decreases. With the adjustments made above, McCool [33] asserts that the GW formalism should provide at least an order of magnitude estimate, if not better, for a wide range of rough surfaces. In order to evaluate the spectral moments from our images, the following procedure was used. Images were recorded with at least 256 x 256 pixel resolution. Using SPM32 software from RHK Technology (Troy, MI) the RMS value was calculated and then squared to provide the value of m0. Each image was then expanded to 1024x1024 pixels with
Table II Parameter (units)
Unoxidized sample
Maximally oxidized sample
summit density 2 (/µm ) average summit radius (nm) σs, standard deviation of summit height distribution (nm) number of contact points for a 2 10x100 µm cantilever ratio of true to apparent contact area true contact area 2 for a 10x100 µm 2 cantilever (µm ) load for a 10x100 2 µm cantilever (mN) average contact pressure (MPa)
4510
4160
2320
806
0.173
1.62
1.53x10
5
4.24x10
0.031
0.0065
30.7
6.48
15.1
8.23
493
1270
4
the new pixel values calculated by interpolation. This reduced the amount of errors in derivative images that are inherently generated due to pixelation and noise. To reduce errors due to noise fluctuations, the images were smoothed using a modest pair of median filtering and smoothing algorithms. The median filter takes high and low pixel values and replaces them with the median value of neighboring pixels. After this step the image is smoothed using a twodimensional weighted average of the adjacent pixels. The first and second derivatives of the image with respect to the scan direction (the horizontal direction in Figs. 3-6) were then calculated from this expanded smoothed image, and the RMS values of these derivative images were found. The square of these RMS values provided the values of m 2 and m4 respectively. The above formulae were then used to predict the properties of these MEMS surfaces in contact. 10 2 x 10 µm images were chosen for this analysis as they provided a larger sample size of the features. For the calculations, we imposed a surface separation equal to one standard deviation of the combined summit height distribution σ s . This was chosen to ensure that the calculations represented a substantial but not severe interaction between the surfaces, and it should be noted that this value is different for the two interfaces. The results are summarized in Table II. All values here were calculated from the GW analysis. We see a strong contrast between the unoxidized and maximally oxidized surfaces. The oxidation produces rougher surfaces, yet there are slightly fewer summits per unit area. This is likely a result of the increased size of the grain boundaries. The average summit radius is smaller by a factor of ~3 for the roughened surfaces. These values are averages of all summits, and are
clearly much larger than the smallest asperities present on the surface. Therefore, it is likely that this simulation will underestimate the fraction of plastically deformed asperities. The roughened surfaces show nearly an order of magnitude larger standard deviation in summit heights. In combination with the smaller summit density, this leads to a smaller contact point density by a factor of three. The ratio of true to apparent contact area is small for both interfaces, which is a typical and important result for rough surfaces. As expected, the roughening leads to a much smaller contact area fraction, by about a factor of 5 compared with no roughening. For the separations imposed, the unoxidized surface supports more load. This is simply due to the fact that the contact area is higher for the given separation. More importantly, the average contact pressure, despite the lower load, is nearly three times higher for the roughened interface. This is due to the fact that the asperities are smaller. The average pressure is significant, and suggests that in combination with shear stresses (which are not considered in this model), wear of the asperities is likely for both cases, but far more likely for the roughened interfaces. Using a hardness of 11 GPa for silicon [16], the model predicts vanishingly small fractions of “plastically” deformed asperities. We believe this is an underestimate due to the aforementioned averaging of the asperity radius. CONCLUDING REMARKS The numbers presented in Table II are based on assuming the GW analysis is valid for our surfaces. We need to examine the extent to which this is true. As well, a number of parameters in Table II such as the summit density, radius, and summit height distribution, can be directly compared with the AFM images. Further study for a range of separations and comparisons by load, pressure, and contact area are also required to clarify the observed trends. These next steps will be presented in a future publication. The main remarks for now are as follows: (1) Roughened surfaces exhibit substantially altered surface morphology for both the Poly0 and Poly1/2 layers. (2) AFM data can be successfully input into a GW model of contact, producing predictions that at the very least appear reasonable and which correlate with expected trends. (3) The modeling confirms that roughening leads to fewer asperity contacts and a smaller real contact area by a factor of 5 for the separation chosen. This is highly desirable for minimizing adhesion and friction. (4) Roughening however leads to higher asperity contact pressures and therefore increases the likelihood of wear. Future studies should address the applicability of the GW model to these surfaces, and evaluate the dependence of the contact properties on different loads, pressures, and separations. Nevertheless, the above results indicate that roughening by itself may not solve MEMS tribology problems. Smaller real contact areas are desirable, but those should be coupled with smaller curvatures of the asperities in order to keep the asperity pressures low. This suggests new and somewhat more detailed strategies for surface topographic tailoring in MEMS.
ACKNOWLEDGMENTS We acknowledge support from the Graduate School of the University of Wisconsin-Madison. We thank the staff at the Microelectronics Development Laboratory at Sandia National Laboratories for fabricating the samples. Sandia is a multiprogram laboratory operated by Sandia Corporation, a Lockheed Martin Company, for the United States Department of Energy under contract DE-AC04-94AL85000. REFERENCES: (1) K.H.L. Chau, R.E. Sulouff, "Technology for the highvolume manufacturing of integrated surface-micromachined accelerometer products", Microelectronics Journal, 29, 579 (1998). (2) J. Bernstein, S. Cho, A.T. King, A. Kourepenis, P. Maciel, M. Weinberg, "A micromachined comb-drive tuning fork rate gyroscope", Micro Electro Mechanical Systems, Fort Lauderdale, FL, USA (1993). (3) T.W. Yeow, K.L.E. Law, A. Goldenberg, "MEMS optical switches", IEEE Communications Magazine, 39, 158 (2001). (4) L. Cao, S. Mantell, D. Polla, "Design and simulation of an implantable medical drug delivery system using microelectromechanical systems technology", Sensors and Actuators A - Physical, 94, 117 (2001). (5) J.J. Sniegowski, M.P.d. Boer, "IC-compatible polysilicon surface micromachining", Ann. Rev. Mat. Sci., 3 0 , 297 (2000). (6) M.S. Rodgers, J.J. Sniegowski, "Five-level polysilicon surface micromachine technology: application to complex mechanical systems", Solid-State Sensor and Actuator Workshop, 144, Hilton Head Island, SC (1998). (7) S.A. Henck, "Lubrication of digital micromirror devices", Trib. Lett., 3, 239 (1997). (8) M.N. Gardos, S.A. Gabelich, "Atmospheric effects of friction, friction noise and wear with silicon and diamond. II. SEM tribometry of silicon in vacuum and hydrogen", Trib. Lett., 6, 87 (1999). (9) D.M. Tanner, W.M. Miller, K.A. Peterson, M.T. Dugger, W.P. Eaton, L.W. Irwin, D.C. Senft, N.F. Smith, P. Tangyunyong, S.L. Miller, "Frequency dependence of the lifetime of a surface micromachined microengine driving a load", Microelectronics Reliability, 39, 401 (1999). (10) M. Mehregany, S.D. Senturia, J.H. Lang, "Measurement of wear in polysilicon micromotors", IEEE Transactions on Electron Devices, 39, 1136 (1992). (11) S.L. Miller, M.S. Rodgers, G.L. Vigne, J.J. Sniegowski, P. Clews, D.M. Tanner, K.A. Peterson, "Failure modes in surface micromachined microelectromechanical actuation systems", Microelectronics Reliability, 39, 1229 (1999). (12) U. Srinivasan, J.D. Foster, U. Habib, R.T. Howe, R. Maboudian, D.C. Senft, M.T. Dugger, "Lubrication of polysilicon micromechanisms with self-assembled monolayers", Hilton Head '98, 156, Hilton Head Island, SC, USA (1998). (13) N.R.G. Tas, C.; Elwenspoek, M., "Static friction in elastic adhesive MEMS contacts, models and experiment", IEEE Thirteenth Annual International Conference on Micro Electro Mechanical Systems, Miyazaki, Japan (2000). (14) S.T. Patton, W.D. Cowan, K.C. Eapen, J.S. Zabinski, "Effect of surface chemistry on the tribological performance of a MEMS electrostatic lateral output motor", Trib. Lett., 9, 199 (2000).
(15) E. Rabinowicz, Friction and Wear of Materials; 2nd ed.; Wiley: New York (1995). (16) G.M. Pharr, W.C. Oliver, D.R. Clarke, "New evidence for a pressure-induced phase-transformation during the indentation of silicon", J. Mater. Res., 6, 1129 (1991). (17) K. Komvopoulos, W. Yan, "A fractal analysis of stiction in microelectromechanical systems", Trans. ASME J. Tribology, 119, 391 (1997). (18) J.A. Greenwood, J.B.P. Williamson, "Contact of nominally flat surfaces", Proc. Roy. Soc. London A, 295, 300 (1966). (19) M.P. de Boer, D.L. Luck, J.A. Walraven, J.M. Redmond, "Characterization of an inchworm actuator fabricated by polysilicon surface micromachining", Proceedings of the SPIE, 4558, 169 , San Francisco (2001). (20) S.M. Sze VLSI Technology; McGraw-Hill: New York, 1983. (21) G.T. Mulhern, D.S. Soane, R.T. Howe, "Supercritical carbon dioxide drying of microstructures", Proc. 7th Int. Conf. Solid-State Sensors and Actuators, Transducers '93, 296, Yokohama, Japan (1993). (22) U. Srinivasan, M.R. Houston, R.T. Howe, R. Maboudian, "Alkyltrichlorosilane-based self-assembled monolayer films for stiction reduction in silicon micromachines", J. MEMS, 7 , 252 (1998). (23) J.S. Villarrubia, "Morphological estimation of tip geometry for scanned probe microscopy", Surf. Sci., 321, 287 (1994). (24) J.A. Greenwood, "Contact of rough surfaces"; in Fundamentals of Friction; I.L. Singer, H.M. Pollock, Ed.; Kluwer: Dordrecht (1992), p. 37. (25) K.L. Johnson, Contact Mechanics; University Press: Cambridge (1987). (26) A. Kapoor, J.A. Williams, K.L. Johnson, "The steady state sliding of rough surfaces", Wear, 175, 81 (1994). (27) B. Bhushan, "Contact mechanics of rough surfaces in tribology: multiple asperity contact", Trib. Lett., 4, 1 (1998). (28) J.I. McCool, "Extending the capability of the Greenwood Williamson microcontact model", Trans. ASME J. Tribology, 122, 496 (2000). (29) W.W. Tworzydlo, W. Cecot, J.T. Oden, C.H. Yew, "Computational micro- and macroscopic models of contact and friction: formulation, approach and applications", Wear, 220, 113 (1998). (30) J.T. Oden, J.A.C. Martins, "Models and computational methods for dynamic friction phenomena", Computer Methods in Applied Mechanics and Engineering, 5 2 , 527 (1985). (31) C.Y. Lee, J.T. Oden, "Theory and approximation of quasistatic frictional contact problems", Computer Methods in Applied Mechanics and Engineering, 106, 407 (1993). (32) P. Berthoud, T. Baumberger, C. G'Sell, J.M. Hiver, "Physical analysis of the state- and rate-dependent friction law: Static friction", Phys. Rev. B, 59, 14313 (1999). (33) J.I. McCool, "Comparison of models for the contact of rough surfaces", Wear, 107, 37 (1986). (34) P.R. Nayak, "Random process model of rough surfaces in plastic contact", Wear, 26, 305 (1973). (35) M.S. Longuet-Higgins, "The statistical analysis of a random, moving surface", Phios. Trans. R. Soc. London, Ser. A, 249, 321 (1957). (36) M. O'Callaghan, M.A. Cameron, "Static contact under load between nominally flat surfaces in which deformation is purely elastic", Wear, 36 (1976).