2011 International Conference on Document Analysis and Recognition
Fringe Map Based Text Line Segmentation of Printed Telugu Document Images Vijaya Kumar Koppula∗† ∗ Department of CSE CMR College of Engineering & Technology Hyderabad 501401, India
[email protected]
Abstract—Text line segmentation is a crucial and important step which can greatly influence the accuracy of an OCR system. One of the major obstacles to building high-accuracy OCR systems for Indic scripts has been the text line segmentation problem. In particular for Telugu script this problem is still to be adequately addressed by research. The common methods of Roman script are not applicable due to the inherent script complexity of Telugu. Previous approaches to Telugu OCR in the literature take a simplified view of the problem, leading to errors in line segmentation. The problem is compounded in old documents that are typeset manually and have nonuniform print quality. In this work we propose a new method using the fringe map concept. In a fringe map each pixel of the binary image is associated with a fringe number that denotes the distance to the nearest black pixel. We use fringe value information to segment text lines. First we locate peak fringe numbers (PFNs). PFNs that are not between lines are filtered out. PFNs between adjacent lines are used to construct a region. The segmenting path between the adjacent lines is found by joining the filtered PFNs of a region. Keywords-Text line segmentation, Indic scripts, Telugu OCR, Fringe Maps
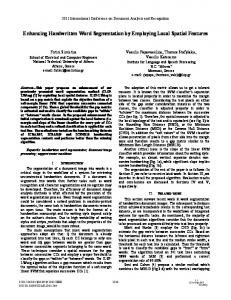
I. I NTRODUCTION In a practical Telugu OCR system we observe that on several occasions poor performance was not due to failure of the classifier but due to inaccurate text line segmentation. Text line segmentation in printed Telugu documents is quite challenging due to linguistic complexity, non uniform print quality and primitive typesetting. Telugu is a very complex script with large number of vowels, consonants, and various different combinations of vowels and consonants. A Telugu character may be either simple i.e., a single consonant or vowel, or compound, i.e., a combination of a basic consonant with consonant modifiers and/or vowel modifiers [1], [2], [3]. Examples of Telugu base characters and their phonetic variants are shown in Fig. 1(a). In Fig. 1(b) observe the orthographic properties of the components. Here consonant modifiers may be placed to either side around the base consonant. In many cases the consonant modifiers and vowel modifiers occupy adjacent lines with overlapping of line MBRs. A sample of Telugu text with a bounding rectangle around it and spatial distribution of components is shown in Fig. 2 where the dotted lines show an overlap of the line MBRs. Telugu 1520-5363/11 $26.00 © 2011 IEEE DOI 10.1109/ICDAR.2011.260
Atul Negi† of CIS University of Hyderabad Hyderabad 500046, India
[email protected] † Department
Figure 1. (a) An example of Telugu characters and Positional distribution of Vowels, Consonants and Consonant Modifiers (b) Lower, Middle and Upper zone example of Telugu script.
documents rarely contain a constant clear spacing between text lines due to variations in spatial distribution of the components. This is one of the reasons that the conventional line segmentation methods fail on Telugu documents. Due to the positional variation of a modifier component, the task of assigning it to a line above it or below has difficulty. Here we show an example from the Digital Library of India (http://www.new.dli.ernet.in) which were typeset by hand using primitive techniques and non-uniform print quality. Hence it is difficult to specify a consistent distance between in some components. The non-uniform print quality
Figure 2. Telugu text with line MBRs and Spatial distribution of components
1294
In RLSA consecutive black pixels along the horizontal and vertical directions are smeared. If the distance between the white space is within a predefined threshold, it is filled with black pixels. The bounding boxes of the connected components in the smeared image are considered as text lines. Negi et al [5] used RLSA based method for text line extraction with vertical and horizontal thresholds to extract words. Vertical smearing was used to join a consonant modifier with the related base character above it. Vertical smearing may join consonants and the vowel modifiers of lines that are close. Practically as seen in Fig. 3(b) components of adjacent lines join up because of overlaps between lines and also due to marginal skew. Koppula et al [6] proposed an approach that uses distance metrics between connected components for text line extraction in Telugu documents. It showed relatively better performance on the documents with text lines which are closely spaced. However it does not do too well in cases of overlapping and skew, and may lead to wrong merging of connected components. The methods for other Indic scripts such Tripathy and Pal, also Pal and Datta [7], [8] used piece-wise projection method in text line segmentation. The document is divided into vertical stripes. Analysis of ”water reservoirs” obtained from different components of the document is used to find the width of a stripe [8]. Stripe-wise horizontal histograms are then computed and the relationship of the histograms peak-valley points is used for line segmentation. This approach gave peculiar errors for Telugu script. Since in Telugu, characters are made up of more than one connected component. The white space between consonant and consonant modifiers misleads the piece-wise projection methods. Kumar et al. [9] proposed a graph cut based method for Telugu text line segmentation which can avoid being misled but this method needs apriori estimates of line segmentation followed by substantial training information of the script structure to cut accurately. Here instead we have a direct approach as described in the following section.
Figure 3. Projection Profiles and RLSA methods applied on image in Fig. 2.
documents may cause touching of components across lines. Conventional text line segmentation methods like projection profiles, connected components and run length smearing do not work well on Telugu printed documents. Fig. 3(a) shows projection profiles of the lines from Fig. 2. Fig. 3(b) shows results of applying Run-Length Smearing Algorithm (RLSA) on Fig. 2, both of which show a poor result. The proposed text line segmentation method in this paper is based on fringe maps [4]. Its aim is to find a segmenting path (curve) between two adjacent lines and separate them. Our motivation is to use an approach that is based on white space to guide the segmentation, much as a human reader follows the lines and views the gaps between the text to separate them. We do not attempt to enforce artificial boxes that force the rectangular notion of conventional approaches. In the remaining part of the paper, first, we take up in section II a review of some related works. Text line segmentation using fringe maps is explained in section III. We explain the proposed text line segmentation method in section IV. We conclude in section V. II. R ELATED WORK ON T ELUGU TEXT LINE
III. T EXT LINE SEGMENTATION USING F RINGE MAPS
SEGMENTATION
Originally as proposed by Brown [4] the concept of fringe distances was used to recognize characters. Fringe maps were first used in Telugu OCR to recognize characters [5]. In our recent work we introduced the concept of fringe maps with application to text line segmentation [10]. However there the approach was preliminary and now in this paper we present a refined and more robust technique as shown in the following sections. For completeness we start from the fringe map concept and then bring in issues related to line segmentation using fringes.
Projection-profile based methods have been one of the most popular top-down algorithms for printed documents. The projection profile is obtained by summing object pixel counts along each row, where the white space between the text lines is used for segmentation. This works provided that the spacing between two neighboring text lines is distinct. However, this method cannot be directly used in printed Telugu documents unless white space between two neighboring text lines is quite large. This method was used in previously published work [2]. Telugu text usually shows a projection profile with varying inter-peak and inter-valley distances. More than one peak is usually present within a single row of text [1]. This factor make the projection profiles prone to errors in identifying lines.
A. Fringe maps The concept of fringe maps is related to distance transforms [11] for binary images. In a fringe map [4] each pixel
1295
Figure 5. (a)All PFNs of an image are shown in shade (b) Fringe map and PFNs of selected portion of image in Fig. 5(a), PFNs between lines are shown in rectangular box Figure 4. (a) Telugu character ’KA’ (b) Fringe map of image (a) and Peak Fringe Number in circle
is represented with a fringe number. Every print (black) pixel has a fringe number of zero. Background (white) pixels have a fringe number which is a positive integer, that is the distance from the nearest black pixel using a L2 metric. In other words, A white pixel with fringe number x states that: 1) It is x pixels away from its nearest black pixel. 2) It is surrounded by atleast (x-1) white pixels in all directions. For us the second point is very useful. It helps us to quantify the white spacing between the components in the image. Assuming input to be normal binary images where the printing or writing is dark and background is light, so black pixels or the writing is represented as ’0’ and white pixels are set to a value ’-1’. To generate a fringe map for the input binary image we start by examining each neighbor of each black pixel, and write a value of ’1’ into each neighbor which is a white pixel ( -1). Horizontal, vertical, and diagonal neighbors are examined. Having done this, we examine each neighbor of each pixel with a ’1’ in it, and write ’2’ in the neighbors that are ’-1’. We continue growing fringes and incrementing fringe counts until there are no more ’-1’ value pixels. For example we take the Telugu character ’KA’ Fig. 4(a) and its fringe map is shown in Fig. 4(b).
Figure 6.
Zoomed part of rectangular box from Fig. 5(b)
However when we compute the map for an entire page we see more interesting things. We find PFNs in the fringe map for a given binary image where the direction of interest is vertical because we assumed the text runs in a horizontal direction. The PFNs are present at various locations in the fringe map. We observe that some PFNs are located inside the connected components of character objects, some between the components of a line and some between the components of adjacent lines. Fig. 5(a) shows all PFNs superimposed over the image from Fig. 2 and Fig. 5(b) shows fringe map and PFNs of selected portion of image in Fig. 5(a). Fig. 6 shows a zoomed part of rectangular box from Fig. 5(b). The PFNs between the lines are shown within the rectangular box. We are interested in PFNs between the lines. Using these PFNs we can generate a segmenting path. The other PFNs need to be filtered out. It must be noted that some parts of the image where there are no black pixels in the direction of interest do not have a PFN.
B. Fringe Map generation and Definition of PFN Fringe map is generated for the given input binary image. In a fringe map, each pixel is represented with a fringe number. We use maxima of fringe numbers to find white pixels between lines. This is made more formal using the PFN denition. Definition: PFN. In a fringe map, Peak Fringe Number (PFN) is defined as a maximum positive fringe number (white pixel) enclosed between two zeros (black pixels) in the direction of interest. For example a PFN is shown in Fig. 4.(b), where the direction of interest is in the vertical direction.
C. Fringe maps based text line segmentation using window approach In our previous work [3] we proposed a generic method using fringe maps for segmentation of text lines using a window approach. This method segments lines in three stages. The first stage generates a fringe map for the given
1296
the given input binary image. In the second step, Peak fringe numbers (PFNs) are located in the fringe map. The PFNs between text lines are determined by performing a filtering operation. At this stage identifying PFNs that belong to an adjacent line and to generate a segmenting path is not easy because the filtering operation leaves gaps. Hence a broad region is constructed in such away that it covers the consonant modiers of a line and vowel modiers of next line ( the overlapping and touching components of adjacent text lines). These regions cluster the PFNs between adjacent lines. In the last step, a segmenting path between lines is generated by joining the PFNs of a region.
Figure 7. (a) Fringe based method for text line segmentation using window approach applied on image in Fig. 2. (b) Zoomed part from Fig. 7(a)
input binary image. In the second stage, PFNs are located in the fringe map. A filtering operation on the PFNs is performed. Then the filtered PFNs between text lines are determined. In the last stage, a segmenting path between lines is generated by joining the PFNs. This method was doing well most of the time, but failed to segment text lines of Telugu script in certain cases where: 1. Non-constant space exists between text lines due to spatial variation of the components. The filtering operation leaves a huge gap between the PFNs. Then determining which PFNs belong to the adjacent line is very problematic. 2. A static window approach for joining PFNs is used to generate segmenting path. The space between words misleads the direction of the path. Fig.7 shows the results of a fringe based method for text line segmentation using this window approach. The segmenting path changed direction at the marked box because the space between words is wide and the gap between the lines is narrow. Window size is a parameter than can control the path, and prevent the PFNs of adjacent line from merging. The PFN filtering operation at times leaves a huge gap between PFNs. Thus all of these factors make this method prone to errors in generating a segmenting path. Although this problem can be solved by the right window size but then that needs customization. In the method proposed here we overcome such problems.
A. Locating PFNs between lines and constructing regions We scan the fringe map along columns and locate the PFNs. The PFNs may be present inside the connected component or between the connected components within a line of text or between the lines as shown in Fig. 5. We are interested in only the PFNs between the lines through which we can find a segmenting path between lines. Generally, we observe that the values of PFNs which are between the lines are greater than the values of PFNs with in a line either inside or outside the connected components. We used this observation to separate the PFNs, and distinguish between those PFNs that we need. A simple threshold value, say T, which is the arithmetic mean of all the PFNs is used to separate the required PFNs as shown in Fig. 9. Now determining the PFNs between the adjacent lines is an issue due to large gaps between the PFNs. This may be due to filtering operation upon PFNs or non existence of PFNs in vertical direction at that location. Note that joining of PFNs of two different adjacent lines leads to a wrong segmentation. Therefore we need to construct a region using PFNs through which we can determine the PFNs of adjacent lines. A region is constructed in such a way that it covers the consonant modiers of a line and vowel modiers of next line using PFNs. The PFNs within a region are clustered and used for segmenting path generation in next subsection. We scan the fringe map along columns and search the PFNs. Let a PFN point P, be at location (i,j), ith row and jth column, with a fringe value x then region is constructed with following boundaries: Top, as (i - x), Bottom as (i + x) , Left bound is extended towards left up to a black pixel (fringe value is zero) along the row
IV. P ROPOSED M ETHOD The proposed algorithm for text line segmentation of Telugu document images consists of three major steps as shown in Fig. 8. The first step generates a fringe map for
Figure 8.
Figure 9. Filtered PFNs are shown in shade, gaps between PFNs are shown in circles
Bloack diagram of Proposed text line segmentation method
1297
Figure 10.
Regions and filtered PFNs
was seen to be accurate with a percentage of 97.24 correct segmentation. Thus the proposed novel fringe map based technique for text line segmentation of printed Telugu script was seen to do well. We plan to test this against a larger corpus of test images and bring out a more quantitative comparative evaluation. Acknowledgment The authors thank the Ministry for Communications and Information Technology (MCIT), New Delhi, Government of India, for the test corpus collected under the grant No. 14(6)/2006-HCC(TDIL).
i from the current column j, and Right bound is extended towards right up to a black pixel (fringe value is zero) along the row i from the current column j . Union of these regions gives a broad region between adjacent text lines as shown Fig. 10.
R EFERENCES [1] C. Bhagvati, T. Ravi, S. M. Kumar, and A. Negi, “On developing high accuracy OCR systems for Telugu and other Indic scripts,” in Proc. Language Engineering Conference (LEC’02), Hyderabad, India, Dec. 2002, pp. 18–23.
B. Segementing Path Generation between Two Text Lines
[2] C. V. Lakshmi and C. Patvardhan, “An optical character recognition system for printed Telugu text,” Pattern Analysis and Applications, vol. 7, no. 2, pp. 190–204, July 2004.
Now a segmenting path that separates adjacent text lines is generated by joining the PFNs in a region. We scan the fringe map along columns from left to right and search for PFNs and build a segmenting path. We construct a path for a given point (PFN) at a position (i,j) by adding any points immediate to it. Now beyond this we don’t find any points immediately that could be added to the path straight away. However there is another PFN in the neighborhood where the path may continue. The issue is to find a local connection between these points. These sets of points need to be joined to the path. Now consider a point P at a position(i,j) and neighboring point Q at a position (m,n) then search for a point in each column from (j + 1) to (n - 1) in the region. The search is done along the column from current position to the top of the region, or top black pixel (fringe value zero) and bottom of the region or bottom black pixel to select a point. The point is selected such a way that it should be nearest to the point Q. Fig. 11 shows results of segmenting path generated between the adjacent text lines. Notice the correct direction of the segmenting path in the boxed regions as compared to Fig. 7.
[3] A. Negi, K. Shanker, and C. K. Chereddi, “Localization, extraction and recognition of text in Telugu document images,” in Proc. ICDAR, Edinburgh, Scotland, Aug 2003, pp. 1193– 1197. [4] R. L. Brown, “The fringe distance measure: an easily calculated image distance measure with recognition results comparable to Gaussian blurring,” IEEE Trans. Syst., Man,Cybern., vol. 24, no. 1, pp. 111–115, 1994. [5] A. Negi, C. Bhagvati, and B. Krishna, “An OCR system for Telugu,” in Proc. ICDAR, Seattle, USA, Sep 2001, pp. 1110– 1114. [6] V. K. Koppula, A. Negi, and U. Garaini, “Robust text line, word and character extraction from Telugu document image,” in ICETET, Nagpur, India, Dec 2009, pp. 269–272. [7] N.Tripathy and U.Pal, “Handwriting segmentation of unconstrained Oriya text,” in Proc. International Workshop on Frontiers in Handwriting Recognition, Kolkata, India, Oct 2004, pp. 306–311. [8] U.Pal and S.Datta, “Segmentation of Bangla unconstrained handwritten text,” in Proc. ICDAR, Edinburgh, Scotland, Aug 2003, pp. 1128–1132.
V. R ESULTS AND C ONCLUDING R EMARKS Experimentation showed that the proposed method performed obviously better as compared to the conventional text line segmentation methods such as the projection profiles, run length smearing and connected component algorithm. To get some statistics the method was tested on 234 images. It
[9] K. S. S. Kumar, A. M.Namboodiri, and C. V. Jawahar, “Learning segmentation of documents with complex scripts,” in Proc. 5th Indian Conference on Computer Vision, Graphics and Image Processing, Madurai, India, Dec. 2006, pp. 749– 760. [10] V. K. Koppula and A. Negi, “Using fringe maps for text line segmentation in printed or handwritten document images,” in 2010 Second Vaagdevi International Conference on Information Technology for Real World Problems (VCON’10), Warangal, India, Dec 2010, pp. 83–88.
Figure 11.
Result of Proposed method on image from Fig. 2.
[11] R. Fabbri, L. da F. Costa, J. C. Torelli, and O. M. Bruno, “2d Euclidean distance transform algorithms: A comparative survey,” ACM Computing Surveys., vol. 40, no. 1, 2008.
1298