Moreover, the Web access patterns on a web site are very dynamic in nature, due not only to the dynamics of .... which makes the GA one of the best global optimization tools. ...... ganism gets directly injected into the host organism's DNA.
From Static to Dynamic Web Usage Mining: Towards Scalable Profiling and Personalization with Evolutionary Computation Olfa Nasraoui and Carlos Rojas Department of Electrical and Computer Engineering The University of Memphis Campus Box 526574, Memphis, TN 38152 {onasraou, crojas}@memphis.edu Abstract In addition to its ever-expanding size and lack of structure, the World Wide Web has not been responsive to user preferences and interests. Personalization deals with tailoring a user’s interaction with the Web information space based on information about him/her. Mass profiling is based on general trends of usage patterns (thus protecting privacy) compiled from all users on a site, and can be achieved by mining user profiles from the historical data stored in server access logs. We have previously presented an evolutionary approach, called Hierarchical Unsupervised Niche Clustering (H-UNC), for simultaneously mining Web navigation patterns and maximally frequent context-sensitive URL itemsets from the historic user access data stored in Web server logs. H-UNC does not necessitate fixing the number of clusters in advance, is insensitive to initialization, can handle noisy data, general non-differentiable similarity measures, and automatically provides profiles at multiple resolution levels. Unlike content based association methods, our approach also discovers associations between different Web pages based only on the user access patterns and not on the page content. Also, unlike traditional context-blind association discovery methods, H-UNC discovers context-sensitive associations which are only meaningful within a limited context/user profile. Its hierarchical mode, very small population sizes, niching strategy, and a hybrid Baldwin learning scheme contributed to making H-UNC very economical from a computational viewpoint, especially when compared to standard evolutionary computation based data mining techniques. Unfortunately, it assumes that the entire preprocessed Web session data could reside in main memory. This can be a disadvantage for systems with limited main memory in case of huge web session data, since the I/O operations would have to be extensive to shuffle chunks of data in and out, and thus compromise scalability. Today’s web sites are a source of an exploding amount of clickstream data that can put the scalability of any data mining technique into question. Moreover, the Web access patterns on a web site are very dynamic in nature, due not only to the dynamics of Web site content and structure, but also to changes in the user’s interests, and thus their navigation patterns. The access patterns can be observed to change depending on the time of day, day of week, and according to seasonal patterns or other external events in the world. As an alternative to locking the state of the Web access patterns in a frozen state depending on when the Web log data was collected and preprocessed, we propose an approach that considers the Web usage data as a reflection of a dynamic environment which therefore requires dynamic learning of the access patterns. In this paper, we investigate a new evolutionary approach based on continuously and dynamically learning the Web access patterns from non-stationary Web usage environments. This evolutionary computation based approach can be generalized to fit the needs of mining dynamic data or huge data sets that do not fit in main memory. Preliminary experiments performed on real clickstream data illustrate how an evolutionary algorithm can be used for mining dynamic data to discover patterns. In the case of clickstream data, the patterns to be automatically discovered are Web user profiles. Being able to evolve with changing data is a crucial and key characteristic of an evolutionary data mining technique, if it is to be made truly scalabe.
1 Introduction and Motivation 1.1 Mining the Web for User Profiles The World Wide Web is a hypertext body of more than 800 million pages that continues to grow. It exceeds six terabytes of data on roughly three million servers. Almost 1 million pages get added daily, and typically, several hundred gigabytes are changed every month. Hence, it is clear that the Web currently constitutes one of the largest dynamic data repositories. In addition to its ever-expanding size and lack of structure, the World Wide Web has not been responsive to user preferences and interests. Personalization deals with tailoring a user’s interaction with the Web information space 1
based on information about him/her, in the same way that a reference librarian uses background knowledge about a person in order to help them better. For example, the phrase “theory of groups” has completely different meanings for a sociologist and a mathematician. In this case, the phrase is the same, while the contexts are different. The concept of contexts can be mapped to distinct user profiles. Mass profiling is based on general trends of usage patterns (thus protecting privacy) compiled from all users on a site, and can be achieved by mining user profiles from the historical data stored in server access logs. Recently, data mining techniques have been applied to extract usage patterns from Web log data [1, 2, 3, 4, 5, 6, 7, 8, 9, 10, 11]. Of particular relevance to this paper, is our previous work [6, 7, 8, 9, 10, 11]. In [6, 7, 8, 9], we have proposed new robust and fuzzy relational clustering techniques that allow Web usage clusters to overlap, and that can detect and handle outliers in the data set. A new subjective similarity measure between two Web sessions, that captures the organization of a Web site, was also presented as well as a new mathematical model for “robust” Web user profiles [6, 7, 8, 9] and quantitative evaluation means for their validation. Unfortunately, the computation of a huge relation matrix added a heavy computational and storage burden to the clustering process.
1.2 Genetic Algorithms Inspired by nature, Genetic Algorithms (GAs) [12] and evolutionary strategies [13] constitute a powerful set of global search techniques that have demonstrated good performance on a wide variety of problems. GAs search the solution space of a fitness function to be optimized using a simulated “Darwinian” evolution that favors survival of the fittest. Survival of the fittest is ensured by the fact that fitter individuals stand a better chance in reproducing and surviving to the next generation. GAs have been shown to solve linear and nonlinear problems by exploring all regions of the state space and exponentially exploiting promising areas through standard genetic operators. GAs start with a population of candidate solutions or individuals that evolve through generations of applying the operators selection, crossover, and mutation. Traditionally, the individual solutions are encoded on binary chromosome strings, and form the genotype. In order to evaluate the fitness of an individual, first the genotype must be decoded into an equivalent solution in the original domain of the problem, which is called the phenotype. Whereas traditional search techniques rely on characteristics of the objective function to be optimized (such as differentiability for gradients and Hessians, and sometimes linearity and continuity) to determine the next sampling point, GAs make no such assumption. Instead these points are determined based on stochastic sampling rules. This means that GAs can optimize fitness functions of many forms, subject to the minimal requirement that the function can map the population into a partially ordered set [14, 15]. GAs distinguish themselves from other optimizing tools because of their implicit parallelism, diversity and intensification. Parallelism and diversity are achieved by using a population of solutions instead of a single solution, which makes the GA one of the best global optimization tools. Intensification consists in preserving good solutions and combining their good features to produce better solutions through selection and crossover.
1.3 Genetic Niching The traditional GA [12] has proved effective in exploring complicated fitness landscapes and converging populations of candidate solutions to a single global optimum. However, some optimization problems require the identification of global as well as local optima in a multimodal domain. As a result, several population diversity mechanisms have been proposed to counteract the convergence of the population to a single solution by maintaining a diverse population of members throughout its search. These methods, known as niching methods [12, 16, 17, 18], were designed to identify multiple optima within multimodal domains. Each peak in a mutlimodal domain can be thought of as a niche. In nature, niches correspond to different subspaces of the environment that can support different types of life such as species or organisms. The fertility of the niche as well as the efficiency of each organism at exploiting that fertility is what determines the number of organisms that can be contained in a niche. This principle is at the base of how GAs should maintain the population diversity of its members in a multimodal domain. Thus, the niches should be populated in proportion to their fitness relative to other peaks. Mahfoud [18] proposed an improved crowding mechanism, called “deterministic crowding” (DC). After the mating of 2 parents, DC replaces each parent by the most similar child only if the latter has higher fitness.
1.4 Gene Expression in Nature Dramatic tansformations in nature occur when plants and animals approach the age of reproduction. Such changes are caused by major changes in the pattern of gene expression, with some genes being switched off, and others becoming active. The switch may be triggered by local signals such as changing concentrations of chemicals inside the cell, or by external signals such as hormones. For instance, factors such as temperature, the organism’s nutrition state or the
2
level of certain hormones can determine which sex develops in certain species. In a school of blue-headed wrasse, all the fish are female except for the dominant fish, which is male. If the male dies, the dominant female becomes a male within hours. If another male appears, she reverts to female again. ���� Most (close to ) of the DNA in the human genome is redudant, and not expressed. What we see expressed � everyday does not exceed � of the total DNA in the human genome. Some theories claim that this redundant genetic material helps an organism adapt in the presence of changes in the environment, including changes that revert the environment back to a previously seen state (memory), while some theories claim a Selfish gene theory [19].
1.5 Why the need for “Adaptive Representation and Dynamic Learning” in Data Mining? Living in a dynamic world: In this information age, we are collecting more and more information about our environment at exponentially increasing rates. The Web is expanding at an exponential rate. Yet the environment in which we live is not static. Almost every data collected in the world – (financial, scientific, News, Intelligence, ����� , etc) – is dynamic. Often, the goals or constraints for using the data, such as the kind of patterns to be mined, can change. Thus, there is a crucial need for dynamic learning, requiring flexible, pliable, adaptive preprocessing and representation mechanisms. Features, relevant to yesterday’s learning task, may become irrelevant today. Dynamic Learning Scenarios in Data Mining: Specifically, within the context of data mining and data analysis, there are two main scenarios that call on dynamic learning: (i) Scenario 1: The data supporting the learning task (including its nature, structure, ditsribution, and optimal representation), the goals of the learning task, or the constraints governing the feasible solutions for this learning task may be changing. This was discussed above, and a typical example today lies in mining sensor and data streams. (ii) Scenario 2: The mechanism that is used to process the data for data mining may mimic the previous dynamic learning scenario. For instance, the size of the data may be huge, and thus cannot fit in main memory, and we opt to process it incrementally, one sample at a time, or in chunks of data. In this case, there is no warranty that the different increments of data will reflect the same distribution. Hence this can be mapped to the previous dynamic learning scenario.
1.6 A Parallel between two Worlds: “Genetic Expression and Evolution” and “Adaptive Representation and Dynamic Learning” The type of flexibility and adaptation that is called for when learning in dynamic environments is nowhere to be found more than in nature itself. As was discussed above, regarding gene expression, the way that DNA gets transcribed and synthesized into elaborate protein structures is dynamic. Genes get promoted and suppressed with varying degrees and in a dynamic way that adapts to the environment, not only throughout several generations, but frequently, within the same lifetime. Similarly, when facing a dynamic environment, data mining should be flexible and adaptive, and this can be accomplished via the parallel that is exploited in this paper between gene expression in natural organisms and adaptive representations in data mining.
1.7 Problems with the current State of the Art and New Contributions Most current approaches avoid the feature representation dilemma of Web data by either resorting to relational clustering [6, 7, 8] (requires the computation and storage of all pairwise similarities), or association rule discovery [20] prior to discovering user profiles [4] (hence relying on two relatively expensive data mining steps). Since URL associations tend to occur with very low support in Web log files, the frequent itemset discovery step can become prohibitively expensive, in addition to producing too many spurious frequent patterns. In [10, 11], we presented a quasi-linear complexity technique, called Hierarchical Unsupervised Niche Clustering (H-UNC), for mining both user profile clusters and URL associations in a single step. This approach proved to be successful in mining clusters and frequent itemsets from large web session data. This kind of data, which is extremely sparse, presents a real challenge to conventional clustering and frequent itemset mining techniques. Many data sets share this sparsity with clickstream data: these include text data as well as a large number of transactional databases. H-UNC departs from the traditional limited flat view of the data, and generates instead, a hierarchy of clusters which gives more insight into the Web mining process, and speeds it up considereably. Its hierarchical mode, very small population sizes, niching strategy, and a hybrid Baldwin learning scheme contributes to making H-UNC very economical from a computational viewpoint, especially when compared to standard evolutionary computation based data mining techniques. Unfortunately, it assumes that the entire preprocessed Web session data could reside in main memory. This can be a disadvantage for systems with limited main memory in case of huge web session data, since the I/O operations would have to be extensive to shuffle
3
chunks of data in and out, and thus compromise scalability. Today’s web sites are a source of an exploding amount of clickstream data that can put the scalability of any data mining technique into question. Moreover, the Web access patterns on a web site are very dynamic in nature, due not only to the dynamics of Web site content and structure, but also to changes in the user’s interests, and thus their navigation patterns. The access patterns can be observed to change depending on the time of day, day of week, and according to seasonal patterns or other external events in the world. As an alternative to locking the state of the Web access patterns in a frozen state depending on when the Web log data was collected and preprocessed, we propose an approach that considers the Web usage data as a reflection of a dynamic environment which therefore requires dynamic learning of the access patterns. In this paper, we investigate a new evolutionary approach based on continuously and dynamically learning the Web access patterns from nonstationary Web usage environments. This evolutionary computation based approach can be generalized to fit the needs of mining dynamic data or huge data sets that do not fit in main memory. Preliminary experiments will be performed on real clickstream data in order to illustrate how an evolutionary algorithm can be used for mining dynamic data to discover patterns. In the case of clickstream data, the patterns to be automatically discovered are Web user profiles. Being able to evolve with changing data is a crucial and key characteristic of an evolutionary data mining technique, if it is to be made truly scalabe. The remainder of this paper is organized as follows. In Section 2, we review the process of Knowledge Discovery in Web usage data. In Section 3, we outline Web usage mining using the Hierarchical Unsupervised Niche Clustering algorithm. In Section 4, we present a modification to the GA, based on soft multiple Expression mechanism (s GA), for non-stationary function optimization. In Section 5, we present an evolutionary approach, called DynaWeb, for mining dynamic Web profiles automatically from changing clickstream environments. In Section 6, we present real experimental results that illustrate the performance of H-UNC in mining profiles on a real website. In Section 7, we present real experimental results that illustrate the performance of DynaWeb in mining profiles from dynamic environments on a real website. Finally, we present our conclusions in Section 8.
2 The Knowledge Discovery Process of Web Session Profiling 2.1 Extracting Web User Sessions The access log for a given Web server consists of a record of all files accessed by users. Each log entry consists of: (i) User’s IP address, (ii) Access time, (iii) URL of the page accessed, ����� , etc. A user session consists of accesses originating from the same IP address within a predefined time period. Each URL in the site is assigned a unique number , where is the total number of valid URLs. Thus, the user session is encoded as an -dimensional binary attribute vector with the property if the user accessed the URL during the session otherwise The ensemble of all sessions extracted from the server log file is denoted .
��
������� �� �� ���� � !# ����� "%$ '
�(
��
��� ����� ���
�&���
�����
)
2.2 Assessing Web User Session Similarity
9=
3.1.2 A Robust Multi-modal Fitness Function
?�
@�
�
Since in general, we identify dense areas of a feature space as clusters, the fitness value, , for the th candidate center location, , is defined as the density of a hypothetical cluster at that location. For the case of 2-dimensional clusters, the density can be defined as
�
! ? � " "%!6A B � ( � � �
�
(1)
( � ! "C*-,/. H D5414� 3 43 is a robust weight that measures how typical data point � E ! is in the � th cluster, � is a robust measure of scale (dispersion) for the � ��� cluster, A� ! is the distance from data point E ! to cluster center @ , and � � � is also related to the radius� of the is the number of data points. It can easily be seen that as a variance measure, niche, since in this particular optimization problem each cluster in the data set will generate a niche in the fitness 1443 � landscape. For the case of < -dimensional Gaussian clusters with variance , the normalized distance 4 3 follows � � a D5normalized a F distribution with < degrees of freedom. In particular, the probability that a data point lies within � A � ! , from the center that encloses a distance of F from the center is J . The niche radius is defined as that distance, HG I '
� LK high percentage of the points in that cluster (such as J " ) Hence, the niche radius is close to M � , where M is approximately F . Note that with reliable estimates of the cluster scales, , the robust weights ( ! approaches � HGON P6PDQ � 1 when A� ! approaches zero (for points close to the cluster center), while asymptotically approaching zero when A ! � � approaches infinity (for outliers), hence offering a means of distinguishing between good and bad data with respect Y � Z X � � 4 7 5 W 6 V 4 ' 0 1 to every cluster. Moreover, by taking RTS 4 " RHU , we obtain @ � " 0 �1 576 V 4 � . The above two observations lead us to where
5
�
conclude that the objective or fitness function in (1) is expected to be optimal only at the centroid of the cluster, even in the presence of noise, outliers, or more generally any data that does not follow the distribution of the majority of the data in the cluster. This means that the fitness measure is robust. Similarly, when a data set contains several clusters, with reliable estimates of the different cluster scales, , the robust weights will only be high for points that are within the boundaries of the cluster. This means that the landscape of the fitness function in (1) is expected to reach several suboptimal peaks (multiple modes) located at the centroids of these clusters, and their identification is a multi-modal optimization problem. The scale parameter that maximizes the fitness value for the cluster can be found by setting to obtain
�����
� ���
�
� �
(� � !
( �!
�
" !6A B 6! B� ( "� % " A �
RR T5 S 443 " '
� ��� � ! A�! � !
(�
�
(2)
�
Therefore, will be updated using an iterative hill-climbing procedure, using the previous values of to compute the weights in (2). The scale estimation by Hill climbing makes the entire hybrid genetic optimization process converge much faster (typically 10 generations) than a purely genetic search . When mating takes place, each child should inherit the scale parameter, of the closest parent as its initial scale before updating. After convergence of the population, the best � individual from each good niche is extracted using a greedy approach [21] to obtain the set of final cluster centers, .
�
�
3.1.3 Computational Complexity
=
=
In each generation, the most extensive computational requirement for UNC consists of computing the residuals, fit�� � inter-niche distances, resulting individuals in the population, and exactly ness and scale, for each of the in � computations. Since the population size tends to be a small fraction of the size of the data set, the complexity is close to linear, and can be further reduced if clustering is performed hierarchically.
B = �G
3.2 Hierarchical Unsupervised Niche Clustering (H-UNC) and its adaptation to Web Usage Mining We retain the principal structure of UNC presented in Section 3.1, except for a few differences that result from the distinct nature of the session data. The solution space for possible session prototypes consists of binary chromosome strings which are defined to be the binary session attribute vectors defined in Section 2.1. The fitness function remains the same as in (1), except that the Web session dissimilarity measure, defined in Section 2.2, is used instead of the Euclidean distance to take the Web site topology in account. The computational time of genetic optimization can be significantly reduced if we perform clustering in a hierarchical mode. In other words, we could cluster smaller subsets of the data using a smaller population size at multiple levels, instead of clustering the entire data set on a single level which would necessitate a larger population size. The computational complexiy of UNC is � , where is the population size and is the number of data points to be clustered. Since, in the hierarchical mode, can usually be a very small fraction of (typical example from our experiments: to , this complexity is �������� ������ much lower than that of relational clustering techniques such as Agglomerative Hierarchical Clustering (AHC) [22], � �� �� �� and the closely related graph theoretic based Minimum Spanning Tree (MST) [22], �� � . The hierarchical clustering is performed recursively starting from the top level (lowest resolution) until a termination criterion, based on the minimum acceptable size of a cluster, �� , and � its � maximum allowable mean squared ����� error, �� , is met. Let denote the current level. Let denote the data set �
��
=
�
��
��
B =
G
=
8 " � ���, � -, ���:� � � � � � 8 ,-�-� � � , � � � � � �-,�� �:� � 9�� 6 = � E H � E � H � partitionned at level , where � at level . Let the list of prototypes �-,�� � � � is the" � th� cluster � found ��,�� the�:� denote � � inducing the above partition, and let � denote set of mean squared errors � � � � � �-,�� � � �-�, � � � 6 �-�, � � � � � 9 � 6 = � computed for each subset of the above partition, using (2.4). The hierarchical clustering procedure using UNC for E
Web mining is given below.
6
Hierarchical clustering using UNC (H-UNC algorithm) Fix population size, number of generations, maximum number of levels ( ); Set starting level ; �� � �� � Set initial number of clusters � � � � Set initial data set to be clustered � � � � � � �� Set initial set of prototypes � �� Initialize final list of prototypes � �� �� Initialize the set of mean squared errors � �� � � �� � Cluster_Recursively � �� � �� �� � Assign all data points in to closest prototype Recompute using (2.4) and using (2.4);
E" �
�
�
The procedure Cluster_Recursively
BG
� ��, � �:� " " � ��, �:� -� , � � � � " � " -� , � � " � � � �-, � � � E " ��, �:� 6 " � � � -� , � � �-, � � �-, � � � � � � �
is given below.
� � � � � � �/G Cluster_Recursively B � � � , � � � �, � � � ,�� � � FOR � " TO � � � DO� { /* Each prototype in */ � , � � , E � G
E� G IF B " or B � � �-,�� �:� � � � 8 � ,��-� and �-,�� � � 4 � 8�� ,-��� and THEN { � Perform UNC clustering on data subset �� � /* will result in extracted prototypes � � set, partionned data set ����� � ����� and � � computed for each subset of this partition � */ � � Cluster_Recursively � } ELSE { � Add prototype to final list of prototypes, � }
�
� -� , � � � � � , � �-,-> � � ��
�
� 6 � � � , � "� � � � , � " ,� , , > B� ,�� ,�� ,�� E � G
�&���
}
�
�
3.2.1 Ease of Setting the Parameters
' ��� Hence, it is easy to set the For the case of Web session clustering, all session dissimilarities are confined in �
� values of parameters 8�� , and 8 � �8 � ,-��� should be the ,��-� especially in an interactive mode. As a rule of thumb, ,-��� largest tolerable dissimilarity between sessions considered to be in the same cluster, and 8 � should be the minimum ,��-� size of an acceptable cluster or profile. Even though the above parameters will eventually determine the number of clusters at the last level of the partitionning, they are not crucial to the performance of H-UNC because first of all if the partitionning is done at too many levels of the hierarchy, the final clusters will still be good (only exhibiting higher specificity or resolution). And even with too few levels in the hierarchy, H-UNC is expected to identify as many of the good (maximally dense as per the fitness measure) clusters as possible at that level unlike other approaches that will simply link different clusters, thus inducing erronous prototypes.
4 The Soft Multiple Expression Genetic Algorithm Initial attempts at exploiting the metaphor of the evolution of species in solving optimization problems focused on a static and generally uni-modal objective function. However many real world problems are dynamic in nature, and they deal with changing environments or objective functions. Dynamic objective functions can make the evolutionary search extremely difficult. Some work has focused on altering the evolutionary process, including the selection strategy, genetic operators, replacement strategy, or fitness modification, while other work focused on the concept of genotype to phenotype mapping or gene expression. This line of work includes models based on diploidy and dominance [23], messy GAs [24], Gene Expression Messy GA [25], proportional GA [26], overlapping genes such as in DNA coding method [27, 28, 29, 30] , the floating point representation [31], and the structured GA [32]. In particular, the structured GA (sGA) uses a simple structured hierarchical chromosome representation, where lower level genes are collectively switched on or off by specific higher level genes. Genes that are switched on are expressed into the final 7
phenotype, while genes that are switched off do not contribute to coding the phenotype. We have recently proposed a modification of the sGA based on the concept of soft activation mechanism [33]. The lower level genes are no longer limited to total expression or to none. Instead, they can be expressed to different gradual degrees. The soft structured Genetic Algorithm (s GA) inherits all the advantages of its crisp (non-fuzzy) counterpart (sGA), but possesses several additional unique features compared to the sGA and other GA based techniques.
4.1 Logical and Biological Motivations for Soft Simultaneous Activation Relying solely on a crisp ON-OFF switching mechanism in gene expression actually forfeits the vast majority of the phenotype space that can be coded by redundant subchromosomes, and has a tendency to push the adaptation process into a pure memory-dependent learning mode, instead of active learning. The adaptation process essentially becomes keen to using a look-up table of past solutions. and becomes essentially at the mercy of a bit mutation in the high level genes in order to switch expressions. From a biological point of view, this assumes that an organism can switch drastically from one form (phenotype) to a completely different one. Such drastic discontinuous transformations are not possible in nature. Evolution tends to happen in gradual and continuous steps, whether across multiple generations on the species evolution level, or across a single lifetime of an individual on a gene expression level (ex: metamorphosis from tadpole to adult frog). Further supporting this aspect, is the fact that recent research on modeling gene expression and interaction has recognized that Boolean logic is inadequate to model the quantitative features such as the concentration of regulatory molecules. These features do not let them act like a simple ON-OFF switch. In fact the main reason for the prevalence of the Boolean logic model was due not only to its simplicity, but also due to lack of quantitative data in the early days. However, recent advances in genetics, molecular biology and bioinformatics has led to an explosion of quantitative data, which is precisely what was lacking before. Some of the efforts that tried to enrich the Boolean model were done in the SIMFLY2 simulation of a fly embryo [34] using a multi-threshold model. More complex models use Differential equations such as in [35], Piecewise-Linear Differential Equations [36], and multi-valued activation states [37]. In fact, most differential equations for modeling gene regulation manipulate rates of expression of genes instead of ON-OFF states.
4.2 The Soft Multiple Expression Genetic Algorithm 4.2.1 Multiple Expression Chromosome Representation
' � �
In the soft activation mechanism [33], the activation of the subchromosomes in the lower levels is not a crisp value . This allows (active or not). Instead every subchromosome has a soft activation/expression value in the interval � the expression of multiple subchromosomes and therefore increments the search space. To get this soft genes at the highest level to be � . Then we allow each � activation, we fix the number of activation activation gene, , to be a real number in the interval �� . Therefore the activation values at the top level represent ��� �� � � � � fuzzy membership values, � , for a fuzzy set defined on the lower level gene structures, � , of the whole chromosome. Each activation gene controls only the lower level genes situated under its own hierarchy as in the sGA. In the 2-level case, each chromosome can be treated as a fuzzy set or a possibility distribution over the genotype space. This extends the singleton crisp set used in the crisp activation model of sGA, which itself extends the non-set based chromosome model in the simple GA. We used the same number of high level activation genes as the number of learning environments to alternate. The values for the soft activations were obtained as follows. In general, if there are � soft high level activation genes � � , each encoded on �� bits, the value � for the soft high level activation gene � is: � �����
� � � � � ��F � �"
�
�
� � � ��� � ��
E
�
�
!6A B � �� � ! " � ' � � " " 0 (3) � � !6A B � �� � ! " ' � " ! is the decimal value of the E�� bits coding A the ! soft high level activation gene. Therefore � � � � ' � � , �
� " �A B � � " � " �A B � � "
Where
�"
' � � G � 8 8 8 B � " �
�
� 4 ����� � �1 57� 6 ����� � �
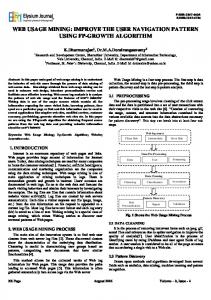
and . This has the advantage of keeping a chromosome with the same data encoding (binary) for both � � high and low level genes. Hence, it was not necessary to build a mixed (real and binary) valued chromosome. The activation genes are constrained to sum to 1 in our preliminary model, but this constraint is not required. Hence, . But they can be nonzero simultaneously. This means that several different expressions can � � co-exist in the same population, same generation, and same chromosome. It is this feature that is expected to allow for gradual adaptations of the genome to dynamic environments. The fitness computation of this genetic algorithm can consider all the subchromosome expressions. This is accomplished by a weighted fitness: 8
Figure 1: s GA Chromosome representation: (a) hierarchical representation(sGA), (b) Linear representation
? " AB � � � ? � � � �
(4)
taking into account to some degree the fitness of each subchromosome to get a global fitness measure. However, other aggregation mechanisms are possible. Figure 1 illustrates a simple representation of a 2-level s GA: Genes in Level 1 have soft activation values. All genes in Level 2 are activated to different degrees unless the upper level activation value is zero. 4.2.2 Special Crossover This specialization performs an independent crossover for each subchromosome in the low level. First, a measure of the distance (the phenotypic distance) between the subchromosomes of the parents is computed, and each subchromosome from one parent is paired with the most similar unpaired subchromosome from the other parent. Next, a one point crossover between the paired subchromosomes is done (some care is taken to guarantee that all the subchromosomes participate in the crossover). Finally, the activation data of the high level is crossed, by performing a one point crossover between each pair of corresponding high level activation strings (the correspondence is obtained from the matching between the low level paired subchromosomes). 4.2.3 Advantages of the soft activation mechanism the way that the sGA extracts and interprets the information residing in the chromosomes. As in The s GA extends � the simple , the introduction of more information in the chromosome compared to a single expressed phenotype allows individuals that could sample the search space in multiple ways without extraordinary effort. Moreover, the soft activation mechanism offers the possibility of a richer knowledge of the goodness of the multiple samples. All the data in the chromosome is taken into account, but the contribution of each subchromosome in the final fitness is smoothed by the activation levels. We can summarize the expected strengths of the soft activation mechanism as follows: 1. All the genotype data in the chromosome can be expressed to some degree. However, this level of expression does not only depend on a single subchromosome activation level and its goodness, but instead, can depends also on how good and how activated the other subchromosomes are. 2. The inherently redundant information, and the soft activation mechanism provide a robust chromosome. It means in order to damage the quality of the chromosome (i.e. its fitness) a significant change must happen concurrently that strongly disrupts both the data in the activation levels and the data of the subchromosomes. In general, a drastic change is less likely with soft activations than with crisp activations. 3. The implicit robustness of the population and the soft activation mechanism constitute a protection against premature convergence. It would work in two ways: first, a promising search would not be prematurely abandoned 9
because of apparently raising ’super-individuals’; second, the fitness of a ’super-subchromosome’ would be scaled by its activation level. 4. Depending on the activation values, and on how they are interpreted, more than one soft genotype can map to a single phenotype. Similarly, a single soft genotype can map to several phenotypes. This property has been lately recognized as very desirable to solve highly complex optimization problems [25]. The mapping mechanism is based on the soft activations, that can be considered as possibilities, potentials, or probabilities of a given subchromosome finally getting expressed as part of an entire organism. It is clear that the soft activa���� �� tion mechanism has a much larger search space size ( ) compared to the crisp mechanism ( ), where is the alphabet size or number of possible alleles per gene, is the number of subchromosomes per � chromosome/individual, is the number of activation genes per subchromosome which control the expression � of the information genes, and hence the genotype to phenotype mapping function ( is always 1 for the crisp activation model), and is the number of information genes per subchromosome. The soft activation model has a much larger search space size because it effectively searches both the space of good genotype to phenotype mappings (and hence the space of good relations [25]), and the search space.
E
4 A �-, , �
E
4 A �� , �
E
�
5 DynaWeb: Mining Web Usage Data in Dynamic Environments
=
The proposed dynamic evolutionary data mining algorithm uses the folowing representation: Each chromosome consists of subchromosomes. Each subchromosome encodes a possible session prototype or profile that consists of a binary string with same format as the binary session attribute vectors defined in (2.1). Hence, each chromosome
may encode different profiles, where each profile can be expressed to a certain degree in � . The cosine based dissimilarity measure, defined in Section 2.2, is used to compute the distance between session data and candidate profiles. The formulation of our fitness function is based on a density based measure that was proposed for mining clusters candidate profile, , is defined as the density of a hypothetical cluster of in [21]. The fitness value, , for the
��
?�
�
�&���
' ���
�
� as a summarizing prototype or medoid. It is defined as ? � " 0 �1 575 643 V 4 � where ( � ! weight that measures how typical a session � ! is in the � ��� profile, and is given by � ! � ( � ! "%*H, . H � A��
Web sessions with
�
is a robust
(5)
is a robust measure of scale (dispersion) for the � ��� profile, A� ! is a distance measure from session � ! to profile �
� , and is the number of data points. Note that� the robust weights� ( � ! will be small for outliers, hence offering a means of distinguishing between good data and noise. The scale parameter that maximizes the fitness value for the �F��� 4 ' to obtain " 0��1 57� 6 V 4 � 144 �34 � It was shown in [38], that to get unbiased scale profile can be found by setting R�S 43 " V � 0by1 5�a6 factor R5 estimates, the above scale measure should be compensated of 2, which results in � ! "� "%!6A B 6! B� ( � A�! � !
� (6) � � " A �(� Therefore, ( ! and using (5) and (6) respectively, for M � 5 iterations for each � will be alternatively � updated individual, starting with an initial value of , and using the previous values of to compute the weights ( ! . � � � : ��� � , This hybrid genetic optimization converges much faster than a purely genetic search.
6 Web Usage Mining Experimental Results with Hierarchical Unsupervised Niche Clustering Our new approach to profiling Web users based on robust Hierarchical UNC was applied to extract the typical Web session profiles from the log data of the website for the department of Electrical and Computer Engineering at the University of Missouri-Columbia. This clickstream data was preprocessed, resulting in 1703 sessions and 369 URLs. The profiles will be described both qualitatively by verifying whether they reflect real profiles characterized by distinct user interests, and quantitatively using the evaluation and interpretation criteria given in Section 2.4. The results will also be examined from three different perspectives:
10
�
Table 1: Examples of Profiles discovered by HUNC from MU-CECS1 Data at
�
1
"�
and
( 8 �: " ' �
{.83 - /CECS_computer.class} {.95 - /courses.html} {.95 - /courses_index.html} {.95 - /courses100.html} {.19 - /courses200.html} {.19 - /people.html} {.19 - /people_index.html} {.19 - /faculty.html} {.93 - /}
2
{.64 - /CECS_computer.class} {0.63 - /degrees_undergrad.html} {0.64 - /degrees_index.html} {0.64 - /bsce.html} {0.38 - /bscs.html} {0.22 - /bacs.html} {0.29 - /courses400.html} {0.29 - /courses.html} {0.62 - /courses_index.html} {0.64 - /courses100.html} {0.51 - /courses300.html} {0.22 - /courses_Webpg.html} {0.44 - /courses200.html} {0.66 - /degrees.html} {0.16 - /general.html} {0.16 - /general_index.html} {0.16 - /facts.html} {0.78 - /}
3
{1.00 - /} {.67 - /CECS_computer.class}
�
� �� � � �� � � �
" �
Table 2: 4 of the 7 profiles discovered by HUNC from MU-CECS1 Data at description 1
572
312
362.2
main page, class list, course
2
305
170
191.0
Dr. Saab’s and Dr. Joshi’s course pages
�
0.32
enquiries, people and main degree page 0.54
(CECS 333 and CECS 352 respectively) 3
185
111
124.0
Accesses to the CECS227 class pages
0.2
4
162
84
102.2
Dr Shi’s CECS345 pages
0.37
5
73
56
51.0
Dr. Shang’s course pages
0.08
�
� �� � � �� � � �
Table 3: Some of the 16 profiles discovered by HUNC from MU-CECS1 Data at description 1
219
132
140.5
main page, class list, course
2
119
73
77.0
main page, class list, course and
�
"
� and
"�
0.16
enquiries and people 0.27
undergraduate degree enquiries 3
140
85
91.6
Short sessions mostly limited to main
0.13
page and class list 4
129
71
80.7
main page, people, individual faculty,
0.39
research and graduate degree pages 6
133
80
85.2
Dr. Saab’s CECS333 pages
0.46
(long detailed sessions) 8
47
-
29.4
Dr. Saab’s CECS333 pages (short sessions)
0.16
9
53
28
33.4
Dr. Saab’s CECS303 pages
0.19
(long detailed sessions) 10
184
111
123.3
Accesses to the CECS227 class pages
0.2
11
77
49
49.3
Dr Shi’s CECS345
0.27
12
47
30
30.0
Dr Shi’s CECS345 (long sessions:
(main page and Java examples) 0.26
lectures and project No. 1) 13
(�8 � :
34
-
22.5
Dr Shi’s CECS345 (short sessions to main page)
0.19
( �!
' �
(i) Robust profiling is obtained by retaining profile members whose robust weights, , exceed a given threshold, , equal to in our experiments. This allows us to concentrate on the core of each profile by filtering out the noise sessions which end up being assigned to the closest profile based on relative dissimilarities alone. Note that the
11
( 8 �;:
J
( 8 �;:
results are not sensitive to the specific value of , and that higher values will only allow us to zoom even closer on the core of the cluster or profile. Another way to look at this is that different values generate different -cuts of the profiles when these are viewed as fuzzy sets. The -core of the profile is defined as
�&��� ( 8 �: � � " � � ��*+� � � � � ( ��* � ( 8 ;� : ��
(7)
(ii) Multiresolution profiling is done by examining profiles obtained with a varying number of levels, , in the hierarchy. (iii) Inferring URL Associations Associations between different URLs can be directly inferred by simple inspection of the robust profile vector components. The parameters for the robust hierarchical UNC were fixed to the following values: The crossover and mutation � respectively. It is important to note that our simulations have shown probabilities are � and that the results are not sensitive to these parameters, as long as they are chosen within reasonable bounds. That is, � � and � . UNC used generations per clustering with a population size, , .
� Since all session dissimilarities are confined in � it is reasonable to choose � . Again, these parameters are easy to set because of the known range of Web session dissimilarities, � and especially in an interactive mode. When coupled with a recommendation system, we plan to optimize these parameters to yield the best recommendations. After clustering, the sessions were assigned to the closest cluster and only the session clusters or profiles with cardinalities exceeding � were considered as sufficiently strong profiles. The profile vectors were computed as explained in Section 2.4, where only the significant URLs ( ) are URL} in table 1 illustrating typical retained, and the individual components are displayed in the format { profiles. The tables that summarize the description of all the sufficiently strong profiles also list their cardinality, , core cardinality, , robust cardinality, , and average dissimilarity, . In the tables, the symbol “ ” in the entry corresponding to means that the core of the profile contains fewer than � sessions. Also, in the tables illustrating some typical profiles, we display the significant profile weight computed based on the core of the cluster, , defined in (7). The results obtained with 10 individuals per population and levels are summarized in Table 3 which shows that HUNC succeeded in delineating many real profiles reflecting typical access patterns – the general “outside visitor" is captured in profiles 1 and 3; prospective students in profile 2 and 4, CECS 352 students in profile 7, etc. The quality of these clusters is confirmed by their low average dissimilarity compared to the maximal value of . � (i) Robust profiling When only sessions with weights exceeding are considered, profiles Nos. and end up having less than 20 members, hence making weak profiles. Also, the core of the spurious cluster No. was discovered to contain sessions accessing the site managers’ pages. (ii) Multiresolution profiling: Note how profile 2 (at ) in Table 2 is split into many profiles with distinct � ) (profiles No. 5, 6, 7, 8, and 9) as shown in Table 3. The same observation can be made about user interests (at the first cluster (general inquiries about the CECS department) which at level 2 gets split into profiles No. 1, 2, 3, and 4, with each such profile showing a more specific kind of interest in the department. (iii) Inferring Associations between different URLs: Profile 2 (at ) in Table 2 contains access to two different courses taught by different professors, signaling an association. It was later revealed that one of the courses � � (CECS 352: Operating systems) relies for the implementation of its projects on the C programming language which is taught in the other course (CECS 333: Object Oriented Design).
� � '
8 " ' ,��-�
� " '
� 8 � �'3
� 8 " K� ��' � � ��'
�
' ��� �
'
�� � �
��
�� � �
�
�����
� � ! � � ��� �
�
= " �' 8 " �' ' 8 �� " WK � 8 �, �-� " �;' : ��� < A
� � ! � ' ���K
'
H
�� � �
"
�
' �
" �
"
� ��
" �
7 Dynamic Web Usage Mining Experimental Results The real clickstream data used in this section consists of 1703 sessions and 369 URLs extracted from Web logs of the website for the department of Electrical and Computer Engineering at the University of Missouri-Columbia. The following experiment was performed to illustrate how an evolutionary algorithm can be used for mining dynamic data to discover patterns. In the case of clickstream data, the patterns to be automatically discovered are Web user profiles. Being able to evolve with changing data is a crucial and key characteristic of an evolutionary data mining technique, if it is to be made truly scalabe. In order to simulate a non-stationary environment for Web mining in a controlled experiment, we used a coarse partition obtained using H-UNC [39] in order to consider the sessions that were assigned to each cluster as representing a different environment. Thus, each environment corresponds to a different Web usage trend. Five out of 20 clusters discovered by H-UNC were selected to serve for this purpose, and the sessions from these clusters were split into five different clickstream data sets. These five profiles are listed in table 4. The Genetic algorithm tried to evolve profiles while facing a changing data set obtained by alternating the data from each of the 5 clusters every 50 generations. The process was repeated 20 times, each time presenting the succession of 5 data sets in alternation. 12
Table 4: Summary of ground-truth profiles/environments (only URLs with top 3 relevance weights shown in each profile: Each profile corresponds to accesses to different course pages on the website)
4
No. sessions
1
51
{0.90 - /˜saab/cecs303}, {0.84 - /˜saab/cecs303/private}, {0.71 - /˜saab/cecs303/private/solution}
2
74
{0.57 - /˜shi/cecs345}, {0.45 - /˜shi/cecs345/java_examples}, {0.46 - /˜shi/cecs345/Lectures/07.html}
3
106
{0.99 - /people_index.html}, {0.98 - /people.html}, {0.97 - /faculty.html}
4
116
{0.91 - /˜saab/cecs333/private}, {0.78 - /˜saab/cecs333}, {0.53 - /˜saab/cecs333/private/assignments}
5
185
{0.84 - /˜c697168/cecs227}, {0.74 - /˜c697168/cecs227/left.html}, {0.73 - /˜c697168/cecs227/head.html}
��
4
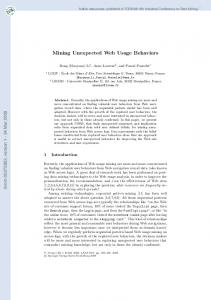
1 1st Environment 2nd Environment 3rd Environment 4th Environment 5th Environment 0.8
0.6
0.4
0.2
0 0
200
400
600
800
1000
Figure 2: Average similarity to ground-truth profiles among good individuals averaged for 20 runs
" = " K
The proposed algorithm, DynaWeb, was applied with a population fixed to 50 individuals, and with chromosome encoding based on � subchromosomes, each activated by one of 5 continuous valued activation genes from the highest level. The ability of the population to evolve in a dynamic way when facing each new environment was evaluated in each generation by comparing the good individuals in the population to the ground-truth profiles, �� , ( ����� ). To do this, we defined as good individuals, those individuals that have a combined fitness �� of the maximal fitness in the current generation. Before comparing an individual to the ground truth exceeding profiles, an expressed phenotype has to first be extracted. In our case, the active (i.e., with activation gene value ) subchromosome with highest fitness, was used to yield the final expressed phenotype. It is this phenotype that is compared with each of the ground-truth profiles in each generation. We do this by computing the cosine similarity ��� ��� . between the phenotype expressed by each good chromosome and each of the ground-truth profiles, � , The similarities computed using all the good chromosomes are averaged in each generation, to yield measures for �� ����� . These measures are used to assess whether the evolution is able to adapt each ground-truth profile, � , to each change in the environment. Ideally, adaptation to the environment, when this is the current environment, is � � quantified by the fact that gradually becomes higher than all other . The above procedure was repeated 20 times and the results are averaged. Viral injection/replacement was used. This phenomenon is different from traditional evolutionary techniques, in that genetic material from an external organism gets directly injected into the host organism’s DNA. It is common with viruses such as the AIDS virus. It is expected that this operation will refresh the current genome with vital and current information from the new environment. This step stochastically replaced (with small probability per generation) the most active subchromosome from the worst individual of the current population (based on their combined chromosome fitness) with data randomly selected from the data set being presented in the current generation. The results are shown in Figure 2. This figure, which is better viewed in color, shows that as each environment comes into context, the genomes in the current population gradually evolve to yield candidate profiles that match the new environment. That is, whenever the environment � � changes from to , the similarity measure that is the highest gradually switches from being to becoming . Hence, the genome succeeds in tracking the dynamic web usage trends, which is the desired goal. We have also observed a successful adaptation of the expression/activation genes, switching between different parts of the chromosome to track � the changing environments. We also note that the average similarity, , achieved for the second environment is the lowest. This is because the sessions in this environment have more variability, and thus form a less compact cluster, as can be judged by their lower URL relevance weights in Table 4.
� � � " K '��� �4K
� J � � � " �� � 4� K .
� � � " � � �
�:���
.�
�
. ! �&� " � �
" ' '
� �
.!
.�
13
.�
8 Conclusion For Web usage mining, the session dissimilarity measure is not a distance metric, and dealing with relational data [6, 7, 8] is impractical given the huge size of the data sets. Therefore, evolutionary techniques which can deal with illdefined features and non-differentiable similarity measures are suitable. Evolutionary techniques [10, 11] can handle a vast array of subjective, even non-metric dissimilarities, making them suitable for many applications in data and Web mining. Also, associations between different URL addresses are discovered with no additional cost. Moreover, they are meaningful only within well defined distinct profiles/contexts (context-sensitive) as opposed to all or none of the data (context-blind). Because of its hierarchical nature and very low population size requirement, H-UNC is significantly faster than UNC for large data sets. However, H-UNC, as well as most existing methods assume that the entire preprocessed Web session data could reside in main memory. This can be a disadvantage for systems with limited main memory in case of huge web session data, since the I/O operations would have to be extensive to shuffle chunks of data in and out of main memory , and thus compromise scalability. Today’s web sites are a source of an exploding amount of clickstream data that can put the scalability of any data mining technique into question. Moreover, the Web access patterns on a web site are very dynamic, due not only to the dynamics of Web site content and structure, but also to changes in the user’s interests, and thus their navigation patterns. The access patterns can be observed to change depending on the time of day, day of week, and according to seasonal patterns or other events in the world. As an alternative to locking the state of the Web access patterns in a frozen state depending on when the Web log data was collected and preprocessed, we proposed an approach that considers the Web usage data as a reflection of a dynamic environment which therefore requires dynamic learning of the access patterns. In this paper, we investigated a new evolutionary approach based on continuously and dynamically learning the Web access patterns from nonstationary Web usage environments. This evolutionary computation based approach can be generalized to fit the needs of mining dynamic data or huge data sets that do not fit in main memory. Our preliminary experiments, performed on real clickstream data, illustrated how an evolutionary algorithm can be used for mining dynamic clickstream data to discover Web user profiles. Being capable to evolve with changing data is a crucial and key characteristic of an evolutionary data mining technique, if it is to be made truly scalable. More experimentation is being currently undertaken to test and extend the proposed approach with regard to scalability to large data sets, using it for clustering text documents/Web content, and incorporating Web content into Web user profiling.
Acknowledgment This work is supported by the National Science Foundation (CAREER Award IIS-0133948 to O. Nasraoui).
References [1] T. Yan, M. Jacobsen, H. Garcia-Molina, and U. Dayal, “From user access patterns to dynamic hypertext linking,” in 5th World Wide Web conference, Paris, 1996. [2] O. Zaiane, M. Xin, and J. Han, “Discovering web access patterns and trends by applying olap and data mining technology on web logs,” in Advances in Digital Libraries, Santa Barbara, CA, 1998, pp. 19–29. [3] M. Perkowitz and O. Etzioni, “Adaptive web sites: Automatically synthesizing web pages,” in AAAI 98, 1998. [4] R. Cooley, B. Mobasher, and J. Srivastava, “Data preparation for mining world wide web browsing patterns,” Knowledge and Information Systems, vol. 1, no. 1, 1999. [5] C. Shahabi, A. M. Zarkesh, J. Abidi, and V. Shah, “Knowledge discovery from users web-page navigation,” in Proceedings of workshop on research issues in Data engineering, Birmingham, England, 1997. [6] O. Nasraoui, R. Krishnapuram, and A. Joshi, “Mining web access logs using a relational clustering algorithm based on a robust estimator,” in NAFIPS Conference, New York, NY, Jun. 1999, pp. 705–709. [7] O. Nasraoui, H. Frigui, R. Krishnapuram, and A. Joshi, “Mining web access logs using relational competitive fuzzy clustering,” in Eighth International World Wide Web Conference, Toronto, Canada, 1999.
14
[8] O. Nasraoui, R. Krishnapuram, H. Frigui, and Joshi A., “Extracting web user profiles using relational competitive fuzzy clustering,” International Journal on Artificial Intelligence Tools, vol. 9, no. 4, pp. 509–526, 2000. [9] O. Nasraoui, R. Krishnapuram, A. Joshi, and T. Kamdar, “Automatic web user profiling and personalization using robust fuzzy relational clustering,” in E-Commerce and Intelligent Methods, in the series Studies in Fuzziness and Soft Computing, J. Segovia, P. Szczepaniak, and M. Niedzwiedzinski, Eds., pp. 233–261. Springer-Verlag, 2002. [10] O. Nasraoui and R. Krishnapuram, “One step evolutionary mining of context sensitive associations and web navigation patterns,” in SIAM conference on Data Mining, Arlington, VA, Apr. 2002. [11] O. Nasraoui and R. Krishnapuram, “A new evolutionary approach to web usage and context sensitive associations mining,” International Journal on Computational Intelligence and Applications, Special Issue on Internet Intelligent Systems, 2002. [12] J. H. Holland, Adaptation in natural and artificial systems, MIT Press, 1975. [13] L. J. Fogel, A. J. Owens, and M. J. Walsh, Artificial Intelligence Through Simulated evolution, Wiley Publishing, New York, 1966. [14] D. E. Goldberg, Genetic algorithms in search, optimization, and machine learning, Addison-Wesley, New York, 1989. [15] Z. Michalewicz, Genetic Algorithms + Data Structures = Evolutionary Programs, Springer Verlag, New York, 1994. [16] K. A. De Jong, “An analysis of the behavior of a class of genetic adaptive systems,” Doct. Diss., U. of Michigan., vol. 36, no. 10-5140B, pp. 29–60, 1975. [17] D. E. Goldberg and J. J. Richardson, “Genetic algorithms with sharing for multimodal function optimization,” in 2nd Intl. Conf. Genetic Algsorithms, Cambridge, MA, Jul. 1987, pp. 41–49. [18] S. W. Mahfoud, “Crowding and preselection revisited,” in Parallel problem Solving from Nature, PPSN ’92, Brussels, 1992. [19] R. Dawkins, The selfish Gene - New Ed, Oxford University Press, Great Britain, 1989. [20] R. Agrawal and R. Srikant, “Fast algorithms for mining association rules,” in 20th VLDB Conference, Santiago, Chile, 1994, pp. 487–499. [21] O. Nasraoui and R. Krishnapuram, “A novel approach to unsupervised robust clustering using genetic niching,” in Ninth IEEE International Conference on Fuzzy Systems, San Antonio, TX, May 2000, pp. 170–175. [22] R. Duda and P. Hart, Pattern Classification and Scene Analysis, Wiley, NY, 1973. [23] D. Goldberg and R. E. Smith, “Nonstationary function optimization using genetic algorithms with diloidy and dominance,” in 2nd International Conference on Genetic Algorithms, J. J. Grefensette, Ed., Lawrence, 1987, pp. 59–68. [24] D. Goldberg, K. Deb, and B. Korb, “Nonstationary messy genetic algorithms: motivation, analysis, and first results,” Complex Systems, vol. 3, pp. 493–530, 1987. [25] H. Kargupta, “The gene expression messy genetic algorithm,” in International Conference on Evolutionary Computation, 1996. [26] A. Wu and I. Garibay, “The proportional genetic algorithm: Gene expression in a genetic algorithm,” Genetic Programming and Evolvable Hardware, vol. 3, no. 2, 2002. [27] W. Wienholt, “A refined genetic algorithm for parameter optimization problems,” in 5th International Conference on Genetic Algorithms, 1993. [28] T. Furuhashi, “Development of if-then rules with the use od dna coding,” in Fuzzy Evolutionary Computation, W. Pedrycz, Ed. Kluwer, 1997.
15
[29] D. K.Burke, J. DeJong, C. Grefensette, and A. Wu, “Putting more genetics into genetic algorithms,” Evolutionary Computation, vol. 6, no. 4, 1998. [30] A. Wu and R. K. Lindsay, “Empirical studies of the genetic algorithm with non-coding segments,” Evolutionary Computation, vol. 3, no. 2, pp. 121–147, 1995. [31] A. Wu and R. K. Lindsay, “A comparison of the fixed and floating building block representation in the genetic algorithm,” Evolutionary Computation, vol. 4, no. 2, pp. 169–193, 1996. [32] D. Dasgupta and D. McGregor, “Nonstationary function optimization using structured genetic algorithm,” in Parallel Problem Solving For Nature Conference, Belgium, 1992. [33] O. Nasraoui, D. Dasgupta, and M. Pavuluri, “s2ga: A soft structured genetic algorithm, and its applications in web mining,” in North American Fuzzy Information Processing Society Conference and Fuzzy Logic and the Internet, New Orleans, June 2002. [34] M. Arita, “Simfly2:simulation of a fly embryo,” in Genome Informatics Workshop, Yokohama, Japan, 1995. [35] R. Reinitz and R. d’Ari, Biological Feedback, CRC Press, 1990. [36] H. deJong and M. Page, “Qualitative simulation of large and complex genetic regulatory systems,” in 14th European Conference on Artificial Intelligence, ECAI 2000, W. Horn (ed.), Amsterdam, 2000, pp. 191–195, IOS-Press. [37] J. Thomas and D. Sharp, “Mechanism of eve stripe formation,” Tech. Rep. LA-UR-94-1915, Los Alamos National Laboratory, 1994. [38] O. Nasraoui and R. Krishnapuram, “Exploiting genetic niching and the baldwin effect to mine an unknown number of clusters in noisy data,” under review, 2002. [39] O. Nasraoui and R. Krishnapuram, “A new evolutionary approach to web usage and context sensitive associations mining,” to appear in International Journal on Computational Intelligence and Applications - Special Issue on Internet Intelligent Systems, vol. 2, no. 3, pp. 339–348, 2002.
16