Biogeosciences Discuss., https://doi.org/10.5194/bg-2018-488 Manuscript under review for journal Biogeosciences Discussion started: 14 December 2018 c Author(s) 2018. CC BY 4.0 License.
1 2 3
From substrate to soil in a pristine environment – pedochemical, micromorphological and microbiological properties from soils on James Ross Island, Antarctica
4 5 6
Lars A. Meier1*, Patryk Krauze2*, Isabel Prater3, Fabian Horn2, Carlos E.G.R. Schaefer4, Thomas Scholten1, Dirk Wagner2, 5, Carsten W. Mueller3, and Peter Kühn1
7 8 9 10 11
1
12
Correspondence to: Lars A. Meier (
[email protected])
13
*shared first authorship
Department of Geosciences, University of Tuebingen, Tuebingen, D-72070, Germany GFZ German Research Centre for Geosciences, Section Geomicrobiology, Potsdam, D-14473, Germany 3 Lehrstuhl für Bodenkunde, TU München, Freising, D-85354, Germany 4 Departamento de Solos, Universidade Federal de Viçosa, Viçosa, BR-36571-000, Brazil 5 Institute for Earth and Environmental Sciences, University of Potsdam, Potsdam, D-14476, Germany 2
14 15 16 17 18 19 20 21 22 23 24 25 26 27 28 29 30 31 32 33 34 35 36 37 38 39 1
Biogeosciences Discuss., https://doi.org/10.5194/bg-2018-488 Manuscript under review for journal Biogeosciences Discussion started: 14 December 2018 c Author(s) 2018. CC BY 4.0 License.
40 41 42 43 44 45 46 47 48 49 50 51 52 53 54 55 56 57 58 59 60 61
Abstract. James Ross Island (JRI) offers the exceptional opportunity to study pedogenesis without the influence of vascular plants or faunal activities (e.g. penguin rookeries) in a landscape marking the transition from maritime to continental Antarctica. Here, primarily microbial communities control soil biological processes and affect soil chemical and physical properties in a semiarid region with mean annual precipitation from 200 to 500mm and mean air temperature below 0°C. The impact of climate change on soil forming processes in this part of Antarctica and its related microbial processes is unknown. In this study, two soil profiles from JRI (one at St. Martha Cove - SMC, and another at Brandy Bay - BB) were investigated by combining pedological, geochemical and microbiological methods. The soil profiles are similar in respect to topographic position and parent material but are spatially separated by an orographic barrier and therefore represent lee- and windward locations towards the mainly south-westerly winds. Opposing trends in the depth functions of pH and differences in ECvalues are caused by additional input of bases by sea spray at BB, the site close to the Prince Gustav Channel. Both soils are classified as Cryosols, dominated by bacterial taxa such as Actinobacteria, Proteobacteria, Acidobacteria, Gemmatimonadates and Chloroflexi. A shift in the dominant taxa in both soils and an increased abundance of multiple operational taxonomic units (OTUs) related to potential chemolithoautotrophic Acidoferrobacteraceae was observed. This shift was accompanied by a change in soil microstructure below 20cm depth, with potential impact on water availability and matter fluxes. Multivariate statistics revealed correlations between the microbial community structure and soil parameters such as chloride, sulfate, calcium and organic carbon contents, grain size distribution, as well as the pedogenic oxide ratio.
62 63 64 65 66 67 68 69 70 71 72 73 74 75 76
2
Biogeosciences Discuss., https://doi.org/10.5194/bg-2018-488 Manuscript under review for journal Biogeosciences Discussion started: 14 December 2018 c Author(s) 2018. CC BY 4.0 License.
77
1 Introduction
78
In extreme environments, like Antarctica, local climatic conditions such as low temperatures, precipitation or irradiance are important and often limiting factors for soil formation. Even though soils in Antarctica are often poorly developed, they can be highly diverse (Michel et al., 2014; Simas et al., 2008; Bockheim et al., 2015). Therefore, soil scientific investigations became a relevant topic in Antarctic research, proofing that there are actually soils in Antarctica (Jensen, 1916) and identifying soil forming processes (Ugolini, 1964). Antarctic soil research is mostly located in Victoria Land, continental Antarctica, especially in the McMurdo Dry Valleys (Michel et al., 2014; Ugolini and Bockheim, 2008), in the South Shetlands, maritime Antarctica (Simas et al., 2015) and the western Antarctic Peninsula Region (APR) (Haus et al., 2015; Hrbáček et al., 2017b; Schaefer et al., 2017; Souza et al., 2014; Pereira et al., 2017). Soils from continental Antarctica are often saline with thick salt horizons (Souza et al., 2014). Due to environmental stressors such as very low temperatures, low water availability, frequent freeze-thaw cycles and limited organic nutrient contents, soils from continental Antarctica show limiting conditions for life (Cary et al., 2010). Nevertheless, suitable edaphic niches like cryptic and refuge habitats, microbial mats and permafrost soils exist that harbor microbial communities (Cowan et al., 2014). Soils in maritime Antarctica and western APR differ from soils in continental Antarctica according to their stage of development (Balks et al., 2013; Blume et al., 2004; Parnikoza et al., 2017). They show extensive cryoturbation processes with occasional salt crusts at the soil surface (Balks et al., 2013; Bockheim, 1997). Local conditions determine nutrient availability in soils, with Ca, Mg, K and P contents being in general high on igneous, volcanic rocks, whereas P and N contents are highest in ornithogenic soils. Soils from the eastern part of the APR (also called Weddell Sea sector) are different, since they are associated with a dry climatic transitional zone between the wet, warmer maritime Antarctica and colder, arid continental Antarctica. Mean temperatures are below 0°C and liquid water supply is sufficient to allow soil forming processes (Souza et al., 2014). Souza et al. (2014) also showed that cryoturbation is less pronounced in the eastern APR than in the South Shetlands. The base saturation (>50%) and electric conductivity (EC) are generally high whereas the amount of total organic carbon (TOC) is substantially low. Regarding cryoturbation, active layer depth, chemical weathering and soil organic C-content, soils from the eastern APR are comparable to soils from inland areas of the Ross Sea Region (Balks et al., 2013), though they are formed on different parent material (Daher et al., 2018). In comparison, the transitional zone of the eastern APR with semiarid soils remains one of the least studied areas in Antarctica (Souza et al., 2014; Daher et al., 2018). Since Microorganisms in Antarctica show a broad diversity as revealed by recent molecular phylogenetic and metagenomic methods (Cowan et al., 2014) and contribute to the weathering of minerals in soils (Uroz et al., 2009), they are pivotal to understand initial soil formation. The bacterial phyla Proteobacteria, Acidobacteria, Actinobacteria, Bacteroidetes, Firmicutes and Gemmatimonadates, commonly found in temperate soils, also dominate the microbial
79 80 81 82 83 84 85 86 87 88 89 90 91 92 93 94 95 96 97 98 99 100 101 102 103 104 105 106 107 108 109 110 111 112 113 114 115 116
3
Biogeosciences Discuss., https://doi.org/10.5194/bg-2018-488 Manuscript under review for journal Biogeosciences Discussion started: 14 December 2018 c Author(s) 2018. CC BY 4.0 License.
143
communities observed in Antarctic habitats (e.g. Bajerski and Wagner, 2013; Cary et al., 2010; Pearce et al., 2012; Chong et al., 2012). The microbial community structure is influenced by local soil chemical parameters, especially pH (e.g. Chong et al., 2010, Siciliano et al., 2014), but also by soil physical parameters such as grain size distribution and soil moisture (Ganzert et al., 2011). Chong et al. (2015) proposed, however, that historical contingency and dispersal limitations could have a stronger influence on differences in community distributions at a regional scale (>1000km). Ganzert et al. (2011) found that at a small scale, microbial activity has a distinct influence on soil chemical parameters and, therefore, on its microbial composition. Conflicting results illustrate the lack in the understanding of drivers of soil microbial diversity in high latitude soils (Cowan et al., 2014). Micromorphological studies in the maritime Antarctica and the western APR described sulphurization and phosphatization in ornithogenic soils and mineral transformation on volcanic rocks (Pereira et al., 2013; Schaefer et al., 2008); and paleosols (Kirshner and Anderson, 2011; Spinola et al., 2017). Even though micromorphology offers the opportunity to study constituents of soil and their mutual relations in space and time and to identify soil forming processes in an undisturbed state (Stoops, 2003), so far no micromorphological study has been published about soil forming processes in the eastern APR that are influenced neither by sulfates nor by birds. Our study sites are located on James Ross Island in the eastern APR and therefore offers a unique setting to study soil formation and microbial communities in a transitional Antarctic landscape between the wet maritime and dry, colder continental Antarctica. We selected two different soils, representing coastal soils and inland soils of James Ross Island, developed on similar substrate and at similar topographic positions. Our study aims to identify major soil and microbiological properties, not influenced by vascular plants, sulfides and penguin rookeries, and their respective depth function and interplays, by combining pedochemical and micromorphological methods with microbial community studies based on high throughput sequence analyses.
144
2. Regional setting of James Ross Island, maritime Antarctica
145
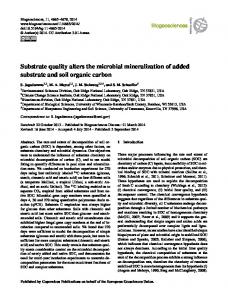
James Ross Island is situated east of the Antarctic Peninsula and is the largest island in the western Weddell Sea sector (Hjort et al., 1997). The study area is located on Ulu Peninsula in the northern part of JRI (Fig. 1). It represents one of the largest ice-free areas of the APR (Nedbalová et al., 2013; Hrbáček et al., 2017b) with the beginning of its deglaciation 12.9 ±1.2 ka ago (Nývlt et al., 2014). More than 300 km² of the JRI lowlands are currently ice-free, except for a few glaciers (Engel et al., 2012).
117 118 119 120 121 122 123 124 125 126 127 128 129 130 131 132 133 134 135 136 137 138 139 140 141 142
146 147 148 149 150 151 152
[ Figure 1 ]
153 154 155
The climate on JRI is semi-arid polar-continental (Martin and Peel, 1978). The precipitation, mostly snow, ranges between 200 to 500 mm of water equivalent per year with the major share 4
Biogeosciences Discuss., https://doi.org/10.5194/bg-2018-488 Manuscript under review for journal Biogeosciences Discussion started: 14 December 2018 c Author(s) 2018. CC BY 4.0 License.
156 157 158 159 160 161 162 163 164 165 166 167
during winter (Davies et al., 2013; Zvěřina et al., 2014). The thickness of the snow cover does not exceed 30 cm, but varies due to strong winds (Hrbáček et al., 2017b; Hrbáček et al., 2016a). The annual air temperature ranges between +10 °C and -30 °C on Ulu Peninsula (Hrbáček et al., 2016a; Láska et al., 2011). The year 2015 marked the warmest summer ever measured on Ulu Peninsula, having a mean seasonal summer temperature (MSST) of 0.0 °C and a maximum air temperature of 13.3 °C (Hrbáček et al., 2017a); even though the mean annual air temperature (MAAT) decreased slightly from -6.8 °C in 2011 to -7°C in 2015 (Hrbáček et al., 2016b; Láska et al., 2012). The two study sites are located at Brandy Bay (BB) near the western coast and at St. Martha Cove (SMC) at the eastern coast of Ulu Peninsula. Both sites are located at similar topographic positions (small plateaus) and elevation (80 m a.s.l.) with no visible vegetation (Fig. 2 and Fig. 3).
168 169 170
[ Figure 2 ] [ Figure 3 ]
171
187
BB is located windward towards the mainly south-westerly winds (Hrbáček et al., 2016c; Nývlt et al., 2016), whereas SMC is located leeward, shielded by the Lachman Crags from the stronger winds. This results in less precipitation in the eastern part of JRI (Davies et al., 2013). Therefore, BB can be considered as a characteristic wind-exposed coastal site with high influence of sea spray, whereas SMC represents a characteristic soil of an inland site with less influence of sea spray. The substrate of both study sites is basically composed of coarse-grained cretaceous sandstones and siltstones of the Alpha Member of the Santa Martha Formation (Hrbáček et al., 2017b). The land surface is generally covered by a debris layer of gravels and large clasts mixed with loose sandy regolith, mostly derived from James Ross Volcanic Group basalts, which were deposited as debris flows containing mainly basalt and hyaloclastite breccia and palagonite (Davies et al., 2013; Hrbáček et al., 2017b; Salzmann et al., 2011). No nesting birds are found on JRI. The continuous permafrost on James Ross Island shows an active layer thickness ranging between 40 and 107 cm related to the topographic position on Ulu Peninsula (Bockheim et al., 2013; Borzotta and Trombotto, 2004).
188
3. Material and Methods
189
3.1 Soil sampling
190
During the austral summer period in 2016 soil samples from BB and SMC (Fig. 4 and Fig. 5) were taken. The amount of coarse material bigger than 2mm was larger at the profile from BB, due to strong wind ablation. The permafrost table was not reached in both soil profiles, but ground ice was visible in a depth of 85cm at SMC, whereas no ice was found in BB. Both
172 173 174 175 176 177 178 179 180 181 182 183 184 185 186
191 192 193
5
Biogeosciences Discuss., https://doi.org/10.5194/bg-2018-488 Manuscript under review for journal Biogeosciences Discussion started: 14 December 2018 c Author(s) 2018. CC BY 4.0 License.
194 195 196 197 198 199 200 201 202 203
profiles were dug until a layer of coarse gravel was found. Bulk samples of both profiles were taken in depth increments (0-5cm, 5-10cm, 10-20cm, 20-50cm, >50cm) and were placed into sterile plastic bags, which were frozen immediately. Continuous cooling at -20°C was ensured by a transfer with the research vessels RV Polarstern to Germany. For micromorphological analyses, undisturbed and oriented samples were taken in modified Kubiena boxes (10cm x 6cm x 5cm). Samples for micromorphology were taken at depth of 0-10cm, 10-20cm, 30-40cm, 50-60cm and 80-90cm at SMC. BB samples represent the depth of 10-20cm, 20-30cm und 4050cm. Soils were described according to Food and Agriculture Organization of the United Nations (FAO) (2006) and classified according to the World Reference Base for Soil Resources (WRB; IUSS Working Group WRB, 2015).
204
206
[ Figure 4 ] [ Figure 5 ]
207
3.2 Soil physical and chemical analysis
208
3.2.1 Grain size distribution
209
216
The samples were saturated (100ml of deionized water) and sonicated (800J ml-1). Coarsemedium sand (>200µm), fine sand (63-200µm) and coarse silt (20-63µm) were obtained by wet sieving. The smaller fractions, including medium silt (6.3-20µm), fine silt (2-6.3µm) and clay (20µm were dried at 45°C and weighed afterwards. The fractions 50
SMC > 50
BB 0-5
20-50
SMC 20-50
BB 5-10
5-10
10-20
0-5
SMC 5-10
[cm]
SMC 0-5
SMC 10-20
1003
Sample
Depth
7.4
7.6
7.7
8.1
8.6
8.1
8
7.9
8
7.7
pHH20
-1
965
505
385
561
950
65
33
33
36
46
[µS cm ]
EC
0.1
0.2
0.07
0.12
0.14
0.02
0.01
0.03
0.01
0.01
[%]
TIC
2.6
2.5
2
2.1
1.4
0.9
0.8
0.9
0.9
0.9
[mg g ]
-1
TOC
-1
0.4
0.4
0.3
0.4
0.4
0.4
0.4
0.4
0.4
0.4
[mg g ]
N
7.4
6.7
5.9
5.6
4
2.1
2.2
2.3
2.5
2.6
C/N
-1
Mg
+
-1
+
Ca
-1
Cl
-
-1
2-
SO 4
-1
23.9
18.3
12.2
16.3
23.4
2.7
1.5
2
2.4
2.5
140
79.8
42.6
57.4
84.6
3.1
2.1
3.1
3.6
4
297
173
93
108
151
6.3
4.9
8.3
9.6
10.4
231
386
369
702
4522
3.5
5.5
8.7
13.1
20.6
451
163
88
123
621
15.3
3
3.3
5.7
9.6
[µmol g ] [µmol g ] [µmol g ] [µmol g ] [µmol g ]
+
K
44.3
44
52.5
46.4
49.8
61.7
61.9
63.8
59.9
61.2
[%]
26.8
27.2
21.9
25.7
25.2
20
17.2
17.1
19.4
18.9
[%]
Silt 2-63 µm
Sand 63 – 2000 µm
28.9
28.8
25.6
27.9
24.9
18.3
20.8
19.1
20.7
19.8
[%]
50
58.2
0.9
0.21
0.54
38.18
7.88
4.24
[cm] 0-5
CIA 53.9
KN-A 0.92
Fed/Fet 0.18
Feo/Fed 0.56
[mg 45.57
SMC 5-10 SMC 1020 SMC 2050 SMC > 50
5-10
54.2
0.91
0.18
0.45
10-20
54.8
0.91
0.16
20-50
54.3
0.91
>50
54.1
BB 0-5
0-5
BB 5-10
5-10
BB 10-20 BB 20-50 BB > 50
29
[mg
g-1]
Feo
7.99
Sample SMC 0-5
g-1]
100.5 100.2 5.47
14
0.9
655
0
35
101
262
92
502
0.1
2.6
2.9
2.0
0.1
5.5
13.7
0.8
1.8
65.1
>50
BB > 50
100.4
4.50
22
0.8
629
0
44
106
240
95
522
0.1
2.6
2.1
2.0
0.1
5.7
14.2
0.9
1.8
66.3
20-50
BB 20-50
101.4
4.16
21
0.9
346
5
24
111
315
83
500
0.2
2.0
2.6
2.4
0.1
6.1
13.9
2.4
0.9
65.5
10-20
BB 10-20
100.2
5.83
19
0.9
390
8
37
112
266
83
502
2.4
1.9
2.5
2.3
0.1
6.3
0.2
14.2
0.9
64.5
5-10
BB 5-10
100.6
4.26
21
1.0
339
14
38
135
362
62
0.3
2.0
2.5
3.7
3.4
0.2
456
7.7
14.5
1.1
60.5
0-5
BB 0-5
100.5
2.51
36
0.9
644
0
39
110
320
545
0.1
2.8
2.0
2.1
1.6
87
0.1
6.0
11.9
1.0
70.2
>50
SMC > 50
101.0
2.73
30
0.9
564
0
49
110
87
528
0.1
2.7
2.0
2.2
276
1.8
0.1
5.8
12.2
0.9
69.6
20-50
SMC 20-50
100.5
3.36
33
0.9
628
0
46
285
90
539
0.1
2.9
2.0
105
2.0
1.5
0.1
5.8
12.1
0.9
70.1
10-20
SMC 10-20
100.3
117
303
80
521
0.2
2.6
[%]
Sum
2.77
58
111
280
84
514
0.2
[%]
LOI
35
La
0.9
Eu
759
Zr
0
-1
55
1.9
2.3
1.9
0.2
6.4
11.9
1.0
69.3
5-10
SMC 5-10
Zn
2.68
-1
40
Y -1
0.9
V -1
717
Sr -1
0
2.7
1.9
2.2
1.9
0.1
6.5
11.6
1.0
69.4
0-5
SMC 0-5
Rb
[mg kg ] [mg kg ] [mg kg ] [mg kg ] [mg kg ] [mg kg ] [mg kg ] [mg kg ] [mg kg ]
-1
-1
Ba -1
[%]
[%]
[%]
[%]
[%]
[%]
[%]
[%]
[%]
[%]
[cm]
-1
P2O 5
K2O
Na2O
CaO
MgO
MnO
Fe 2O 3
Al 2O 3
TiO 2
SiO 2
Depth
1012
Sample
Biogeosciences Discuss., https://doi.org/10.5194/bg-2018-488 Manuscript under review for journal Biogeosciences Discussion started: 14 December 2018 c Author(s) 2018. CC BY 4.0 License.
1009 Table 3: Major elements by XRF of two soil profiles from St. Marta Cove (SMC) and Brandy Bay (BB) from James
1010 Ross Island, Antarctica. Sample names contain information about sample dpth (in cm). LOI (loss on ignition)
1011 determined at 1000°C.
1013
30
1021
10-20
30-40
50-60
80-90
10-20
20-30
40-50
SMC II
SMC III
SMC IV
SMC V
BB I
BB II
BB III
m/h
m
m
w
m/w
w/m
w
w
ds
(x)
spv
x
x
x
x
x
x
x
x
xpv
pl
x
x
x
(x)
x
x
(x)
(x)
w-m sp (msl)
h-m sp
(fis) pgm
msl (hsp)
wsl
pgm
fis / sgm
(x) h-m sp (msl)
x
(x)
(x)
vu
sub/ro
su-ro
sub/su
sub/su
sub/su
sub/su
su
sub/su
RS**
(x)
(x)
x
x
x
(x)
x
cm
x
x
x
(x)
x
x
x
(x)
cg
x
x
oee
x
x
ssee
x
(x)
(x)
x
x
x
(x)
chi
c/f- related distribution
Groundmass
x
(x)
ce
gb
gb
gb
db
db
db
gb
gb
color
x
x
x
x
x
x
x
x
u
x
x
(x)
(x)
x
x
gs
b-Fabric
Micromass
1022
31
: u = undifferentiated, gs = granostriated
: t = typic, a = aggregate
: ro = redoximorphic hypocoatings
: li = link cappings, cap = cappings, pen = pendent
: ld = loose discontinuous
nodules
hp (hypocoatings)
coatings
infillings
Pedofeatures
: gb = greyish brown, db = dark brown
b - Fabric
: cm = coarse monic, cg = chito-gefuric,oee = open equal enaulic ,ssee = single spaced equal enaulic, chi = chitonic, ce = close enaulic
: sub = subrounded, su = subangular, ro = rounded, su-ro = subangular to rounded mineral grains
: msp = moderately separated platy ms, wsp = weakly separated platy ms, msl: moderaltely separated lenticular ms
color
(c/f - R. Distr.)
c/f - Related Distripution
and Sphericity**
RS - Degree of Roundness
Groundmass
: fis = fissure, sgm = single grain ms, pgm = pellicular grain ms, wsl = weakly separated lenticular ms, hsp = highly separated platy ms
ds = degree of separation; h = highly separated, m = moderately separated, w = weakly separated
: hp = highly developed pedality, mp = moderately developed pedality, wp = weakly developed pedality
x
hp
Micros *
: spv = simple packing voids, xpv = complex packing voids, pl = planes, vu = vughs
x
(x)
x
(x)
x
mp
Voids
Microstructure *(M icros)
x
x
Pedality
Aggregation
Voids
Aggregation
0-10
SMC I
[cm] wp
Depth
x
x
x
x
x
t
x
(x)
x
x
a
nodules
x
x
x
(x)
ro
hp
Redoximorphic features
x
x
(x)
li
x
(x)
(x)
x
x
(x)
cap
coatings
x
x
pen
x
x
x
x
x
ld
infllings
Translocation features
Pedofeatures
1014 1015 1016 1017 1018 1019 1020
Slide
Biogeosciences Discuss., https://doi.org/10.5194/bg-2018-488 Manuscript under review for journal Biogeosciences Discussion started: 14 December 2018 c Author(s) 2018. CC BY 4.0 License.
Table 4: Micromorphological features of two soil profiles from St. Marta Cove (SMC) and Brandy Bay (BB) from James Ross Island, Antarctica The micromorphological property is shown by the presence (cross) or absence (no cross). (x) = occasional occurring * Microstructures separated by "/": two different microstructures were found. Microstructures separated by "()": one ms shows partly features of another ms ** Degree of roundness and sphericity results separated by "/": two different degrees were mainly present ; measured at 10x magnification.
Biogeosciences Discuss., https://doi.org/10.5194/bg-2018-488 Manuscript under review for journal Biogeosciences Discussion started: 14 December 2018 c Author(s) 2018. CC BY 4.0 License.
1023
Figures
1024 1025 1026 1027 1028
Figure 1: Regional setting of James Ross Island, Maritime Antarctica. Blue symbols indicate the location of both study sites, Brandy Bay (BB) and St. Marta Cove (SMC). Image credit: Contains modified Copernicus Sentinel data (2016), processed by ESA, CC BY-SA 3.0 IGO. Map credit: Contains modified OpenStreetMap data (2016), CC BY-SA (www.openstreetmap.org/copyright).
32
Biogeosciences Discuss., https://doi.org/10.5194/bg-2018-488 Manuscript under review for journal Biogeosciences Discussion started: 14 December 2018 c Author(s) 2018. CC BY 4.0 License.
1029 1030
Figure 2: Study site St. Marta Cove (SMC). It is not covered with vegetation. A 90 cm deep soil profile was taken.
33
Biogeosciences Discuss., https://doi.org/10.5194/bg-2018-488 Manuscript under review for journal Biogeosciences Discussion started: 14 December 2018 c Author(s) 2018. CC BY 4.0 License.
1031 1032 1033
Figure 3: Study site Brandy Bay (BB) is close to snowfield. It is not covered with vegetation. A 60cm soil profile was taken.
34
Biogeosciences Discuss., https://doi.org/10.5194/bg-2018-488 Manuscript under review for journal Biogeosciences Discussion started: 14 December 2018 c Author(s) 2018. CC BY 4.0 License.
1034 1035
Figure 4: Soil profile St. Marta Cove (SMC). Scale of the tape measure is in cm.
35
Biogeosciences Discuss., https://doi.org/10.5194/bg-2018-488 Manuscript under review for journal Biogeosciences Discussion started: 14 December 2018 c Author(s) 2018. CC BY 4.0 License.
1036 1037
Figure 5: Soil profile Brandy Bay (BB). Scale of the tape measure is in cm.
36
Biogeosciences Discuss., https://doi.org/10.5194/bg-2018-488 Manuscript under review for journal Biogeosciences Discussion started: 14 December 2018 c Author(s) 2018. CC BY 4.0 License.
1038 1039 1040 1041 1042 1043 1044 1045 1046 1047 1048 1049 1050 1051 1052 1053 1054 1055 1056 1057 1058 1059 1060 1061 1062 1063 1064 1065 1066 1067 1068 1069 1070 1071 1072 1073 1074 1075 1076 1077 1078 1079 37
Biogeosciences Discuss., https://doi.org/10.5194/bg-2018-488 Manuscript under review for journal Biogeosciences Discussion started: 14 December 2018 c Author(s) 2018. CC BY 4.0 License.
1080 1081 1082 1083 1084 1085 1086
Figure 6: Images of micromorphological featuress found at Brandy Bay (BB) and St. Marta Cove (SMC). Pictures were taking using plane polarized light (ppl) and crossed polarizers (xpl). (a) BB III: highly separated lenticular platy microstructure, platy aggregates are indicated by green dotted lines, lenticular ms is indicated by black dotted lines, 2.5x, ppl; (b) SMC IV: moderately separated lenticular platy microstructure, indicated by black dotted lines, 2.5x, ppl; (c) SMC I: coarse monic microstructure, 2.5x, ppl; (d) BB II: chitonic c/f-related distribution and thin link cappings (li) on quartz grains, 20x, ppl; (e) BB III: weathered rock fragment covered by silty capping (cap) and also showing a thick pendent (pen) consisting of silty material and mineral grains, 10x, ppl; (f) SMC I: strongly weathered sandstone fragment with former boundaries, indicated by red dotted line, still visible by capping (cap), 5x, ppl; (g) SMC I: weathered volcanic rock fragment with distinct pellicular alteration pattern, 5x, ppl; (h) BB II: weathered and broken volcanic rock fragment with internal volcanic glass and covered by a thin clay capping (cap),(110-120µm), 2.5x, ppl; (i) SMC I: weathered volcanic rock fragment with feldspar phenocrysts; covered by a dusty clay-silt capping (80-100 µm) (cap), 2.5x, ppl; (i) SMC I:; usage of crossed polarizers makes it possible to tell external coating (cap) from altered internal material, border indicated by grey dotted line, 2.5x, xpl.
1087 1088
38
Biogeosciences Discuss., https://doi.org/10.5194/bg-2018-488 Manuscript under review for journal Biogeosciences Discussion started: 14 December 2018 c Author(s) 2018. CC BY 4.0 License.
1089 1090 1091 1092
Figure 7: Relative abundances of phyla and bacterial 16S rRNA qPCR gene abundances of soil profiles from Brandy Bay (BB) and St. Marta Cove (SMC) on James Ross Island, Antarctica. Triplicates are merged. Only phyla with a relative abundance of at least 5% at a given site are shown. The remaining phyla are summarized as “Others”.
39
Biogeosciences Discuss., https://doi.org/10.5194/bg-2018-488 Manuscript under review for journal Biogeosciences Discussion started: 14 December 2018 c Author(s) 2018. CC BY 4.0 License.
1093 1094 1095 1096 1097
Figure 8: Heatmap based on the relative abundances of the observed operational taxonomic units (OTUs) in soil profiles from Brandy Bay (BB) and St. Marta Cove (SMC) on James Ross Island, Antarctica. Only OTUs with a relative abundance of at least 3% in a given sample were included. Samples as well as OTUs were clustered using average linkage hierarchical clustering.
40
Biogeosciences Discuss., https://doi.org/10.5194/bg-2018-488 Manuscript under review for journal Biogeosciences Discussion started: 14 December 2018 c Author(s) 2018. CC BY 4.0 License.
1098 1099 1100 1101 1102 1103
Figure 9: Canonical correlation analysis of the microbial composition of soil profiles from Brandy Bay (BB; black symbol) and St. Marta Cove (SMC; yello symbol) based on Bray-Curtis dissimilarities of the OTU data and its associated environmental parameters. If the Bonferroni corrected p-value was below 0.05, a given environmental parameter was included in the visualization. The amounts of chloride, sulfate, silt, Ca and TOC contents, and the Fed/Fet ratio explained 49.9% of the microbial community composition.
41


![Benzo[a]pyrene bioavailability from pristine soil ... - Semantic Scholar](https://m.moam.info/img/260x300/benzoapyrene-bioavailability-from-pristine-soil-se_5b9a7431097c473d3f8b45f3.jpg)