Index Termsâdevelopmental robotics, body babbling, emer- gence of structure. I. INTRODUCTION. All higher animals display amazing capabilities and control.
From Unknown Sensors and Actuators to Visually Guided Movement Lars Olsson∗ , Chrystopher L. Nehaniv∗† , Daniel Polani∗† Adaptive Systems∗ and Algorithms† Research Groups School of Computer Science University of Hertfordshire College Lane, Hatfield Herts AL10 9AB United Kingdom {L.A.Olsson, C.L.Nehaniv, D.Polani}@herts.ac.uk
Abstract— This paper describes a developmental system implemented on a real robot that learns a model of its own sensory and actuator apparatuses. There is no innate knowledge regarding the modality or representation of the sensoric input and the actuators, and the system relies on generic properties of the robot’s world such as piecewise smooth effects of movement on sensory changes. The robot develops the model of its sensorimotor system by first performing random movements to create an informational map of the sensors. Using this map the robot then learns what effects the different possible actions have on the sensors. After this developmental process the robot can perform simple motion tracking. Index Terms— developmental robotics, body babbling, emergence of structure
I. I NTRODUCTION All higher animals display amazing capabilities and control over their own bodies. They are also able to predict the way in which certain actions affect the environment around them. In order to achieve this, many higher animals go through a number of developmental stages, whereby the nervous system develops and the animal learns to control its own body. In the process of learning a sense of bodily self in young infants, systematic exploration of the sensory and perceptual consequences of their actions plays a major role [20]. For example, young infants perform the same actions over and over again [18], and it has been observed that newborn infants spend up to 20% of their time while awake touching their face with their hands [7]. This can be viewed as exploration of their possible action space as well as a method of learning relations between sensor and motor neurons. This phenomenon, in analogy with the vocal babbling in the early process of language learning, is also called body babbling [12]. The work described in this paper was partially conducted within the EU Integrated Project RobotCub (”Robotic Open-architecture Technology for Cognition, Understanding, and Behaviours”) and was funded by the European Commission through the E5 Unit (Cognition) of FP6-IST under Contract FP6-004370.
In the research area of developmental robotics [11] there are two major driving forces. One is to build more adaptable, autonomous, and sociable robots by drawing inspiration from developmental psychology and neuoscience, and the other major driving force is to also use robots as embodied tools to help the investigation of the devlopment of neural systems and cognitive abilities. Here body babbling has been investigated by a number of researchers to explore the possible sensorimotor space of a specific embodiment. For example, in [2] the authors developed a system performing basic visuomotor behaviors which were categorized by a neural network. In [8] body babbling was used to develop a system capable of imitation. Berthouze and Kuniyoshi [1] also developed a system capable of performing unsupervised learning of visual sensorimotor patterns, where the classification used Kohonen maps. The resulting self-organized Kohonen maps showed four different catergorizes of movement; vertical, ’indepth motions’, horizontal, and a fourth not clearly defined intermediate category. In previous work [14] we investigated how an agent can find structure in its sensory apparatus from raw uninterpreted sensory data. The agent has no innate knowledge about what kind of modalities the sensor data come from, and it does not possess a model of its own physical layout or sensor positions. In this work we take the next step by investigating how the agent, once the structure of the sensory system is discovered, can learn to use its unknown motor system to achieve certain effects in its sensors. To make an analogy, consider the main character in Franz Kafka’s novel Metamorphosis [6], that wakes up one morning and finds his brain “plugged” in to the body of a gigantic cockroach. The brain receives various sensory input but with no discriminable structure. The main character also notices that he can make various movements but he lacks knowledge of the relations between the motor actions and sensory input and is thus completely lost. The goal of this work is to design a system that can be “plugged” in to an unknown body and learn the relationships between sensors and motors, and after a period
of experimentation, manages to perform simple tasks guided by the learned model of its sensors. These ideas are partially inspired by and algorithmically related to work described in [19]. In our experiments we use a SONY AIBO1 robot that acts in the real physical world. This work is also inspired by the more philosophical ideas described in [15], where the authors propose a new theory that tries to answer the major question of what visual experience is and where it occurs. Many traditional theories rest on the idea that the brain somehow produces an internal image of the world. Instead, the authors of [15] propose that seeing is a way of acting to explore the world mediated by the agent’s mastery of the laws of sensorimotor contingencies (SMCs), which are a set of rules of interdepence between movement and stimulation of the sensors. Some of these ideas have been translated into algorithms in [16] and extended in [17]. The structure of this paper is as follows. The next section, section 2, describes the methods used and gives a short overview of information theory and methods to compute the informational distances between sensors. Section 3 describes the performed experiments using a SONY AIBO robot along with a presentation of the results. The final section concludes and discusses some possible future avenues for further work. II. M ETHOD In this section we describe the proposed method. We start by discussing our assumptions about the robot and its environment. Next an overview of the algorithm is presented before each step is presented in detail. A. Assumptions The assumptions of the described method are the following: The robot is in an environment where movement has a piecewise smooth effect on the sensory data produced by some of the sensors. For example, most real world scenarios have this effect on visual sensors unless there is complete darkness or the visual input is random. The same is also true for, for example, infra-red sensors that measure the distance to the closest obstacle, and touch sensors. Another assumption is that the robot is capable of computing the motion flow given a sensory layout of sensors, e.g., optical flow for visual sensors. B. Algorithm The proposed method can be summarized as follows: 1) For t time steps make random movements and save all sensor data as individual time series. 2) Compute the informational distances between all sensors. 3) Using the sensory reconstruction method [14] a sensoritopic map is created. 1 AIBO
is a registered trademark of SONY Corporation.
4) The visual sensors can be found by grouping of sensors with piecewise smooth informational relationship using the sensoritopic map. 5) From the visual sensors with continuous coordinates in the sensoritopic map a discrete map is computed. 6) A uniformly distributed sample of possible actuator settings are tried a number of times and their effects on the discrete representation of the visual field are saved. 7) Given the sensory data from the movements the average effect of each possible actuator setting is computed. The set of all these sensor/actuator combinations are the sensorimotor laws. 8) The set of sensorimotor laws can now be used to perform visually guided movement, like motion tracking and very simple imitation. The input data to the sensory reconstruction method is a number of time series of sensory data, one for each sensor s. Each element in each time series is a real value number normalized in the range [0.0, 1.0]. Thus, there are n time series s1 , s2 , .., sn , one for each sensor, each t time steps long. It is important to note that these time series do not need to be ordered depending on modality, since it is the algorithm that should find the relationships between different sensors. C. Random Movements (1) At this stage nothing about either sensors or actuators is known. The robot should move more or less at random, trying out many different settings of its actuators, without making abrubt changes in too many actuator settings at once, in order to maintain relative continuity. This step is dependent on the particular robot used. D. Information Distances Between Sensors (2) Central to the method described is the informational distance between two sensors. This distance is computed using the information metric [4]. To understand this distance metric a brief introduction to information theory [21] is presented here. Let X be the alphabet of values of a discrete random variable (information source, in this case a sensor) X with a probability mass function p(x), where x ∈ X . Then the entropy, or uncertainty associated with X is X H(X) = − p(x) log2 p(x) (1) x∈X
and the conditional entropy XX H(Y |X) = − p(x, y) log2 p(y|x)
(2)
x∈X y∈Y
is the uncertainty associated with the discrete random variable Y if we know the value of X. In other words, how much more information do we need to fully predict Y once we know X.
The mutual information is the information shared between the two random variables X and Y and is defined as I(X; Y ) = H(X) − H(X|Y ) = H(Y ) − H(Y |X).
(3)
To measure the dissimilarity in the information in two sources Crutchfield’s information distance [4] can be used. The information metric is the sum of two conditional entropies, or formally (4)
d(X, Y ) = H(X|Y ) + H(Y |X).
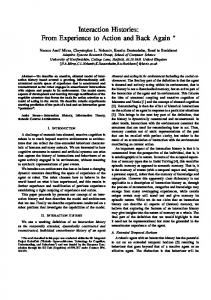
Note that X and Y in our system are information sources whose H(Y |X) and H(X|Y ) are estimated from the time series data from each sensor using equation 2. E. Sensory Reconstruction Method (3) The sensory reconstruction method is a learning algorithm used to find groups of related sensors and a spatialized description of the layout and dimensionality of the sensors, first described in [19] and extended in [14]. For example, if all the sensors in the input are vision sensors from the same visual field, the result should be a two-dimensional layout of the sensors with their relative positions. The input to the algorithm is raw uninterpreted data from a number of different sensors where each sensor is seen as a time series of sensor readings where each element is a normalized real value number. Given these sensors with their time series of data the distance between each pair of sensors is computed using the classical distance metrics [19] or the information metric where each sensor is treated as an information source. Figure 1 shows an example of a sensoritopic map with created with sensor data from a SONY AIBO robot moving around in an office environment.
F. Grouping of Similar Sensors (4) Given the sensoritopic map, the next step is to find a set of these sensors on which movement has piecewise smooth effects. To begin with, find groups of sensors that are similar. Let sensor xi and xj be similar, written xi ≈ x j
if d(xi , xj ) ≤ min{�i , �j }
(5)
where the �s are calculated from the minimum distance to any of its neighbours, �i = 2 minj {d(xi , xj )}. To form closed subgroups, [19] use the related-to relation which is the transitive closure of the ≈ relation. This is computed recursively via i∼j
iff i ≈ j ∨ ∃k : (i ∼ k) ∧ (k ∼ j).
(6)
Given a closed subgroup its dimension can be computed. Let σ 2 (m) be the variance accounted for by dimension m. Then the right number of dimensions can be found by maximizing σ 2 (m) − σ 2 (m + 1). For example, for a set of visual sensors arranged in a two-dimensional grid m = 2. G. From Continuous to Discrete Maps (5) To compute a discrete map from the continuous coordinate map from step 3 we have developed a quite trivial algorithm that, as it has turned out, is quite effective. The algorithm works as follows. Order all points according to their position along the x-axis in the projection with the smallest x-axis √ value first and add them to the list Lall . Pick the first n points from Lall and order them according to their position along the y-axis into list column k , where k is counter that √ is incremented by 1 each n points picked from Lall . Then delete the points in columnk from Lall . Repeat until Lall is empty. Now each list columnk contains the points for one column of the image ordered by k. This assumes that the layout is square. For rectangular layouts first the number of columns and rows must be found.
6
H. Sampling of Actuator Settings (6) Ba
4
La
71 61 91 81 72 62 51 41 52 31 92 82 21 93 83 73 63 42 11 1 53 94 84 32 43 74 22 NR 64 12 2 BRK 95 frk 33 85 75 54 23 TP 96 44 65 13 3 blr 34 tp 86 flk 55 TT 24 14 nt 76 tt 45 66 frr 4 FLP jaw Ir 35 Back Chin HB HF nr BLP FRP BRP ble 56 25 15 np P 46 36 blk 5 87 77 67 Te 26 16 NT 57 97 flr 47 37 27 6 bre 88 78 68 17 brk 58 48 98 NP 7 38 28 99 89 79 69 brr 18 59 100908070 39 29 19 8 BRE 60 49 50 40 3020 9 FLK fle 10 JAW BRR BLE FLE FRK
0 −2
V2
2
FLR
FRR BLK BLR
fre
Da
−6
−4
FRE
−6
−4
−2
0
2
4
V1
Fig. 1. A sensoritopic map created by the sensory reconstruction method taken from [14] using the information metric. In this example there are 150 sensors, including 100 image sensors that are labeled 1-100 to the right in the map.
This step, again, depends on the particular robot used. The aim is to sample, in as much detail as possible, the set of possible actuator settings, to understand how all the different actuator settings affect the sensors. As a simple example, consider a robot with two actuators, a1 and a2 , where a1 , a2 ∈ {−1, 0, 1}. This means that the whole actuator space consists of only 9 possible settings. In most robots this space is much larger, with more actuators, and more possible values (maybe continuous) for each actuator. There might also be a many-to-one mapping between the actuator vectors and the actual values sent to the motor, which means that more than one actuator vector might give the same effect in the motors. Also, for better results each movement needs to be performed several times, resulting in a number of samples of sensor data for each possible movement. This is necessary since optical flow calculations are very sensitive to noise and
the structure of the environment. There might also be moving objects in front of the robot, something that will seriously affect the optical flow calculation. I. Discovering Sensorimotor Laws (7) Each time a particular actuator setting is executed as described in the previous step the sensor readings for each time step are saved for the visual field discretized in step 5. Given this data the average effect of that particular actuator settings (and resulting movement) can be computed by averaging the effect on the sensors for all the times that particular movement was performed. The effect on each sensor is the optical flow computed using the algorithm described in [9]. This requires the discrete map obtained in step 5. Let ~vx,t,s be the optical flow in the sensor x at time step t for actuator setting s, where the sensor readings from all performances of a particular actuator setting have been saved as one long time series. The average effect for actuator setting s, h~vs i, is then h~vs i =
PN
x=1
PT
vx,t,s j=t ~
NT
,
(7)
where N is the number of sensors and T the number of time steps actuator setting s has been performed. With more complex movements, where the optical flow field is different in different parts of the field, the last averaging step can be omitted and the average effect of a certain actuator setting is then a vector field and not one vector.
III. E XPERIMENTS AND R ESULTS A. Experimental Set-up In our experiments we used a SONY AIBO robot interacting in a lab environment. The software was executed remotely on a computer connected to the robot over a dedicated wireless network, using a frame-rate of roughly 25 frames per second for the sensor readings. The AIBO has many degrees of freedom and to simplify the experiments we decided to only use the pan (horizontal movement) and tilt (vertical) motors of the head of the AIBO. To put less strain on the neck of the AIBO (which is the component that most often breaks down), we let the maximum pan and tilt be 0.5 and the minimum −0.5. To move the neck the desired position of the pan and tilt motor are set 100 times per second, adding the value of the corresponding actuator setting each time step, until the maximum or minimum value of the pan or tilt have been reached. In our experiments the possible desired speed, s, for each of the two actuators was limited to five different values, s ∈ {−0.02, −0.01, 0.0, 0.01, 0.02}. The sensors values of each sensor was normalized to values between [0.0, 1.0], similar to [14]. The AIBO was placed in a sitting position overlooking the lab. Each possible actuator vector was executed 15 times. B. Results Figure 2 shows an example of the development of the sensoritopic map of the visual sensors after 50 time steps, where some order can be found, and after 500 time steps, where an approximate layout of the visual sensors has been found.
J. Visually Guided Movement(8)
0
7 17 27
98 6
37 57 47
36 26
67
−1
3
46 56 66
97 87 −2
91
76
77
0
1 V1
(a) 50 frames Fig. 2.
30 29 2
40 50
1
50
2
18
20 19
34
44 14 2212 2 15 3 4 5 11 41 32 13231 25 31 21 42 33 35 45 43 52 51 61 71 55 53 54 62 65 84 72 63 73 94 64 85 75 95 82 9383 96 74 86 92
58 88
24
8
10 9
81
16
60
V2
70 49
79 69
89 7868
V2
1
48
59
60
9
0
99
29 2019
−1
80
30 10 28 39 40
−2
18
70 80 90 100
28
49
48
7 17
6
5
16
15
37
36
58
69 79
68
89
78
99
88 98 −2
3
2 12
13
24
25
57
56
34
45
44
67
66
77
76
87 97
65
85 95
0
63 73
74 93 2
92
51
62 61 72 71 82
83
41
52
53
64
84 94
31 42
43
54
75
86 96
11
33 32
35
55
1 22 21
23
47 46
59
4 14
26
27
38
39
−3
2
38
4
8
100 90
−1
The set of sensorimotor laws can now be used to perform actions where a specific effect on the sensors is desired. For example, if the robot sees a moving object the object can be tracked by performing the action from the set of sensorimotor laws that has the inverse effect on the sensors as the observed object. For example, consider the sensorimotor laws of Figure 3, each associated with a particular actuator setting. To track a particular motion, the robot needs to find the sensorimotor law with effect closest to the perceived movement. Given a set of learned sensorimotor vectors V , find the vector ~v ∈ V , with the shortest distance to the perceived visual movement m, ~ given some distance function d between two vectors. This minimization, min~v∈V d(~v , m), ~ is maybe most naturally computed using d = |~v − m|, ~ which computes the distance between the end points of the two vectors. One could also imagine other distance metrics, for example one where the direction is more important than the speed. When the desired vector ~v is found, the robot can then perform the movement associated with ~v .
81
91 4
V1
(b) 500 frames
Development of the sensoritopic map of the visual sensors.
From this sensoritopic map a discrete map of the visual sensor can be computed using the algorithm described in step 5. Then the possible actuator space was explored as described above. Each possible movement was executed 15 times and the optical flow for each frame computed. The optical flow in each pixel between consecutive frames was highly variable.This high variance has several reasons.
One might be the optical flow algorithm used and another one the light sensitivity of the camera on the AIBO. The properties of the static environment are also important, e.g., light conditions and the colouration of walls and objects, as well as the informational properties of the scene [13]. Of course, moving objects in the environment also highly affect the result. As described before, each movement was performed many times to overcome these problems, and the vectors averaged. The vectors for all sensors are finally averaged for each possible actuator setting. Figure 3 shows 16 of the resulting vectors (the other 8 are omitted for clarity). Vector v1 and v9 correspond to the motor settings (0.02, 0.0) and (0.01, 0.0), respectively. The angles of the vectors do not correspond exactly to the expected value. For example, if the AIBO is sitting straight up and is only executing its pan engine, vectors v1 , v9 , v5 , and v13 , the expected angle of the corresponding vector should be zero. In Figure 3 this is only approximately the case. This, again, is probably due to noise in the environment, the angle of the head while it is moving, and maybe vibrations in the head.
(a) AIBO Robot
(b) View from AIBO
11 10 9 8 7 6 5 4 3 2
3
v
1
3
0
0
1
2
3
4
5
6
7
8
9
10
11
2
v4 1
v v
12
v
5
v2
v11
0
v
v
(c) Pixelated view v
10
1
Fig. 4. Example of experiments with ball. Figure 4(a) shows the AIBO and Figure 4(b) the visual input. Figure 4(c) the pixelated input and Figure 4(d) the perceived optical flow.
13
v v
14
(d) Optical flow
9
16
−1
v
v6
v
15
8
−2
v
7
−3 −2
−1
0
1
2
Fig. 3. Sensorimotor laws. The computed sensorimotor laws (v1 −v16 ) for 16 different actuator settings, where v1 −v8 are actuator settings resulting in faster movements. In this graph v3 and v11 corresponds to tilt movements straight down and v5 and v13 to pan movements to the right (from the robot’s perspective).
Given the motion flow vectors in Figure 3 and their associated actuator settings it is now possible to perform visually guided movement, like object tracking or simple motion imitation. First observe a specific flow in the visual sensors, then find the closest sensorimotor vector using the method in step 8 of the algorithm. Finally execute the actuator settings associated with the closest sensorimotor vector. Figure 4(a) shows the AIBO with an experimenter moving a pink ball from the right to the left of the visual field of the robot. Figure 4 shows an example of the visual input and the pixelated version of the input. The robot captured 20 frames of data and then calculated the average effect on the visual sensors. In Figure 4(d) the flow of the hand and ball between two
consecutive frames is showed. The average motion vector is found by averaging all flow vectors with a magnitude greater than some small constant to get make the computation more robust to noise and to only take into account the parts of the visual field where there is motion. If the robot is moving at the same time, the average motion vector given the actuator settings from 3 can be subtracted from each vector in the flow field. IV. C ONCLUSIONS
AND
F UTURE W ORK
This paper has presented a robotic control system that learns a model of its sensors and actuators starting from raw and uninterpreted sensor data. The robot also lacks innate knowledge of the modality of the sensors and the effect of the actuators. It learns by first creating a sensoritopic map of the sensoric input created from random movement. From this map a subset of the sensors are selected that represent the visual field or possibly another two-dimensional sensor array like touch sensors. Using this visual field the effects of the actuators are found by learning a model of how different actuator settings affect the visual sensors. The results show that the robot can perform simple motion tracking after the
developmental training period is completed. The learning of how the actuators affect the sensors exploits the correlations between the actuators and sensors found by exploring the sensorimotor space of the robot, similar to the body babbling [12] found in human infants and maybe other higher animals. The correlations between sensors and actuators seem to be important for both robots and animals. In [23] Sporns and Edelman hypothesize about how exploratory activity may cause correlations between sensory and motor neurons, something that is important for reducing the number of possible degrees of freedom in motor control (Bernstein’s problem). It might also be advantageous to explore the correlations from an adaptive point of view; if the embodiment changes, e.g., growth or bodily injuries, or if moved to another environment or faced with a complete new task, the motor system needs to adjust its behaviour. In [15] the authors propose that seeing is a way of acting to explore the environment, which is mediated by the agent’s mastery of the laws of sensorimotor contingencies. In an interesting commentary, [3], the author proposes three experiments that could be conducted to validate the proposed theory. One of the proposed experiments is to use goggles that completely scramble the vision, instead of only reversing or inverting as in the traditional experiments with inverting goggles [5]. It would, if the theory of sensorimotor contingencies is correct, be possible to learn to use the scrambling goggles and learn to de-scramble the image. In [14], it was showed that this is possible using the sensory reconstruction method described above. Several avenues for future research lead from the presented work. First of all the performance and robustness of the method should be studied in more detail, including sufficient and necessary conditions for the method to work correctly. Naturally it would also be interesting to increase the resolution of the actuators, as well as the number of actuators, possibly having each motor in each leg be one actuator. Here it would be interesting to explore how limiting the number of degrees of freedom and adding more degrees of freedom as the development continues affect learning, similar in spirit to the work in [10]. It also seems like constraints on perception during development may improve the perceptual efficiency by reducing the information complexity of the perceived environment [22]. This is something that will be explored in future work. Another interesting area to explore is how body babbling can help a robot adapt to different kinds of mechanical or sensory failures. ACKNOWLEDGMENTS We wish to thank the anonymous reviewers for their helpful and insightful comments. R EFERENCES [1] L. Berthouze and Y. Kuniyoshi, “Emergence and categorization of coordinated visual behavior through embodied interaction,” Machine Learning, vol. 31, pp. 187–200, 1998.
[2] L. Berthouze, Y. Shigematsu, and Y. Kuniyoshi, “Dynamic categorization of explorative behaviors for emergence of stable sensorimotor configurations,” in Proceedings of the International Conference on Simulation of Adaptive Behavior (SAB1998), 1998, pp. 67–72. [3] S. J. Blackmore, “Three experiments to test the sensorimotor theory of vision:commentary on a sensorimotor account of vision and visual consciousness by J. Kevin O’Regan and Alva noe,” Behavioral and Brain Sciences, vol. 24, no. 5, pp. 1011–1031, 2001. [4] J. P. Crutchfield, “Information and its Metric,” in Nonlinear Structures in Physical Systems – Pattern Formation, Chaos and Waves, L. Lam and H. C. Morris, Eds. Springer Verlag, 1990, pp. 119–130. [Online]. Available: citeseer.nj.nec.com/crutchfield90information.html [5] C. S. Harris, “Perceptual adaptation to inverted, reversed, and displaced vision,” Psychological review, vol. 72, no. 6, pp. 419–444, 1965. [6] F. Kafka, The Transformation (Metamorphosis) and Other Stories, 1st ed. Penguin Books, 1915/1992. [7] A. Korner and H. Kraemer, “Individual differences in spontaneous oral behavior in neonates,” in Proceedings of the 3rd Symposium on Oral Sensation and Perception, J. Bosma, Ed., 1972, pp. 335–346. [8] Y. Kuniyoshi, Y. Yorozu, M. Inaba, and H. Inoue, “From visuo-motor self learning to early imitation - a neural architecture for humanoid learning,” in International conference on robotics and Automation, 2003, pp. 67–72. [9] B. Lucas and T. Kanade, “An iterative image registration technique with an application to stereo vision,” in Proceedings of 7th International Joint Conference on Artificial Intelligence (IJCAI), 1981, pp. 674–679. [10] M. Lungarella and L. Berthouze, “On the interplay between morphological, neural, and environmental dynamics: a case-study,” Adaptive Behaviour, vol. 10, no. (3/4), pp. 223–241, 2002. [11] M. Lungarella, G. Metta, R. Pfeifer, and G. Sandini, “Developmental robotics: a survey,” Connection Science, vol. 15, no. 4, pp. 151–190, 2004. [12] A. Meltzoff and M. Moore, “Explaining facial imitation: a theoretical model,” Early development and parenting, vol. 6, pp. 179–192, 1997. [13] L. Olsson, C. L. Nehaniv, and D. Polani, “The effects on visual information in a robot in environments with oriented contours,” in Proceedings of the Fourth International Workshop on Epigenetic Robotics: Modeling Cognitive Development in Robotic Systems, ugust 25-27th Genoa, Italy, L. Berthouze, H. Kozima, C. G. Prince, G. Sandini, G. Stojanov, G. Metta, , and C. Balkenius, Eds. Lund University Cognitive Studies, 2004, pp. 83–88. [14] ——, “Sensory channel grouping and structure from uninterpreted sensor data,” in 2004 NASA/DoD Conference on Evolvable Hardware June 24-26, 2004 Seattle, Washington, USA. IEEE Computer Society Press, 2004, pp. 153–160. [15] J. O’Regan and A. Noe, “A sensorimotor account of vision and visual consciousness,” Behavioral and Brain Sciences, vol. 24, no. 5, pp. 1011–1031, 2001. [16] D. Phillipona, J. O’Regan, and J. Nadal, “Is there something out there? inferring space from sensorimotor dependencies,” Neural Computation, vol. 15, no. 9), 2003. [17] ——, “Perception of the structure of the physical world using multimodal unknown sensors and effectors,” Advances in Neural Information Processing Systems, vol. 17, 2004. [18] J. Piaget, The origins of intelligence. Routledge, 1953. [19] D. Pierce and B. Kuipers, “Map learning with uninterpreted sensors and effectors,” Artificial Intelligence, vol. 92, pp. 169–229, 1997. [20] P. Rochat, “Self-perception and action in infancy,” Experimental Brain Research, vol. 123, pp. 102–109, 1998. [21] C. E. Shannon, “A mathematical theory of communication,” Bell System Tech. J., vol. 27, pp. 379–423, 623–656, 1948. [22] A. Slater and S. Johnson, “Visual sensory and perceptual abilities of the newborn: beyond the blooming, buzzing confusion,” in The development of sensory, motor, and cognitive abilities in early infancy: from sensation to cognition, F. Simion and G. Butterworth, Eds. Hove:Psychology Press, 1997, pp. 121–141. [23] O. Sporns and G. Edelman, “Solving Bernstein’s problem: a proposal for the development of coordinated movement by selection,” Child Development, vol. 64, no. 4, pp. 960–981, 1993.