samples collected in the southern North Sea, roughly between 52 and 54" N and ..... may bias growth estimates compared to that of year classes born in 1955-60.
Vol. 88: 19-32,1992
I
MARINE ECOLOGY PROGRESS SERIES Mar. Ecol. Prog. Ser.
1
Published October 29
Density-dependent and independent changes in somatic growth of female North Sea plaice Pleuronectes platessa between 1930 and 1985 as revealed by back-calculation of otoliths A. D.Rijnsdorp, P. I. van Leeuwen Netherlands Institute for Fisheries Research, PO Box 68, 1970 AB IJmuiden. The Netherlands
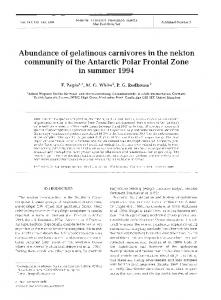
ABSTRACT: Changes in the somatic growth of female plaice Pleuronectes platessa L. between 1930 and 1985 is studied by back-calculation of otoliths. It is shown that in the period 1940-49 growth rate was reduced, which coincided with a 3-fold increase in the plaice stock due to the closure of the fishery during the second world war. The growth reduction was largest in large fish (>45 cm) as compared to medium sized fish (30-40 cm), but could not be detected in the size classes c 20 cm. In large plaice the growth reduction occurred later in time as compared to the medium sized fish. Growth in the immediate pre- and post-war years appeared to be sim~lar.At some time in the 1950s and 1960s a growth acceleration started in the size classes up to 30 cm, levelling off in the 1970s. This growth acceleration was largest in the smallest size classes. Within the period of growth acceleration, the 1963 year class. whlch was about 3 times the average year class strength, showed a slight but significant reduction in growth. The reduction in growth was restricted to size classes c 3 0 cm and was 1a.rgest in smaller fish. It is concluded that growth rate in plaice is reduced at high density both in the juvenile phase (pre-war period and year class 1963) and in the adult phase (period 1940-49). The increase in growth of juven~le plaice starting in the 1950s appears to be related to a n increase in the availability of food in the coastal waters of the southern North Sea.
INTRODUCTION
Growth rate of fish is a characteristic that may show considerable changes in response to food availability, population density and temperature (Weatherley & Gill 1987). In addition, growth rate may be under selective pressure by the fishery (Ricker 1981, Nelson & Soule 1987). In order to evaluate the influence of each of these factors, long time series of growth data are required which are collected in a consistent way. North Sea plaice Pleuronectes platessa L. is a suitable candidate for such an analysis, because this wellstudied species has shown substantial changes in growth and remarkable fluctuations in population density due to the reduced fishing during 2 wartime periods. The older literature, reviewed by Wimpenny (1953) and Bannister (1978), suggests densitydependent growth effects, based on smaller length at age of strong year classes and on a reduced length or
weight at age during war time periods (Borley 1923, Biickmann 1944, Beverton & Holt 1957). More recent studies have been unable to provide convincing evidence for density-dependent growth, although a considerable increase in growth rate of small plaice has been observed in the 1960s and 1970s (Bannister 1978).Rijnsdorp & van Beek (1991) suggested that this increase in growth is related to an increased availability of food. Long term growth studies have a number of inherent difficulties. Firstly, it is always questionable whether age determinations carried out over a long time period by different people have been consistent. In plaice, age determinations have traditionally been carried out using untreated otoliths. This methodology is suitable for ageing the younger, fast growing fish up to about 8 yr old, but may seriously underestimate the age of older, slow growing plaice (Heincke 1908, van Leeuwen & Groeneveld 1988). In addition, a different assump-
20
Mar. Ecol. Prog. Ser. 88: 19-32,1992
tion about the date of birth as the reference to age determinations have been made in the past (1 January, 1 April or variable depending on the appearance of a new growth zone; compare Wallace 1907, 1914). A study of growth in plaice is further complicated because the size- and age-groups are distributed differently (Heincke's law; Wimpenny 1953). Small plaice are concentrated in the shallow coastal and estuarine nursery grounds from where they disperse over the deeper off-shore grounds. Since this dispersion is sizeand age-dependent (Beverton & Holt 1957, Rijnsdorp 1989),it is necessary to take account of the differences in spatial distribution of slow and fast growing fish. This problem can be circumvented for adult fish if sampling is restricted to the spawning period, when the mature plaice gather on the spawning grounds (de Veen 1964). One possible way to overcome sampling and age reading problems is to reconstruct the changes in growth from the pattern of otolith growth employing a back-calculation technique (Southward 1962). The back-calculation technique has been validated for plaice using tagging experiments in combination with tetracycline labeling of otoliths (Rijnsdorp et al. 1990). This paper presents the results of a back-calculation study of female North Sea plaice using otoliths collected between 1948 and 1985. The older fish included in these samples allowed us to look back as far as the late 1920s. We will focus on changes in growth during the period of the second world war (1940-45) as compared to that in the immediate preand post-war years, and to the growth acceleration in the 1.960s and 1970s. Special attention is further given to the question of which size classes of plaice have been particularly affected. The observed changes will be discussed in relation to trends in population abundance.
MATERIAL AND METHODS
Otolith samples. The somatic growth of female plaice in the period 1930-85 wa.s studied by backcalculation of growth patterns in otoliths. Otolith samples collected in the southern North Sea, roughly between 52 and 54" N and 1 and 4" E , and in the spawn.i.ng period between January and March were considered, except for a few otoliths collected in summer 1955. The study was constrained by the availability of otolith samples, since prior to 1958 - when Intensive sampling started in, among other countries, The Netherlands - only limited numbers were available. From the period 1948-55 two sets of otolith samples (otolith sets 2 and 3) were made available by the Fishenes Laboratory Lowestoft (courtesy of
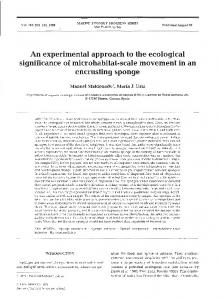
Drs R. S. Millner and J. D. Riley). These otolith sets represent a length stratified random selection of plaice > 25 cm of age 4 to 15, with a few older females up to age 28. In the period 1958-85 otoliths were selected from Dutch market samples belonging to individual year classes sampled at age 4 , 5, 6, 8, 10 to 16 (otolith sets 4 to 7) or from a range of fish sizes in individual years (otolith sets 8 to 10). Although not sampled at the appropriate time and place, additional otoliths collected during summer on coastal grounds just north of Terschelling in 1932 and 1933 (otolith set 1) were analysed to compare estimates of juvenile growth rate from otolith of old fish and of young fish. In total 1421 otoliths of individual females between ages 2 and 28 were studied. A summary of the age composition of the available otolith sets is given in Table 1. A map of the North Sea with the topographical names used is shown in Fig. 1. Back-calculation method. Preparation of otoliths and back-calculation procedure followed Rijnsdorp et al. (1990), of which a short summary follows. One otolith per fish was cut along the lateral plane through the nucleus, polished and burned on a brass plate above a Bunsen gas flame to clarify the pattern of white and dark bands. The burned otoliths were mounted in plasticine and read with a binocular microscope under reflected light. The outer tips of the hyaline bands were drawn on paper using a drawing mirror at a magnification of 24x and the maximum diameter of each annulus was measured from the drawing with a ruler in units of 0.5 mm. The measurements were all taken using the main axis of growth of the otolith.The length at the time of annulus formation L, was calculated according to
where L, = length at capture; Oi= otolith diameter of the ith annulus in the otolith; 0,= diameter of the total otolith; a = proportionality coefficient; and P = backcalculation coefficient estimated from the relationship between fish length and otolith width ( P = 1.364). Rijnsdorp et al. (1990) presented evidence for the validity and accuracy of the back-calculation method and further showed that the time of annulus formation corresponds to 1 April. Since it was our pu.rpose to reconstruct growth rate of plaice as far back in time as possible, we have used otoliths of very old females, which need special treatment. Fig. 2 shows a drawing of a transversal section of a burned otolith of a 23 yr old female plaice. The pattern of light and dark zones can be recognized easily in the central parts of the otolith, but at the periphery the annuli become densely packed. The age can be estimated most easily by
21
Rilnsdorp & van Leeuwen. Growth of North Sea plaice
Table 1. Pleuronectesplatessa. Summary of the available otolith samples used Sampling type indicates whether the otoliths w e r e sampled from a size-range of plaice (S) or from a particular year-class (Y) Otolith set: Type: Year/Year class:
1 S 1932-33
2 S 1948-51
3 S 1955
4 Y 1955-61
5 Y 1963
6 Y 1969
7 Y 1972-74
8 S 1982-85
9 S 1960
10 S 1974
1 10 5 32 17 8 6 6 5 6 2 0
0 0 1 4 8 3 0 5 4 13 22 7
0 0 2 2 4 5 6 0 1 6 0 3
0 2 51 23 35 48 43 41 26 23 0 0
0 0 39 43 33 0 36 0 33 0 18 0
0 0 40 43 41 0 39 0 28 0 0 0
0 4 50 50 47 9 15 20 14 6 0 0
0 8 35 28 28 22 9 9 8 5 0 0
0 0 6 7 10 11 9 2 7 24 5 5
0 12 6 7 9 3 5 1 2 24 15 5
98
67
29
292
202
191
215
152
86
89
Age 2 3 4 5 6 7 8 9 10 11-15 16-20 20-30
Total
counting the annuli from the centre to the arrow B. Drawing the outer tips of the annuli, projected on the major growth axis A-A, however, becomes difficult in the peripheral zone. The dense packing of annuli along the major axis is d u e to a change In the direction of growth of the otolith, which occurred around age 10. Up to this age, the annuli were laid down in the posterior-anterior direction, whereas beyond this a g e the direction of growth shifted more and more to
the dorso-ventral axis. This change in the axis of growth occurs gradually. When the packing of annuli along the major growth axis became so dense that the individual annuli could no longer be distinguished, the diameter was interpolated between the ultimate otolith size a n d the size of the last annuli which could be effectively distinguished. This is indicated by the dashed lines in Fig. 2. Interpolation of otolith measurements implies that within the year range that corresponds to the interpolated annuli, no differences in growth could be distinguished between individual years. Interpolation occurred in about 30 % of the females beyond a g e 12 or size >45 cm. The back-calculation method assumes that the curvilinear relationship between otolith width a n d body size as estimated for the population also applies to individual females, or in other words that the backcalculation coefficient p in Eq. 1 applies to individual females. It is likely, however, that individual females will differ in the body size at which the change in direction of growth of the otolith starts, as well as in the extent to which this occurs. Deviations of the individual back-calculation coefficient from the population estimate will introduce a bias in the estimated growth curve of that individual. If ~ l n d l v l d u a>Ppopulallon l the growth at early ages will be overestimated a n d the growth at older ages wlll be underestimated. Since the otolith width body size relationship was determined over a range of body sizes from 8 to 60 cm, only otoliths of fish < 60 cm were included in the analysis. Although individual growth curves may be biased to some degree, the average growth estimates should be unbiased. -
Fig 1. North Sea with the topographical names used m thls study
Mar. Ecol. Prog. Ser. 88: 19-32. 1992
Fig. 2. Pleuronectes platessa. Drawing of a transversal section of an otolith of a female plaice caught on 18 June 1955 (no. 18, set 3). The a g e was estimated at 23 yr. Otolith measurements for back-calculation were made along the main axis of growth A-A. Age determination employed the axis in direction B, which facilitated the determination of the annuli. Around age 10 the direction of otolith growth gradually changed and new growth zones were increasingly laid in the ventral-dorsal direction. The zone between the dashed (A) and the dotted lines (a) shows where otolith measurements were interpolated because annuli could no longer be recognised individually along the main axis of growth A-A
RESULTS
The average back-calculated lengths for females born in various periods since 1925, omitting females sampled at an age < 6 yr (see below), show that the present growth rate (year classes 1970-79) is substantially higher (t-test, p < 0.05) than in year classes born before 1950 (Fig. 3). The length of the year classes born in 1935-39 is higher than those born in 1940-49 up to a g e 6 but then becomes smaller, the difference being significant for ages 2 to 5 (t-test, p