Anal Bioanal Chem (2014) 406:329–344 DOI 10.1007/s00216-013-7436-6
RESEARCH PAPER
Fully automated trace level determination of parent and alkylated PAHs in environmental waters by online SPE-LC-APPI-MS/MS Cesar E. Ramirez & Chengtao Wang & Piero R. Gardinali
Received: 2 July 2013 / Revised: 9 October 2013 / Accepted: 14 October 2013 / Published online: 12 November 2013 # Springer-Verlag Berlin Heidelberg 2013
Abstract Polycyclic aromatic hydrocarbons (PAHs) are ubiquitous compounds that enter the environment from natural and anthropogenic sources, often used as markers to determine the extent, fate, and potential effects on natural resources after a crude oil accidental release. Gas chromatography-mass spectrometry (GC-MS) after liquid– liquid extraction (LLE+GC-MS) has been extensively used to isolate and quantify both parent and alkylated PAHs. However, it requires labor-intensive extraction and cleanup steps and generates large amounts of toxic solvent waste. Therefore, there is a clear need for greener, faster techniques with enough reproducibility and sensitivity to quantify many PAHs in large numbers of water samples in a short period of time. This study combines online solid-phase extraction followed by liquid chromatography (LC) separation with dopant-assisted atmospheric pressure photoionization (APPI) and tandem MS detection, to provide a one-step protocol that detects PAHs at low nanograms per liter with almost no sample preparation and with a significantly lower
Electronic supplementary material The online version of this article (doi:10.1007/s00216-013-7436-6) contains supplementary material, which is available to authorized users. C. E. Ramirez : C. Wang : P. R. Gardinali (*) Department of Chemistry and Biochemistry, Florida International University, 3000 NE 151st ST, FIU Biscayne Bay Campus, MSB-350, North Miami Beach, FL 33181, USA e-mail:
[email protected] C. E. Ramirez e-mail:
[email protected] C. Wang e-mail:
[email protected] C. E. Ramirez : C. Wang : P. R. Gardinali Southeast Environmental Research Center, Florida International University, 3000 NE 151st ST, FIU Biscayne Bay Campus, MSB-350, North Miami Beach, FL 33181, USA
consumption of toxic halogenated solvents. Water samples were amended with methanol, fortified with isotopically labeled PAHs, and loaded onto an online SPE column, using a large-volume sample loop with an auxiliary LC pump for sample preconcentration and salt removal. The loaded SPE column was connected to an UPLC pump and analytes were backflushed to a Thermo Hypersil Green PAH analytical column where a 20-min gradient separation was performed at a variable flow rate. Detection was performed by a triplequadrupole MS equipped with a gas-phase dopant delivery system, using 1.50 mL of chlorobenzene dopant per run. In contrast, LLE+GC-MS typically use 150 mL of organic solvents per sample, and methylene chloride is preferred because of its low boiling point. However, this solvent has a higher environmental persistence than chlorobenzene and is considered a carcinogen. The automated system is capable of performing injection, online SPE, inorganic species removal, LC separation, and MS/MS detection in 28 min. Selective reaction monitoring was used to detect 28 parent PAHs and 15 families of alkylated PAHs. The methodology is comparable to traditional GC-MS and was tested with surface seawater, rainwater runoff, and a wastewater treatment plant effluent. Positive detections above reporting limits are described. The virtual absence of sample preparation could be particularly advantageous for real-time monitoring of discharge events that introduce PAHs into environmental compartments, such as accidental releases of petroleum derivates and other humanrelated events. This work covers optimization of APPI detection and SPE extraction efficiency, a comparison with LLE+GC-MS in terms of sensitivity and chromatographic resolution, and examples of environmental applications.
Keywords PAHs . Online SPE . Dopant-assisted APPI . LC-MS/MS . Seawater . Reclaimed water . Rainwater runoff . Alkylated PAHs . Gas-phase dopant delivery
330
Introduction Polycyclic aromatic hydrocarbons (PAHs) are persistent organic pollutants produced by both human activities and natural phenomena. PAHs enter surface waters mainly by atmospheric fallout, urban runoff, municipal and industrial effluents, and the spill or leakage of petroleum and its derivates [1, 2]. Petroleum-derived mixtures contain large amounts of PAHs [3] and these compounds are often used as markers to determine the source, fate, and potential effects on natural resources after such substances are released to the environment [4, 5]. Many PAHs have been found to have toxic, carcinogenic, and mutagenic properties [6, 7], which have prompted the imposition of strict regulations on their releases in industrial and municipal effluents and their concentrations in environmental waters and drinking water supplies. Both the United States Environmental Protection Agency (USEPA) and the European Union have considered at least 16 parent PAHs as priority pollutants for environmental monitoring purposes [8]. Well-established methodologies are available for the analysis of PAHs in waste and surface waters, usually involving liquid–liquid extraction (LLE) with n -hexane, toluene, benzene, methylene chloride, or cyclohexane [1], followed by cleanup steps and detection by gas chromatography mass spectrometry (GC-MS) [9–12] or by liquid chromatography with fluorescence detection (LC-FLD) [9, 13]. However, LLE requires a high volume of sample, is labor intensive, and time consuming which severely limits sample throughput and also uses a large amount of organic solvents which are evaporated to concentrate the analytes and released into the atmosphere causing environmental concerns [1, 14, 15]. Due to its low boiling point (40 °C), methylene chloride is the preferred solvent for LLE in order to minimize losses of volatile PAHs by performing low-temperature evaporations. However, this halogenated solvent is considered a carcinogen and has a relatively high environmental persistence [16, 17]. LC-FLD is limited in application to a low number of PAHs since LC cannot fully resolve PAHs in complex mixtures and FLD is a nonselective detector. GC-MS combines an excellent chromatographic resolution due to the use of capillary columns with a mass selective detector and thus can be used for the detection of a large number of PAHs including isomers and alkylated PAHs and therefore has been the preferred technique for the analysis of these compounds [18]. A mass selective methodology comparable to GC-MS in sensitivity and chromatographic resolution, but with a faster preconcentration technique and lower emissions of halogenated solvent waste, could be highly desirable to laboratories monitoring PAHs in environmental waters and discharged effluents. The use of solid-phase extraction (SPE) has been reported as an alternative to LLE for sample preparation for PAH
C.E. Ramirez et al.
analysis. Sorbents, extraction, and elution conditions have been previously documented [19]. Although examples of offline SPE used as sample preparation step for LC analysis of PAHs are available in the literature, reports of online SPELC methodologies for that purpose are scarcer. Renner et al. [20] first reported the use of online SPE coupled with LC with fluorescence detection (SPE-LC-FLD) to analyze 16 PAHs in 50 mL of freshwater samples, while Li et al. [21] used the same SPE-LC-FLD technique for the analysis of 15 PAHs in 100 mL of seawater from the Japan Sea. These studies were limited by the interferences caused by the nonselective nature of the FLD detection. Gimeno et al. [22] analyzed 10 PAHs in 25 mL of seawater using online SPE with a single-quadrupole mass spectrometer (SPE-LC-MS) equipped with atmospheric pressure chemical ionization (APCI). Traditional MS ionization techniques such as APCI or ESI suffer from low ionization efficiency when applied to PAH analysis, due to the absence of adequate chemical groups (i.e., proton donors/ acceptors) in these analytes. The sensitivity of LC-MS detection of PAHs significantly increased with the introduction of atmospheric pressure photoionization (APPI), released independently by Bruins et al. [23] and Syage et al. [24]. With this technique, an electron is removed from molecules with lower ionization energies than that of vacuum ultraviolet radiation to which they are subjected to, obtaining single-charged molecular ions [23]. Furthermore, Bruins also demonstrated the concept of dopant-assisted APPI, in which an intermediary compound is introduced at high concentrations into the APPI source, producing large amounts of ions which in turn undergo a kinetically favored charge transfer with the eluting analytes, with a substantial sensitivity gain relative to dopant-free photoionization. Although dopant-assisted APPI is now widely used to analyze parent PAHs by LC-MS [25, 26], no previous reports are available on its use as detection for online SPE-LC applications to quantify PAHs. The three previously published online SPE methods for the analysis of PAHs in waters shared the same approach: passing a large volume of water through a reverse phase column used for SPE purposes by means of a LC pump connected between the column and the sample. This process requires sample filtration to avoid pump failure and large volumes of solvent for rinsing the pump mechanism in order to avoid carryover. Sample filtration effectively eliminates the possibility of analyzing PAHs that may be adsorbed on suspended particles, which is a desirable ability for certain applications such as the analysis of rainwater runoff from impervious surfaces [27]. This approach is also not amenable to automation and does not completely eliminate the time consumption disadvantage of the traditional LLE+GC-MS technique, with the added caveat of detecting fewer number of PAHs due to the lower chromatographic resolution offered by the employed LC separations. However, passing samples through the SPE pump
Automated determination of parent and alkylated PAHs in waters
mechanism can be avoided by performing injections into large-volume sample loops connected between the pump and the SPE column, an approach that is now well established for online SPE applications and allows for sample handling by automated autosamplers [28–30]. The objective of this study was to develop a fast, fully automated protocol for the determination of a large number of both parents and alkylated PAHs in environmental waters, using online SPE coupled with LC and tandem mass spectrometry detection by means of a dopant-assisted atmospheric pressure photoionization interface (online SPELC-APPI-MS/MS). Conditions for SPE extraction, carryover control, LC separation, and APPI-MS/MS detection were optimized. A comparison between the developed method and LLE+GC-MS in terms of chromatographic resolution and sensitivity was performed, and examples of environmental applications are presented.
Materials and reagents Certified PAH and isotopically labeled PAH standard mixtures were purchased from Accustandard (New Haven, CT, USA). Additional single PAH standards were also obtained from Accustandard and from Sigma-Aldrich (St. Louis, MO, USA). Standard reference materials (SRM 2260a and SRM 1491a) were obtained from NIST (Gaithersburg, MD, USA). Stock solutions were stored at −20 °C until needed. LC/MS grade acetonitrile, water, and methanol were purchased from Fisher Scientific (Fairlawn, NJ, USA). Chlorobenzene dopant (extra dry, 99.8 % pure) was purchased from Acros Organics (Geel, Belgium) and used as received. Artificial seawater (3.5 % w/v) was prepared using the commercially available Instant Ocean® salt. Online preconcentration was performed using an EQuan online SPE system (Thermo Scientific, Waltham, MA, USA), consisting of an HTC-PAL™ autosampler (equipped with a 5-mL glass syringe), an Accela™ 1000 as analytical HPLC pump, and an Accela™ 600 as SPE loading pump. Stainless steel sample loops (models CSL5K and CSL10K, 5 and 10 mL, respectively) were obtained from Valco Instruments (Houston, TX, USA). The online SPE column was a Hypersil Gold aQ® (20 mm×2.1 mm, 12 μm). Analytical separations were carried out using a Hypersil Green PAH® column (150× 2.1 mm, 3 μm), protected by a Hypersil Green PAH® guard column (10×2.1 mm, 3 μm). All columns were also obtained from Thermo Scientific. Stainless steel tubing was used throughout the SPE-LC-MS/MS system. Detection was performed on a TSQ Quantum Access™ triple-quadrupole mass spectrometer, equipped with an Ion Max API source with a vaporizer probe (Thermo Scientific) and a Photomate® APPI krypton lamp (Syagen, Santa Ana, CA. USA.). The EQuan system was controlled using the Xcalibur 2.1 data
331
acquisition software (Thermo Scientific). Dopant was delivered using the combined output of two Fusion 100 programmable syringe pumps (Chemyx, Stafford, TX, USA), each equipped with two 10-mL Gastight® syringes (Hamilton, Reno, NV, USA). Comparative GC-MS studies were performed using a TSQ Quantum XLS™ triplequadrupole mass spectrometer (Thermo Scientific), using 70 eV EI ionization and single ion monitoring scan mode. GC separation was made by a Trace GC Ultra™ gas chromatograph, equipped with a Triplus™ autosampler (Thermo Scientific) and an Rtx®-5MS (30 m, 0.025 mm ID) capillary GC column (Restek, Bellefonte, PA, USA.).
Environmental sample collection All glassware used to collect and store samples was cleaned by heating to 450 °C for at least 6 h before use. Field samples were collected using 60-mL amber glass vials rinsed once with surface water, filled, and capped with PTFE-lined plastic caps without leaving air inside. Vials were then placed in plastic bags and transported to the laboratory on ice. A sampling blank, consisting of a 60-mL vial filled with artificial seawater, was placed on ice and transported during sampling. Seawater samples were collected in a single trip during August 2012 around Northern Biscayne Bay, adjacent to the Miami metropolitan area. Two reclaimed water samples were collected from the North District Wastewater Treatment Plant in the Miami-Dade County during August and September 2012. Rainwater runoff samples were collected during a heavy rain event in June 2013 from the drainage openings at two parking lots from the Florida International University (FIU) Biscayne Bay campus and from the parking lot of a nearby residential complex. A reference rainwater sample was collected during the same event using a 1-L amber glass bottle and a glass funnel. All samples were stored at 4 °C. Seawater samples were analyzed no more than 14 days after collection. Rainwater, rainwater runoff, and reclaimed waters were analyzed within 24 h of collection.
Analytical methodology Sample preparation Working solutions of all PAHs were prepared each analysis day in methanol from stock solutions or certified standards. Refrigerated samples were allowed to reach room temperature before preparation. Vials were vigorously shaken for at least 20 s and 10 mL aliquots of raw water samples were transferred directly from the sampling containers into a 10-mL LC vials containing 0.55 mL of a methanol solution of isotopically labeled PAHs and 0.45 mL of water. The resulting solutions
332
contained 5 % methanol and 95 % water with 100 ng/L of each isotopically labeled PAH. Solutions were capped, thoroughly mixed, and loaded into the online SPE system without further treatment. Matrix-matched calibration solutions (5–500 ng/L) were prepared using the same procedure, using artificial seawater and working solutions containing analytes and internal standards in methanol. A seven-point set of calibration solutions was freshly prepared for each analysis batch. Online SPE-LC-MS/MS The samples, quality controls, and calibration solutions were loaded onto the 10 mL stainless steel loop (rotary valve A, Fig. 1). The SPE column was placed in a second rotary valve (valve B, Fig. 1), allowing connection with either the loading pump or the analytical pump. Analysis steps, determined by valve turning events, are graphically presented in Fig. 1. At step 1, valve A turns and connects the filled sample loop with the SPE column, and a 5-mV, 1,000-ms electronic start signal is sent to all devices including the programmable dopant syringe pumps. Ten milliliters of sample is passed through the SPE column
Fig. 1 Online SPE system and automated analysis steps. Active flows are shown by arrows and thicker lines. Red: sample and PAHs. Blue: mobile phases
C.E. Ramirez et al.
within 5 min, followed by 2 mL of 1 % methanol in water to remove inorganic species. Then, 0.5 mL of a short gradient to 60 % methanol and 0.5 mL of 60 % methanol are passed to prepare the SPE column for connection with the organic-rich analytical stream. Additionally, during this step, the analytical column is taken to initial gradient conditions. Valve B turns at 8 min and step 2 begins. The SPE column is connected with the analytical column and gradient separation is started, while the sample loop is completely filled with methanol from the SPE LC pump. At 15 min, valve A turns (step 3) and the methanol-filled sample loop is connected with the injection port. The autosampler sequentially injects 5 mL of methanol, 5 mL of water, and two 5-mL portions of the next sample in the queue while the chromatographic separation continues. Finally, at 24 min, valve B turns again (step 4) and connects the SPE LC pump with the SPE column, which is then cleaned with 1 mL of acetonitrile and progressively taken to the highly aqueous initial conditions. The system is now ready to start the cycle for the next sample that is already preloaded in the sample loop. These steps add to a total run time of 28 min per sample. The programs for all pumps are shown in Table 1.
Automated determination of parent and alkylated PAHs in waters
333
Table 1 Solvent delivery programs for all pumps. (Mobile phases are A (water), B (methanol), and C (acetonitrile))
Dopant-assisted APPI-MS/MS detection The mass spectrometer was operated under APPI in the positive mode. The following parameters were used for all analytes: skimmer offset, −10 V; sheath gas (N2), 40 arbitrary units; auxiliary gas (N 2 ), 20 arbitrary units; capillary temperature, 250 °C; vaporizer temperature, 250 °C; collision gas (Ar) pressure, 2.1 mTorr; scan time, 0.020 s; and scan width, 0.020 m /z. In order to reduce unnecessary instrument scans, two detection segments were used (segment 1, 8–18 min, and segment 2, 18–28 min). Chlorobenzene dopant was introduced to the APPI source only during the detection period (8–28 min) through the nitrogen auxiliary gas line, delivered by two programmable syringe pumps operating simultaneously for total flow rate of 10 % of that of the column eluent (see Table 1). Selective reaction monitoring (SRM) scan events were obtained by direct infusion of individual PAH solutions and are listed in Table 2.
Results and discussion Optimization of dopant-assisted APPI detection The effects of lamp energies, mobile phases, and other conditions for the detection of PAHs by APPI-MS have been discussed before [31, 32]. Smith et al. [33] compared the performance of different dopants and dopant mixtures for PAH detection by APPI, concluding that pure chlorobenzene provides efficient charge transfer ionization for all PAH in the presence of water, methanol, and acetonitrile; thus, commercially available
high-purity chlorobenzene was used as dopant in this study without any treatment. Under these conditions, a strong positive molecular ion (M+· ) for each analyte was always observed and isolated as the precursor ion for the SRM scan events, which is consistent with observations by other authors that have used chlorobenzene as dopant for APPI-LC-MS analysis of PAHs [26]. There are two types of APPI sources commercially available: the linear Photospray® (available only for AB SCIEX instruments) and the orthogonal Photomate source used in this study. Dopant delivery in almost every APPI application using the Photomate source has been performed by post-column mixing with the LC eluent, because this system is not equipped with an independent dopant delivery line, which is standard for the Photospray source [25]. However, high backpressure and low miscibility of the dopant with reverse phase mobile phases can introduce background noise that affects source stability and can also cause peak shape degradation [25, 34]. The only report of gas-phase dopant delivery for the Photomate source was made by Ehrenhauser et al. [34]. These authors used an inhouse made evaporation system located in line with the nitrogen supply, with a large dopant reservoir that enabled long-term operation but requires custom-made parts and is therefore difficult to implement. In the original Photospray publication, Bruins et al. [23] delivered the dopant directly into the vaporizer probe from a syringe pump by means of a fused silica capillary introduced with a tee connection at the nebulizer gas supply line. Our laboratory slightly modified the latter approach by using two programmable syringe pumps and a spraying device placed in the auxiliary nitrogen gas stream (Fig. 2), which can be easily constructed from commercially available parts. With this
334
C.E. Ramirez et al.
Table 2 Summary of PAH compounds and their SRM scan events for PAHs tested with this method (bold: 16 USEPA priority PAHs, italic: labeled PAH internal standards) PAH
CAS number
M+• ion (m/z)
Quant. product (m/z)
CE (V)
Confirm. product (m/z)
CE (V)
Confirm. product int. (%)a
Tube lens (V)
RT (min)
Scan seg.b
Acenaphthene Acenaphthene-D10 Acenaphthylene Anthanthrene Anthracene Benz[a]anthracene Benzo[a]fluoranthene Benzo[a]pyrene Benzo[a]pyrene-D12 Benzo[b]fluoranthene, perylenec Benzo[b]fluorene Benzo[c]phenanthrene Benzo[e]pyrene, benzo[j]fluoranthenec Benzo[g,h,i]perylene Benzo[k]fluoranthene Biphenyl C1-chrysenes C1-dibenzothiophenes C1-fluoranthenes/pyrenes C1-fluorenes C1-naphthalenes C1-phenanthrenes/anthracenes C2-dibenzothiophenes C2-naphthalenes C2-phenanthrenes/anthracenes C3-naphthalenes C4-phenanthrenes/anthracenes Carbazole Chrysene Chrysene-D12 Dibenz[a,h]anthracene Dibenzothiophene Fluoranthene Fluorene Fluorene-D10 Indeno[1,2,3-cd]pyrene Naphthalene Naphthalene-D8 Naphthobenzothiophene Perylene-D12 Phenanthrene Phenanthrene-D10 Pyrene Triphenylene
83-32-9 15067-26-2 208-96-8 191-26-4 120-12-7 56-55-3 203-33-8 50-32-8 63466-71-7 205-99-2, 198-55-0
154 164 152 276 178 228 252 252 264 252
153 162 151 274 176 226 250 250 260 250
16 23 16 43 29 35 73 73 51 73
152 160 150 272 152 225 248 248 236 248
29 35 23 69 22 52 41 41 47 41
72 70 50 99 54 22 38 42 15 38
82 72 69 108 82 92 120 120 82 120
13.1 12.9 12.1 24.2 14.9 17.6 18.5 20.3 20.0 19.1
1 1 1 2 1 1+2 1+2 1+2 2 1+2
243-17-4 195-19-7 192-97-2, 205-82-3
216 228 252
215 226 250
14 35 73
213 225 248
38 52 41
50 24 37
53 92 120
17.4 16.3 18.8
1+2 1+2 1+2
191-24-2 207-08-9 92-52-4 – – – – – – – – – – – 86-74-8 218-01-9 1719-03-5 53-70-3 132-65-0 206-44-0 86-73-7 81103-79-9 193-39-5 91-20-3 1146-65-2 239-35-0 1520-96-3 85-01-8 1517-22-2 129-00-0 217-59-4
276 252 154 242 198 216 180 142 192 212 156 206 170 234 167 228 240 278 184 202 166 176 276 128 136 234 264 178 188 202 228
274 250 152 239 197 215 165 141 191 211 141 189 155 219 166 226 236 276 152 200 165 174 274 127 134 202 260 176 184 200 226
43 73 29 42 10 14 19 21 22 20 19 39 18 11 40 35 37 42 30 40 21 28 43 25 30 25 51 29 40 40 35
272 248 153 241 165 213 164 115 189 152 115 191 153 204 165 225 212 274 139 199 164 172 272 102 108 189 236 152 160 199 225
69 41 16 22 25 38 35 32 40 39 33 22 30 22 40 52 34 65 39 57 33 38 69 20 30 33 47 22 32 57 52
60 35 90 65 49 50 21 71 90 30 60 58 34 75 13 22 14 62 90 16 23 21 48 90 59 90 9 75 98 20 23
108 120 82 80 68 53 53 57 67 83 55 137 75 10 80 92 108 105 85 73 101 65 108 48 80 100 82 82 82 73 92
22.0 19.9 12.4 18-20 14-16 15-17 14-16 12.5 15-18 15-19 13-15 17-19 14-16 17-19 10.9 18.0 17.8 21.9 14.0 15.6 13.6 13.5 22.7 11.5 11.4 18.2 18.9 14.2 14.0 16.0 16.8
2 1+2 1 1+2 1+2 1+2 1 1 1+2 1+2 1 1+2 1 1+2 1 1+2 1+2 2 1 1 1 1 2 1 1 1+2 2 1 1 1 1+2
a
Relative to quantification product ion
b
Segment 1, 8–18 min; segment 2: 18–28 min
c
Coelutions observed in Standard Reference Material 2260a
Automated determination of parent and alkylated PAHs in waters
Fig. 2 Dopant spraying device built from commercially available parts
system, little or no backpressure is applied to the syringe pumps which translate into stable dopant delivery. Also, since analytical signals maximized at a dopant flow rate of approximately 10 % of the eluent flow rate, using a programmable dopant system has the advantage of maintaining this optimum ratio as the eluent flow rate changes during the chromatographic separation. The spraying system was tested with two syringe equipped with four 10-mL syringes (40 mL total), providing 26 runs (approx. 12 h of continuous operation) before a syringe refill is required. This translates into a consumption of about 1.5 mL of chlorobenzene per sample. In comparison, the traditional LLE+GC-MS approach may require up to 150 mL (3×50 mL extractions) with organic solvents to ensure a high recovery [15]. Methylene chloride, which possesses an atmospheric halflife of approx. 150 days and is considered a class B carcinogen [16, 17], is the preferred solvent for the extraction of PAHs as its low volatility increases recovery of light PAHs. In contrast, chlorobenzene has a much shorter atmospheric persistence (half-life of 20–40 h) and is not considered a carcinogen [35]. Thus, both the lower quantity and the nature of the halogenated waste produced suggest that the online SPE-LC-APPI-MS/MS is a greener methodology than LLE+GC-MS. Optimization of chromatographic separation During compound optimization for SRM detection, it was observed that PAHs with the same parent masses have similar
335
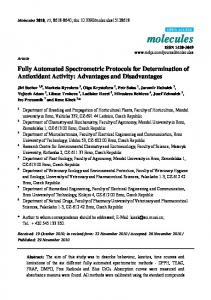
behavior upon collision-induced dissociation (same product ions, same collision energy, see Table 2), eliminating the possibility of selective detection of isobaric PAHs. Because comprehensive PAH analysis requires quantitation beyond the 16 priority PAHs, a carefully controlled LC separation is required to solve most of these isobaric interferences. Since PAH molecules have fixed planar conformations, chromatographic selectivity is governed solely by their molecular dimensions [36]. Several authors have shown that polymeric C18 columns offer the highest shape selectivity for PAHs [36–38]. Furthermore, complete chromatographic resolution of the 16 PAHs listed as priority by the EPA using the polymeric C18 Hypersil Green PAH stationary phase has been previously reported [37, 39]. This stationary phase was selected to explore the possibility of a liquid chromatography separation of most alkylated PAHs as these compounds are often used as markers to identify pollution sources and environmental transformations [4, 40]. Light PAHs (i.e., alkylnaphthalenes) could be only efficiently separated using a methanol/water gradient system, as the use of acetonitrile/water caused fast elution with no resolution control. On the other hand, methanol proved to be a weak solvent for heavy PAHs (m/z 228 and above), causing excessively high retention times and peak shape broadening even at 100 % methanol isocratic elution. A second gradient between methanol and acetonitrile was then used after the water/methanol system. Still, retention times for heavier PAHs (m /z 252 and above) were also very high even at 100 % acetonitrile conditions. In order to perform an efficient, wide mass range separation, a flow rate gradient was also used in combination with solvent strength control, taking advantage of the steep backpressure drop observed as water is removed from the analytical column during the gradient. Figure 3 compares the obtained resolution of alkylated PAHs contained in the SRM 1491a to that obtained by traditional GC-MS analysis. Although resolution for C1-naphthalenes was lower than GC, two marginally resolved peaks are observed in the SPE-LC-MS/MS separation of these compounds that differ only in the position of a single methyl group between adjacent carbon atoms, and since C1-naphthalenes are detected as a group, the limited resolution does not affect quantitation. As analyte mass increased, the observed resolution behavior tended to be similar than the obtained by GC-MS. Both techniques had the same difficulty to separate C1-fluoranthenes and C1pyrenes (four peaks should be observed in the m /z 216 chromatogram), while complete resolution was observed for 3-methylchrysene and 6-methylchrysene in both methods. All four methylphenanthrenes are visible and well separated from the 2-methylanthracene signal, in contrast to the GC-MS separation where a coelution of the two groups is observed. These results indicate that isobaric-alkylated PAHs can be partially resolved using single-column liquid chromatography, and to the best of our knowledge, this is the first report of such finding.
336
C.E. Ramirez et al.
Fig. 3 Comparison of peaks of PAHs contained in the Standard Reference Material 1491a, obtained by GC-MS analysis (1/10 dilution in hexane, top) and by SPE-LC-MS/MS analysis (1/27,500 serial dilution in seawater, bottom ). Reference material listed compounds: C1-naphthalenes (1-methyl, 2-methyl); C2-naphthalenes
(1,2-dimethyl, 1,6-dimethyl, 2,6-dimethyl); C1-phenanthrenes (1-methyl, 2-methyl, 3-methyl, 9-methyl); C1-anthracenes (2-methyl); C1fluoranthenes (1-methyl, 3-methyl); C1-pyrenes (1-methyl, 4-methyl); C1-chrysenes (3-methyl, 6 methyl). SRM 1491a also contains one C2phenanthrene (1,7-dimethyl, not shown)
Although the observed resolution of alkylated PAHs may be not enough to replace capillary GC for PAH fingerprinting applications, the obtained resolution could be enough to be used as an screening tool to decide if a given sample should be analyzed using those time-consuming techniques, taking advantage of the low sample consumption and the speed of this methodology. Additionally, the absence of sample preparation could provide the ability to track in almost real time the extent of a contamination by monitoring for the specific alkylated PAH concentration patterns observed at the pollution source. With the used gradient separation, baseline resolution of the 16 priority PAHs from their isobaric interferences present in SRM 2260a was obtained except for benzo[b]fluoranthene which coeluted with perylene. Attempts to separate these compounds without a significant increase of run time were unsuccessful, and since method speed was a priority, these compounds were quantified as a group. Previously published LC methodologies reporting separation of the 16 priority PAHs by LC-MS/MS [26, 41] did not evaluate chromatographic resolution of isobaric interferences with standards containing a larger number of PAHs such as the SRM 2260a used in this study. Our results suggest that the occurrence of these types of interferences should be evaluated in order to ensure data quality.
for PAH extraction. A highly end-capped, commercially available C18 column especially designed for SPE was selected based on its high stability towards aqueous samples. SPE column loading, washing, and reconditioning parameters were optimized for extraction recovery, seawater salt elimination, and prevention of carryover using isotopically labeled PAHs as testing compounds. Same-day 10-mL injections of 100 ng/L (online SPE) and 100 μL direct injections of 10,000 ng/L solutions in 70 % methanol/water were made, accounting for 1.0 ng on column for each compound (the 5-mL injection mode was tested against 50 μL direct injection, 0.5 ng on column). Percent recoveries were obtained using averaged peak areas, using at least three direct injection runs and two online SPE runs. The direct injection method had the same analytical gradient with the online SPE method, and the observed retention times were in agreement with an 8-min offset due to the online SPE time, ensuring similar APPI source conditions at elution in both injection modes thus enabling the direct comparison of peak areas. Passing at least 2 mL of aqueous mobile phase through the loading column after the SPE step was enough to prevent the transfer of salt residues to the APPI source. Peak shape degradation also occurred if the loading column was not conditioned with methanol before connecting with the organic-rich analytical stream at the start of the analytical gradient (70 % methanol). Thus, 1 mL of mobile phase was employed to increase the percentage of methanol before the columns were connected (0.5 mL gradient increase and 0.5 mL hold). Recoveries of chrysene-D12, perylene-D12,
Optimization of the online SPE procedure SPE sorbents and conditions for PAHs have been reviewed elsewhere [19]. Regular C18 has been identified a good sorbent
Automated determination of parent and alkylated PAHs in waters
and benzo[a ]pyrene-D 12 increased with the methanol proportion, and the SPE column could be washed with up to 60 % methanol without significant losses of the light PAHs (Fig. 4). Additionally, online SPE signals for heavy PAHs proved erratic if the sample itself was not amended with organic solvents. A total of 5 % v/v of methanol was required in the sample to obtain good signal reproducibility and recovery of naphthalene-D8, the only isotopically labeled PAH that showed significant recovery losses due to the addition of large amounts of methanol. Analyte breakthrough was evaluated by performing injections using 5- and 10-mL stainless steel loops. Both sample loops used had the same specifications (stainless steel, 0.06 in ID with 0.03 in terminals), and the method program was adjusted to account for the lower injection volume. No significant difference in SPE recovery was observed, and 10-mL injections were adopted for enhanced sensitivity. The sample loading speed during the SPE step was also evaluated at 1, 2, and 3 mL/min (SPE column backpressure increases steeply with flow rate, triggering the SPE pump high-pressure protection at 4 mL/min). No significant difference was observed and a flow rate of 2 mL/min was chosen as a good compromise between stable pump operation and minimized run time. Since samples were analyzed without filtration, SPE column backpressure slightly increased after every sequence (usually 40–50 injections). Backflushing with acetonitrile at 5 mL/min between sequences removed any clogging particles and restored column performance. Method validation Calibration and quality control Calibration curves were obtained by plotting the peak area ratio of each PAH to an isotopically labeled PAH internal standard against concentration in nanograms per liter. Linearity was observed for all analytes in the range used (R 2 >0.99; 5 to 500 ng/L). Calibration stability was evaluated every 10 runs by injecting seawater fortified to 100 ng/L. Calibration and method accuracy was verified by injecting
Fig. 4 Effect of the percentage of methanol on SPE recovery. Left: Increasing the percent methanol in sample stabilizes the signal of heavy PAHs but has a detrimental effect on naphthalene recovery. Five percent was selected as optimum value. Right: Increasing the percent methanol in
337
artificial seawater fortified with serially diluted standard reference materials 1491a and 2260a (pooled SRM recoveries can be observed in Table S1 (Electronic Supplementary Material), in the electronic supplementary information). With every analysis batch, a negative (reagent and sampling) and a positive (fortified to 100 ng/L) blanks were also used. Additionally, one sample duplicate and one fortified matrix experiment were always analyzed per every five samples. The system was continuously tested for carryover by injecting a reagent blank after the highest calibration standard and after every calibration verification standard. Compound identification was considered positive when signals with a S /N ratio above 3 were present in both the quantification and confirmation SRM transitions, with a maximum retention time difference of 0.2 min relative to calibration standards or standard reference materials. Calculated concentrations below method detection limits (MDLs) were considered non-detections. A reporting limit (RL) of three times the MDLs was set in order to reduce the risk of false positives and ensure data quality. Determination of method detection limits MDLs were calculated by multiplying the standard deviation from seven measurements by the Student t value (t (7–1, 99) =3.143), according to procedures outlined by the USEPA [42], using natural seawater (from FIU Campus Beach, see Table 4), fortified to 50 ng/L. For sensitivity comparison, MDLs for the traditional LLE+GC-MS methodology were determined using 1,000 mL of the same seawater sample also fortified to 50 ng/L and extracted three times with 50 mL portions of methylene chloride. The extract was obtained, evaporated, and cleaned according to established methods (EPA 3510C and 3630C) [10, 11] and analyzed by a GC-MS method available elsewhere [12]. Results shown in Table 3 shows that the average MDLs corrected for sample size obtained by LLE+GC-MS analysis are an order of magnitude higher than those obtained by SPE-LC-MS/MS. Although in practice lower MDL values can be obtained with LLE due to the possibility of using larger
the mobile phase used to push the sample out of the loop and wash the SPE column increases recovery of heavy PAHs, but a maximum of 60 % can be used before severe loss of light PAHs is observed
338 Table 3 Comparisons of MDL values obtained by SPE-LC-MS/ MS and by LLE+GC-MS. Fortification level was 50 ng/L in both experiments (concentrations are listed in nanograms per liter)
a
MDLs corrected for sample size
C.E. Ramirez et al.
PAH (testing compound)
SPE-LC-MS/MS, 10 mL
LLE+GC-MS, 1,000 mL
LLE+GC-MS, 10 mLa
Acenaphthene Acenaphthylene Anthracene Benzo[a]anthracene Benzo[a]pyrene Benzo[b]fluoranthene Benzo[b]fluorene Benzo[e]pyrene Benzo[g,h,i]perylene Benzo[k]fluoranthene
15 16 29 12 23 34 7.5 16 19 21
1.5 1.2 1.7 2.5 1.7 3.1 3.4 1.2 1.5 1.2
150 120 170 250 170 310 340 120 150 120
Biphenyl C1-anthracenes (2-methyl) C1-chrysenes (6-methyl) C1-dibenzothiophenes (4-methyl) C1-fluorenes (1-methyl) C1-naphthalenes (2-methyl) C1-phenanthrenes (1-methyl) C2-dibenzothiophenes (4,6-dimethyl) C2-naphthalenes (2,6-dimethyl) C3-naphthalenes (2,3,5-trimethyl) C4-phenanthrenes (retene) Carbazole Chrysene Dibenzo[a,h]anthracene Dibenzothiophene Fluoranthene Fluorene Indeno[1,2,3-cd]pyrene
24 8.7 23 13 12 13 10 12 15 17 18 26 12 16 11 12 7.9 26
1.2 2.2 1.5 1.7 1.5 1.8 1.5 1.5 1.7 1.5 2.6 1.7 2.4 3.4 1.7 1.2 1.5 4.8
120 220 150 170 150 180 150 150 170 150 260 170 240 340 170 120 150 480
Naphthalene Naphthobenzothiophene Phenanthrene Pyrene Average
20 21 19 17 17
1.2 2.2 2.2 1.2 1.9
120 220 220 120 191
Fig. 5 Effect of storage time on measured concentration from fortified natural seawater at low, medium, and high m/z. Inter-day measurements were performed from independent vials. Each day, the same vial was
analyzed twice, providing intra-sample variability. Fortification level was 100 ng/L. Overall means (n =10) are shown in solid lines: naphthalene (83±6), fluoranthene (88±7), and indeno[1,2,3-cd]pyrene (84±9)
Automated determination of parent and alkylated PAHs in waters
339
Table 4 Method performance upon analysis of surface seawater (bold, 16 USEPA priority PAHs; all concentrations listed in nanograms per liter) Site name
Bayfront Park
Latitude N
Haulover Haulover Dinner Key boat Marina Marina ramp 25.91684 25.90613 25.72720
Longitude W
80.12383 80.12396 80.23767
80.18491 80.16782 80.13640 80.14027
Pelican Harbor Park 25.77274 25.84713
FIU Miami Beach Campus Marina Beach 25.90994 25.77194
PAH
MDL RL C
C
C
D
Ave± σ C
C
C
C FM FL
Acenaphthene
15
45
–
–
–
–
–
–
–
–
Acenaphthylene
16
49
–
–
–
–
–
–
–
–
179 176 102
Anthanthrene
26
78
–
–
–
–
–
–
–
–
–
Anthracene
29
86
–
–
–
–
–
–
–
–
179 176 101
Benz[a]anthracene
12
36
–
–
–
–
–
–
–
–
160 176 91
Benzo[a]fluoranthene
16
48
–
–
–
–
–
–
–
–
–
Benzo[a]pyrene
23
69
–
–
–
–
–
–
–
–
171 176 97
Benzo[b]fluoranthene, perylene 34
102 –
–
–
–
–
–
–
–
370 373 99
Benzo[b]fluorene
23
–
–
–
–
–
–
–
–
154 176 88
7.5
% Rec
184 176 104 0
0
n.a.
n.a.
Benzo[c]phenanthrene
12
36
–
–
–
–
–
–
–
–
–
Benzo[e]pyrene, benzo[j]fluoranthene Benzo[g,h,i]perylene
16
48
–
–
–
–
–
–
–
–
175 176 99
19
57
–
–
–
–
–
–
–
–
185 176 105
Benzo[k]fluoranthene
21
63
–
–
–
–
–
–
–
–
189 176 108
Biphenyl
24
72
–
–
–
–
–
–
–
–
208 176 118
C1-anthracenes
8.7
26
–
–
–
–
–
–
–
–
168 176 95
C1-chrysenes
23
69
–
–
–
–
–
–
–
–
172 176 97
0
n.a.
C1-dibenzothiophenes
13
39
–
–
–
–
–
–
–
–
171 176 97
C1-fluor/pyrenes
7.5
23
–
–
–
–
–
–
–
–
–
C1-fluorenes
12
35
–
–
–
–
–
–
–
–
180 176 102
0
n.a.
C1-naphthalenes
13
40
129
–
74
76
–
–
–
–
419 353 119
C1-phenanthrenes
10
30
–
–
–
–
–
–
–
–
182 176 103
C2-dibenzothiophenes
12
36
–
–
–
–
–
–
–
–
166 176 94
75±1
C2-naphthalenes
15
44