ICP techniques either assume a rough alignment of the two point sets or run the ..... random transformations to the starting point sets to create a scenario where a ...
Fully Automatic Registration of 3D Point Clouds Ameesh Makadia, Alexander Patterson IV, and Kostas Daniilidis∗ Department of Computer and Information Science University of Pennsylvania Philadelphia, PA, 19104, USA {makadia, aiv, kostas}@cis.upenn.edu Abstract We propose a novel technique for the registration of 3D point clouds which makes very few assumptions: we avoid any manual rough alignment or the use of landmarks, displacement can be arbitrarily large, and the two point sets can have very little overlap. Crude alignment is achieved by estimation of the 3D-rotation from two Extended Gaussian Images even when the data sets inducing them have partial overlap. The technique is based on the correlation of the two EGIs in the Fourier domain and makes use of the spherical and rotational harmonic transforms. For pairs with low overlap which fail a critical verification step, the rotational alignment can be obtained by the alignment of constellation images generated from the EGIs. Rotationally aligned sets are matched by correlation using the Fourier transform of volumetric functions. A fine alignment is acquired in the final step by running Iterative Closest Points with just few iterations.
1 Introduction During the last few years we have experienced the market introduction of range sensors with reasonable cost as well as the availability of many successful stereo vision algorithms. In the near future, sensors based on structured or modulated light will be able to capture several aspects of an object or even an entire scene in time comparable to image acquisition time from a digital camera. In the same way that automatic image stitching is now a widely used tool, we expect that there will be a need for a fast and fully automatic solution of the range registration problem. As any registration problem, range registration consists of the steps of matching and estimation of the rigid transformation. Depending on the displacement and orientation between point clouds, we differentiate between crude and fine ∗ The authors are grateful for support through the following grants: NSF-IIS-0121293, NSF-EIA-0324977, NSF-CNS-0423891, NSF-IIS0431070, and ARO/MURI DAAD19-02-1-0383.
alignment. The challenge in crude registration lies in performing it automatically and consistently even when there is very small overlap. The golden standard for fine registration is the Iterative Closest Point algorithm [4] and its variants [24]. ICP techniques either assume a rough alignment of the two point sets or run the algorithm multiple times by sampling the space of initial conditions. In commercial products, initial alignment is achieved manually or by the use of characteristic markers in the scene. They further rely on a significant percentage of overlap between the two point sets. Another group of techniques depend on the extraction of local features with such distinguishable attributes that correspondence becomes a non-iterative task. Robust variations like RANSAC reject outliers and improve the estimation of the rigid transformation. In this paper, the emphasis is put on the crude alignment step, which presents the real challenge for practical applications. We pose the following requirements for a registration algorithm: Fully automatic without artificial landmarks, partial overlap of point sets, independence of sensors and their sampling density as well as the size of the environment, and real-time, meaning no dependence on convergence speed. Our algorithm is global and does not necessitate any feature detection. Its novel contribution is the reliable estimation of orientation between two extended Gaussian images (EGI, [11]). Our rotation estimate is obtained by exhaustively traversing the space of rotations to find the one which maximizes the correlation between EGIs. Such a computation would seem grueling, but we show how such a correlation can be computed efficiently using the spherical harmonics of the Extended Gaussian Image and the rotational Fourier transform. To rotationally align point clouds with low overlap, we introduce a new representation of the EGI which we call the constellation image. This image captures the critical orientation distributions of a point cloud and can be correlated to obtain alignment without being adversely affected by outlying normal densities. We use a correlation-based formulation to subsequently estimate the translation. Our experiments show that our algorithm aligns
point clouds arising from small objects or indoor scenes with as low as 45% overlap.
images.
1.1. Related work
2 Orientation histograms
Many approaches dealing with scans with low overlap forgo global characteristics in favor of the extraction of local invariant features [27, 14, 12]. These features, if given in sufficient number, can be matched to constrain the motion estimates. These feature matching approaches are susceptible to outliers and common ambiguities in the matching (repeated textures). The representation we explore in this paper is the extended Gaussian image, which can effectively be approximated by a spherical histogram of surface orientations. Since its introduction, a number of other translation invariant spherical representations have been introduced, including extensions to the EGI to handle a wider range of input scans. There are the weighted principal directions and canonical length used in [1], the directional histogram model [20] (and closely related thickness histogram [21]), and the spherical attribute images in [10, 7]. In [15] a complex EGI was proposed which extends the traditional EGI to distinguish between convex and nonconvex objects. Although invariant spherical representations have been used to estimate relative orientation ([5, 19, 13, 10]), these methods depend on unreliable local features or brute force matching. To the knowledge of the authors, a fast global alignment between range scans has yet to be introduced. While our use of spherical harmonics to estimate rotation from EGIs is new, harmonic invariants have been used extensively for object retrieval and recognition [20, 21, 16], and also at a smaller scale to generate invariant keypoints [9]. A true Fourier-based method for range alignment is given in [22]. Since this method estimates the parameters of motion directly from the frequency domain, it requires knowledge of the overlapping regions between scans. Close methods to ours may be found in the SLAM literature, where correlation alignment is achieved by recovering the phase shift from two dimensional signals. For example, angle histograms, which are roughly invariant to rotation and translation are aligned via cross-correlation in [29]. In addition to aligning limited overlap point clouds, another objective of ours is to seamlessly integrate a large number of scans. Related to this effort are a number of methods which try to create object models from the combination of numerous laser scans [6, 25, 3]. In [6], the authors combine range scans through an updated signed distance function, and in [25] the surfaces are integrated by minimizing the least-squares distance between overlapping regions. In the two following sections, we demonstrate how to achieve a reliable rotation estimate directly from the EGI
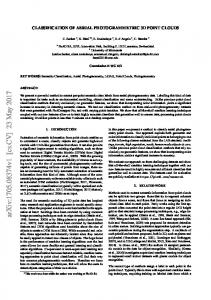
Global representations of range scans are desirable because they capture characteristics which encode invariance and allow for direct comparisons for alignment and recognition tasks. Surface orientation histograms are effective approximations to the EGI representation, and throughout this text we will refer to the EGI and the orientation histogram interchangeably. Although it may seem like a simple accumulation of surface normals, the EGI provides a very powerful representation since it allows for the direct recovery of orientation independent of any translational shift present. Estimating attitude via EGI alignment has been discussed as early as 1984 [5]. These methods usually involve identifying and matching local features. Since there is a unique EGI representation for any convex object [26], this may be sufficient when registering orientation histograms of convex objects with much overlap. However, when dealing with range scans with low overlap, noisy measurements, or multiple disconnected, nonconvex objects, it is unlikely that local feature generation and matching will be sufficient. It has been shown in [23] that signal correlation provides a reliable measure for the rotational alignment of hemispherical images with little overlap. While such an evaluation would appear to require an expensive search, a fast correlation can be estimated using spherical Fourier analysis, with the requirement that our histogram bins be uniformly (in angular coordinates) spaced on the sphere. Ideally, an orientation histogram would be comprised of bins which all have the same surface area and shape. One way to achieve this goal is by projecting regular polyhedra onto the sphere, but the regular polyhedron with the most sides is the icosahedron (twenty). At this scale, the histogram will not retain any distinguishing information. For finer sampling, approximations can be achieved easily by further subdividing the faces of the polyhedra. One purpose of retaining a constant bin shape and size is to provide a consistency for matching local features generated directly from the bin values. The cell shape and distribution we will use depends on the alternate criteria of a fast correlation. This will require uniform sampling in the spherical longitudinal and azimuthal coordinates. Figure 1 shows the effects of this choice on cell shapes and sizes on the sphere. As is clear from the images, the bin sizes closest to the equator have the largest surface areas, and the bins closest to the north and south poles are the smallest. In fact, for a histogram with 256 bins (as pictured), the spherical surface area of the largest bin is roughly 10 times the surface area captured by the smallest bin.
3.1. Spherical correlation
A
B
C
Figure 1. On the left (A) is a representation of an orientation histogram with 256 bins. The sphere S2 is sampled uniformly in spherical coordinates, creating a square grid. (B) depicts the corresponding bin sizes and shapes on the sphere. The highlighted bins correspond to the highlighted row in (A). (C) displays the bin centers when the longitudinal samples do not include the poles.
3 Rotational alignment One of the underlying themes of this paper is automatic, unsupervised alignment. This means we are approaching the EGI alignment phase with no prior estimate of the correct rotation. Furthermore, due to the difficult nature of identifying reliable features for matching in our orientation histograms, we cannot assume a reduction of the possible solution space. Since we must consider all rotations R ∈ SO(3), we will generate a global likelihood grid which scores each rotation based on the strength of the correlation result. This likelihood grid can be computed as � H1 (ω)H2 (RT ω)dω (1) G(R) = ω∈S2
Here H{1,2} (ω) are the orientation histograms generated from two separate scans. At first glance a direct estimation of G(R) involves recomputing the integral as many times as there are elements in a discretized rotation space. In the discrete setting, each integral evaluation commands a complexity of O(N 2 ), where N is related to the size of the spherical histogram. To obtain G(R), the total complexity is on the order of O(M 3 N 2 ), where M represents the number of samples in each dimension of SO(3). We obtain a better perspective of our situation by noticing that this correlation approach is very similar to the correlation of planar functions. In such cases the correlation integral can be expressed as a simple pointwise multiplication in the Fourier spectrum. Armed with the Fast Fourier Transform, the complexity of generating a complete correlation grid is dramatically reduced. We will show how these principles of correlation-as-multiplication extend to spherical correlation.
A thorough treatment of spherical harmonics can be found in [2]. The well known spherical harmonics (Yml : S2 �→ C) form an eigenspace of harmonic homogeneous polynomials of dimension 2l + 1. Thus, the 2l + 1 spherical harmonics for each l ≥ 0 form an orthonormal basis for any f (ω) ∈ L2 (S2 ), where L2 denotes square-integrability. Any function f (ω) ∈ L2 (S2 ) can be expanded in this basis: l � �
f (ω) =
l Yml (ω) fˆm
(2)
l∈N m=−l
�
l where fˆm
=
ω∈S 2
f (ω)Yml (ω)dω
(3)
l The fˆm are the coefficients of the Spherical Fourier Transform (SFT). We will write fˆl to annotate vectors in C2l+1 containing all coefficients of degree l. Fortunately, due in part to our selection of a uniform angular sampling of the sphere, there exists a separation-of-variables technique to compute the discrete SFT in O(L2 log 2 L) [8]. Here L is the bandwidth of the spherical signal, specifying the largest degree for which we retain SFT coefficients. As a compact Lie group, SO(3) permits a Fourier transform because it has a basis of irreducible unitary representations. In matrix form, the individual elements are given as l l (R(α, β, γ)) = e−imγ Pmn (cos(β))e−inα Umn
(4)
l The Pmn are generalized associated Legendre polynomials. Note that we have chosen the traditional ZY Z Euler angles α, β, and γ, as a parameterization of SO(3). These irreducible representations lead us directly to the required expansion of functions f ∈ L2 (SO(3)):
f (R) =
l l � � �
l l Ump (R) fˆmp
(5)
l (R)dR f (R)Ump
(6)
l∈N m=−l p=−l
l where fˆmp
� =
R∈SO(3)
l The fˆmp are the coefficients of the SO(3) Fourier transform (SOFT). A fast discrete SOFT can be computed in O(L3 log 2 L) [18].
3.2. Correlation as multiplication As we are interested in relating two images separated by a rotation in Fourier space, we must firmly understand the effect of 3D rotations in this space. Intuitively, we would expect a rotation to manifest itself as a modulation of the Fourier coefficients, and this, is in fact, the observed effect.
As spherical functions are rotated by elements of the rotation group SO(3), the Fourier coefficients are “modulated” by the irreducible representations of SO(3): hl f (ω) = h(RT ω) ⇐⇒ fˆl = U l (R)T ˆ
(7)
In effect, the U l matrix representations of SO(3) are the spectral analogue to 3D rotations. We are now armed with the necessary tools to write the correlation function (1) in terms of the Fourier transforms of the individual orientation histograms (readers are referred to the work in [18] for details of a complete derivation). Due to the unitarity of the representations U l and the orthogonality of the harmonics Y l , the Fourier transform of G(R) can be computed as ˆ lmp G
=
l l Hˆ1 m Hˆ2 p
(8)
As we had initially desired, the correlation of two spherical functions reflects the similar properties of a generalized convolution: the SO(3) Fourier coefficients of the correlation of two spherical functions can be obtained directly from the pointwise multiplication of the individual SFT coˆ l , the inverse SOFT retrieves the desired efficients. Given G function G(R) with (2L + 1) samples in each of�the three � ◦
180 Euler angles, leaving us with accuracy up to ± 2L+1 �◦ � 90 in α and γ and ± 2L+1 in β. Since the estimation of rotational alignment consists of consecutive steps, the total time complexity is additive, and the dominant term is the retrieval of G(R) via an inverse SOFT, leaving us with a total complexity of O(L3 log 2 L).
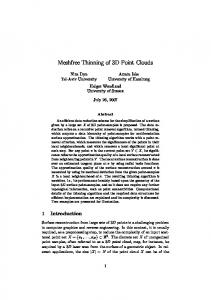
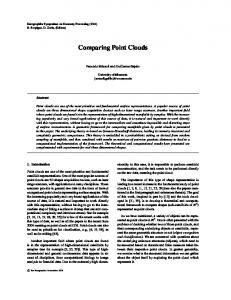
3.3. Multiple hypotheses We illustrate the concept of our rotational alignment procedure in Figure 2. In most cases, even with partial overlap, this correlation alignment of two EGIs results in the correct rotational estimate. However, in keeping with the theme of fully automatic registration, we must be able to identify instances of misalignment, and in those cases generate additional hypotheses for the rotational alignment. Although we will detail the verification step in the section 5, we now describe a method to generate multiple rotation hypotheses from the original orientation histograms. Figure 3 provides an example of two hardly overlapping scans where the direct correlation alignment fails. There are two extreme conditions which, if both present, can cause the correlation alignment to result in an erroneous match: 1. The two scans being aligned have minimal overlap. 2. Surface regions not belonging to the area of overlap contain a disproportionately large density of points
Figure 2. On the top row are two different scans of a running shoe separated by a a rotation. The corresponding EGI representation is shown on the sphere encompassing the shoe. On the bottom left is a slice of the likelihood space G(R) at the location of the global peak. The other local maxima correspond to rotations which align incorrect faces of each shoe. On the right is an image of the shoes after rotational alignment. The correct alignment of the shoe corresponds to the correct alignment of EGIs.
with normal directions not present in the overlap regions (i.e. the heaviest bins in the histogram correspond to normals from surface regions which do not appear in both scans). The primary effect of having a dominant peak in the orientation histogram is that for any highly correlated alignment, this peak region is likely to be aligned with some peak from the second histogram. If such a dominant peak comes mostly from regions and orientations which are not present in both scans, it may have an unduly effect on the estimation. As the likelihood of having such detrimental EGI bins or regions increases as the overlap between scans decreases, we would like to limit the effect that any one surface orientation can have on our rotational alignment estimation. To achieve this goal, we will convert our orientation histogram into a constellation image. This can be achieved by retaining the local maxima of the original EGI, and suppressing the remaining bins. Figure 4 shows an EGI, the subsequent constellation image, and the surface patches which contribute to the occupied regions in the constellation sphere. Alignment obtained by correlating constellation images as opposed to the EGIs ensures that priority will not be given to bins collecting its majority of normals
A
B
C
D
E
F
Figure 3. (A) Two scans of a rabbit from [28] with very little overlap, and separated only by a rotation. Each scan captures a different side, with the only overlap coming in a thin strip along the back of the rabbit. (B) The erroneous alignment obtained by correlating the two orientation histograms. (C) The alignment obtained after generating additional rotational hypotheses. (D,E) The EGIs estimated from the two scans. (F) EGI of the first scan mapped into proper alignment with the second scan. Clearly there is very little matching information in the two EGIs, stemming from the fact that the scans have very little overlap. This situation necessitates the development of the constellation images.
from non-overlap regions. The downside is that we may still encounter an erroneous alignment if the non-overlapping scan regions contribute to an overwhelming number of EGI peaks. We can only be confident that if a rotational alignment exists, it will be captured as one of the better constellation alignments, not necessarily the best. In estimating the rotational alignment, we capture the entire grid G(R). This gives us direct access to the most likely constellation alignments, which can be pruned using the verification method presented in section 5.
4 Estimating the translation Our use of the shift-invariant orientation histograms allowed us to decouple our alignment problem into consecutive searches for the rotational and translational components. Continuing in the same vein as the rotational fast correlation approach, we can formulate an estimate of the 3D translation which relies on the assumption that correct
Figure 4. Top Left: Scan of a bunny. Top Right: The corresponding orientation histogram. Bottom Left: The centers of the EGI regions which contribute to the constellation image. Bottom Right: Patches from the scan which correspond to constellation peaks. Points with the same color contribute normals to the same histogram neighborhood (corresponding to one constellation peak).
alignment is achieved at the locations of greatest overlap or correlation between range scans. For the moment, we will define our range scans as occupancy functions on R3 : � 3 F (x) = 1 if a point was scanned at x ∈ R 0 otherwise Applying our principles of correlation, we claim that the correct translational shift τ ∈ R3 maximizes the following correlation function: � G(τ ) = F1 (x)F2 (x − τ )dx (9) x∈R3
Since (9) is a convolution integral, we know that the Fourier ˆ transform of G(τ ) is given simply as G(k) = Fˆ1 (k)Fˆ2 (k). ˆ The Fourier coefficients F{1,2} (k) of the occupancy functions F{1,2} (x) can be recovered from the traditional R3 Fourier transform. In order for the correlation (9) to succeed, we must ensure overlap by generating a binary voxel space representation of R3 where each voxel covers a much larger area than the fine resolution of a range scanner. Now that we have described the registration estimation, we will present the details of the verification step and recap the full algorithm.
5 Verification In order to validate a hypothesized range alignment, we employ two different criteria. The first is based on the con-
6 Experimental results
I NPUT 1. Point Clouds F1 , F2 , . . . , Fn . O NLINE 1. Compute surface normal fields N{1,2,...,n} for point clouds F{1,2,...,n} . 2. Generate orientation histograms H{1,2,...,n} from normal fields N{1,2,...,n} . 3. To estimate alignment between any two pairs Fi , Fj : (a) Estimate rotation by correlating histograms Hi , Hj (section 3.2). (b) Estimate the translation by correlating the rotationally aligned scans (section 4). (c) Accept transformation only if it passes the verification step (section 5) 4. Repeat until a cycle is found through all scans F{1,2,...,n} . 5. If no cycle can be generated, patch segments of aligned scans together using additional hypotheses obtained by aligning constellation images (section 3.3). 6. Obtain fine registration with pairwise ICP.
Figure 5. An outline of the automated pointcloud registration algorithm.
sistency of surface orientations in the overlapping regions of the aligned scans (the assumption is that normals should be the same for the points which overlap). If we voxelize the space after alignment, we can generate a global consistency measure by accumulating the difference in mean normal orientations for all overlapping voxels weighted by the mass of points present in each voxel. The second verification criterion we consider is visibility information. Intuitively, we would like to discard any alignment that would interfere with the line-of-sight of a range scanner. This method is similar to the visibility constraints explored in [17]. Consider a point cloud F2 being mapped into the reference frame of a point cloud F1 . If, after a hypothesized alignment, the surface in F2 occupies the open space between the scanner viewpoint and surface of F1 , we claim that visibility of F1 has been occluded and such an alignment is improbable. For point clouds obtained with an unknown scanner, or for any other situation where the visibility profile is unknown, only surface orientation consistency is used for validating alignments. Having discussed the verification process for any hypothesized alignment, we present the algorithm outline in Figure 5.
We now present the experimental results of our fully automated alignment algorithm. The first step is to estimate surface normals, which can be obtained by computing the spherical gradient directly on a spherical depthmap. If such a representation is not available, then a simple local plane fitting approach can be used. To estimate the translational component of alignment, our correlationbased approach requires a voxelization of the point space. We chose our voxel size to roughly generate a voxel space of no more than 100 bins in any dimension. A fine registration from the estimated crude alignment is obtained with the Scanalyze ICP software freely available at http://graphics.stanford.edu/software/scanalyze/. To generate EGIs, we chose a signal bandwidth of L = 128, corresponding to a spherical histogram with 256 × 256 bins. We begin our evaluation with scans of the Happy Buddha provided by [28]. Figure 6 shows the results of our estimation algorithm for a total of ten scans. Since this data was originally captured to test with ICP, the initial displacements are not very large. To test our approach, we applied random transformations to the starting point sets to create a scenario where a direct ICP would fail. The crude alignment is quite sufficient to initialize the fine estimation. The second set of scans tested were of a statue of a lion. The scale is a bit larger than the Buddha model, nearing nine feet in height. The scans were captured using the DeltaSphereTM-3000 laser scanner. Fifteen scans circling the lion were taken. In Figure 7, some overall drift is apparent in the crude alignment. However, the quality of the pairwise matchings is sufficient for ICP to converge correctly. Our final evaluation deals with scans at yet another scale. Figure 8 depicts four scans of a room taken with the DeltaSphereTM-3000. The room was over 170 ft2 in area (the volume was 1600 ft3 ). A fifth scan capturing the entire room was also taken, allowing us to compare our rough alignment to a ground truth measurement. The crude alignment works well for each scan and a subsequent fine registration yields a very tight solution. One pair of successfully matched scans had only a 45% content overlap. Due to the dominant planes present in each scan, constellation images were needed before the correct alignment could be found and verified. Fewer than ten hypotheses were tested before a valid alignment was recovered in each case. We estimated a median error of 1.2 inches (computed as the min distance from every point in the rough aligned scan to the full scan). We also recorded the motion estimates for each pairwise ICP in the final alignment. The mean rotation angle was 2.0◦ (with a max of 2.1◦ ) and the mean translation was 3.8 inches (with a max of 5.0 inches).
A
B
C
E
D
Figure 6. Registration of the Happy Buddha. (A) shows a the initial positions of some representative scans. (B) shows the rough alignment of ten point sets. (C) shows the final alignment for all scans after ICP is run after the crude registration. (D) shows a pair of EGIs from two of the scans, and (E) shows a slice of the correlation grid G(R) at the location of the estimated rotation.
A
B
C
D
E
Figure 7. Registration of scans of a lion statue. (A) is a representative scan depicting the structure of the statue. (B) shows 6 scans in their initial positions. (C) shows the failure of running ICP directly on the input scans. (D) depicts the rough alignment. (E) shows one view of the successful final registration of all 15 scans.
A
B
C
D
E
F
Figure 8. (A) shows a representative room scan. (B) shows the poor alignment obtained by running ICP on the input. (C, D) show a side and overhead view of the rough alignment. (E, F) show a full and partial view of the final alignment.
7 Conclusion We have presented a comprehensive algorithm for the automatic alignment of 3D point clouds designed specifically for multiple scans with little overlap. The correlation alignment of orientation histograms and constellation images is performed efficiently by extending the convolution theorem to spherical correlation. These methods, along with a reliable verification scheme, provide a crude alignment that yields a quality initialization for fine alignment. The crude alignment performs equally well without modification on small scale scans of models as well as large scale point clouds obtained with room scanners. Future work will involve a probabilistic framework to best align range scans by selecting the best path through multiple scans, along with zippering meshes to generate accurate object models from unordered inputs.
References [1] A. Adan, C. Cerrada, and V. Feliu. Global shape invariants: a solution for 3D free-form object discrimination/identification problem. Pattern Recognition, 34:1331– 1348, 2001. [2] G. Arfken and H. Weber. Mathematical Methods for Physicists. Academic Press, 1966. [3] J. A. Beraldin, L. Cournoyer, M. Rioux, F. Blais, S. F. ElHakim, and G. Godin. Object model creation from multiple range images: acquisition, calibration, model building and verification. In International Conference on Recent Advances in 3-D Digital Imaging and Modeling, 1997. [4] P. J. Besl and N. D. McKay. A method for registration of 3-D shapes. IEEE Trans. Pattern Analysis and Machine Intelligence, 14(2):239–256, 1992. [5] P. Brou. Using the gaussian image to find the orientation of objects. International Journal of Robotics Research, 3(4):89–125, Winter 1984. [6] B. Curless and M. Levoy. A volumetric method for building complex models from range images. Computer Graphics, 30(Annual Conference Series):303–312, 1996. [7] H. Delingette, M. Hebert, and K. Ikeuchi. A spherical representation for the recognition of curved objects. In International Conference on Computer Vision, Berlin, 1993. [8] J. Driscoll and D. Healy. Computing fourier transforms and convolutions on the 2-sphere. Advances in Applied Mathematics, 15:202–250, 1994. [9] A. Frome, D. Huber, R. Kolluri, T. B¨ulow, and J. Malik. Recognizing objects in range data using regional point descriptors. In Proc. Eigth European Conference on Computer Vision, pages 224–237, 2004. [10] M. Hebert, K. Ikeuchi, and H. Delingette. A spherical representation for recognition of free-form surfaces. IEEE Trans. Pattern Analysis and Machine Intelligence, 17(7):681–690, 1995. [11] B. K. P. Horn. Extended gaussian images. IEEE, 72:1671– 1686, 1984.
[12] D. Huber and M. Hebert. Fully automatic registration of multiple 3D data sets. Image and Vision Computing, 21(7):637–650, 2003. [13] K. Ikeuchi. Determining attitude of object from needle map using extended gaussian image. In AIM-714: Tech Report, MIT, 1983. [14] A. E. Johnson and M. Hebert. Recognizing objects by matching oriented points. In IEEE Conf. Computer Vision and Pattern Recognition, Puerto Rico, June 17-19, 1997. [15] S. B. Kang and K. Ikeuchi. The complex EGI: A new representation for 3-D pose determination. IEEE Trans. Pattern Analysis and Machine Intelligence, 15(7):707–721, 1993. [16] M. Kazhdan, T. Funkhouser, and S. Rusinkiewicz. Rotation invariant spherical harmonic representation of 3D shape descriptors. In Symposium on Geometry Processing, June 2003. [17] B. J. King, T. Malisiewicz, C. V. Stewart, and R. J. Radke. Registration of multiple range scans as a location recognition problem: Hypothesis generation, refinement and verification. In Proceedings of the Fifth Intl. Conf. on 3D Digital Imaging and Modeling, 2005. [18] P. J. Kostelec and D. N. Rockmore. FFTs on the rotation group. In Working Paper Series, Santa Fe Institute, 2003. [19] J. J. Little. Determining object attitude from extended gaussian images. In Proc. of the 9th International Joint Conference on Artificial Intelligence, August 1985. [20] X. Liu, R. Sun, S. B. Kang, and H. Y. Shum. Directional histogram model for three-dimensional shape similarity. In IEEE Conf. Computer Vision and Pattern Recognition, Wisconsin, June 16-22, 2003. [21] Y. Liu, J. Pu, H. Zha, W. Liu, and Y. Uehara. Thickness histogram and statistical harmonic representation for 3D model retrieval. In 3DPVT, Thessaloniki, 2004. [22] L. Lucchese, G. Doretto, and G. M. Cortelazzo. A frequency domain technique for range data registration. IEEE Trans. Pattern Analysis and Machine Intelligence, 24(11):1468– 1484, 2002. [23] A. Makadia, L. Sorgi, and K. Daniilidis. Rotation estimation from spherical images. In Proc. Int. Conf. on Pattern Recognition, Cambridge, UK, 2004. [24] S. Rusinkiewicz and M. Levoy. Efficient variants of the ICP algorithm. In Proceedings of the Third Intl. Conf. on 3D Digital Imaging and Modeling, pages 145–152, 2001. [25] M. Saucy and D. Laurendau. a general surface approach to the integration of a set of range views. IEEE Trans. Pattern Analysis and Machine Intelligence, 17(4):344–358, 1995. [26] D. A. Smith. Using enhanced spherical images. In AIM-530: Tech Report, MIT, 1979. [27] I. Stamos and M. Leordeanu. Automated feature-based range registration of urban scenes of large scale. In IEEE Conf. Computer Vision and Pattern Recognition, Wisconsin, June 16-22, 2003. [28] Stanford University Computer Graphics Laboratory: The Stanford 3D scanning repository. [29] G. Weiβ, C. Wetzler, and E. Puttkamer. Keeping track of position and orientation of moving indoor systems by correlation of range-finder scans. In IROS, 1994.