Electroretinograms (ERGs) were obtained from anesthetized mice between 1 ... losses obtained electroretinographically could be accounted for solely on the ...
Functional Abnormalities in Transgenic Mice Expressing a Mutant Rhodopsin Gene Yoshinobu Goto,*-\ Neal S. Peachey*^ Harris Bipps,% and Muna I. Naash%% Purpose. To evaluate the consequences of the expression of a mutant mouse opsin gene on rod- and cone-mediated function. Experimental conditions were chosen to provide a basis of comparison to the results reported for patients with autosomal dominant retinitis pigmentosa (ADRP) in whom the proline at position 23 has been replaced by a histidine (P23H). Methods. The mutated gene product resulted in three substitutions in the rhodopsin molecule: P23H, glycine for valine at position 20 (V20G), and leucine for proline at position 27 (P27L). Mice positive for the transgene were differentiated from normal littermates by the polymerase chain reaction. Electroretinograms (ERGs) were obtained from anesthetized mice between 1 and 9 months of age. After photically bleaching approximately 18% of the available rhodopsin, the time course of rod dark adaptation was examined by monitoring rod ERG amplitude recovery. Rhodopsin densitometry was used to determine the relative amounts of rhodopsin in the retinae of normal and transgenic mice. Results. ERGs obtained from transgenic mice showed a significant reduction in rod-mediated response amplitude at 1 month of age and a relatively slow progressive decrease thereafter. Cone-mediated ERGs, on the other hand, were nearly normal in amplitude for approximately the first 5 months after birth, but at later ages response amplitudes also underwent a progressive decline. In the normal retina, rod ERG amplitudes returned to prebleach levels within 30 minutes, whereas in transgenic mice response amplitudes did not recover within a 2hour test period. The age-related decline in rod-mediated electroretinal potentials seen in transgenic mice was paralleled by a concomitant fall in rhodopsin density, and the sensitivity losses obtained electroretinographically could be accounted for solely on the basis of reduced quantal absorption. Conclusions. The pattern of functional changes seen in the transgenic mice are in good agreement with those reported in patients with ADRP with the P23H mutation in the rhodopsin gene. Particularly noteworthy is the fact that the changes in rhodopsin density and visual sensitivity are associated with a progressive shortening of the rod outer segments; the histologic changes induced by the disease process in patients with ADRP have yet to be determined. Invest Ophthalmol Vis Sci. 1995;36:62-71.
Crenomic analysis of patients with autosomal dominant retinitis pigmentosa (ADRP) has provided convincing evidence that various subtypes of ADRP can result from mutations in the gene encoding rod opsin, a protein that binds 11-d.s-retinal to form the visual
pigment, rhodopsin.1 8 The genetic defect results in point mutations in one or another of the amino acids that constitute the polypeptide chain in the disk membranes of the rod outer segments and leads ultimately to the loss of visual cells and blindness. Transgenic mice with rhodopsin mutations at
From the*Hines Veterans Administration Hospital, Hines; the-^Department of
Comparable
Neurologi, Stritch School of Medicine, Loyola University of Chicago, Maywood; and the. tDepartments ofOphthalmology and Visual Science and %cLtics,
University
^re?
of Illinois at Chicago College of Medicine, Chicago, Illinois. Supported by the Department of Veterans Affairs, Washington, DC; by grants from the National Retinitis Pigmentosa Foundation, Baltimore, Maryland; the National Eye Institute (EY10609, EY06516), Bethesda Maryland; the Illinois Society for the
sites e x h i b i t d i s o r d e r s o f a similar na-
9-14T-I
I X T I_
R e c e n d y , N a a s h e t al
0 H
ilOH I
-I. j
: n CTprip w j r l , t h r e e n o i n t m u t a t i o n s w i t h i n a s e v e n OpSin g e n e Wltn t n r e e p o i n t m u t a t i o n s Wltnin a Seven a m i n o acid S e q u e n c e n e a r t h e N-terminUS. O n e o f
n n < !
2 r £ £ 5 £ £ 2 5 "Z^miafaZthi'S^
these m u t a t i o n s involves t h e
Templar Eye Foundation, Springfield, Illinois; and by an unrestricted award from
with h i s t i d i n e a t p o s i t i o n
iteMrch toKaentBUndness,N™ York Nm York.
that occurs also in human patients with ADRP. 1 - 315
Submitted for publication June 16, 1994; revised August 17, 1994; accepted
i
s
d e s c r i b e d a slow retl-
nal degeneration in transgenic mice expressing an
^placement of proline
2 3 ( P 2 3 H ) , a Substitution r
August is, 1994. Proprietary interest categopN
The other two mutations, substituting glycine for vau t p o s i t i o n 2fj (V20G) and leucine for proline
Rejmnt requests: Muna I. Naash, University of Illinois at Chicago bye Center (m/c 64S), 1S55 vi. Taylor street, Chicago, IL 60612.
r \ ' r at p o s i t i o n 2 7 ( P 2 7 L ) , h a v e n o t b e e n a s s o c i a t e d with
62
Investigative Ophthalmology & Visual Science, January 1995, Vol. 36, No. 1 Copyright © Association for Research in Vision and Ophthalmology
63
Transgenic Mice Expressing a Mutant Rhodopsin Gene human ADRP, and they were included to enhance antibody recognition of the mutant rhodopsin and differentiation of normal and transgenic mice. Animals expressing the mutated opsin gene will be referred to as VPP mice. These mice display retinal abnormalities that mimic in two important respects the features of human ADRP in which the P23H mutation has been implicated: (i) the degenerative changes involve both rod and cone photoreceptors, with a concomitant decline in the magnitude of the light-evoked electroretinogram (ERG), and (ii) the visual loss progresses at a comparatively slow rate; visual function, measured electroretinographically, is retained for several months, a relatively long period in the life of animals whose longevity rarely exceeds 2 years. In addition to these functional aberrations, earlier studies10'11 have demonstrated an age-dependent reduction in the length of the rod outer segments and a decrease in the cellular content of the outer nuclear layer. In the present study, we provide additional evidence that the transgenic mice mimic the human condition in terms of the relative losses of rod- and conemediated function and the time course of recovery of rod-mediated function after exposure to a bright, light-adapting field. In addition, we have attempted to address more directly the putative mechanisms that link the gene mutation with the pathogenesis of the degenerative process. One interesting hypothesis, put forth recently16 to account for the progressive loss of visual cells and the decline in photic sensitivity, suggests that the mutation in some forms of retinitis pigmen tosa (RP) may lead to the formation of a 'constitutively active' rhodopsin,1718 that is, a molecular species that continuously activates the transduction cascade and presumably induces pathologic changes that mimic the toxic effects of prolonged light exposure. To examine this possibility in VPP mice, we analyzed the electroretinographic responses and rhodopsin content of transgenic animals relative to that of normal littermates. Our results do not provide support for the notion that the opsin mutation leads to a constitutively active rhodopsin in this transgenic model of ADRP. Rather, sensitivity losses in the dark-adapted retina can be attributed to reduced quantal absorption by rhodopsin, a consequence of the reduction in the length of the rod outer segments and the concomitant loss of visual cells.101119
MATERIALS AND METHODS Transgenic Mice As described previously,10'11 the transgene was constructed by oligonucleotide-directed mutagenesis and insertion of a mutated fragment into lambda MO1 comprising the complete murine opsin gene. The fi-
nal transgene consisted of a 15-kb mouse opsin genomic fragment that contained 6-kb upstream and 3.5kb downstream sequences, and in which a part of the wild type exon 1 of the opsin gene was replaced by a fragment containing the mutations. Transgenic mice were identified by the presence of the restriction fragment length polymorphism that was created in the transgene. Polymerase chain reaction amplification of exon 1 with primers W75/W11, followed by digestion with Ncol, reveals three fragments in wild-type mice of 689 bp, 431 bp, and 197 bp. Transgenic mice have an additional (689 bp + 197 bp) fragment due to the deletion of the Ncol site. The retinal degeneration is inherited as a dominant trait in a Mendelian fashion. Therefore, in the heterozygote to normal matings used to generate the mice studied here, ~50% of the offspring are transgenic and ~50% are normal. Each mouse was tested without the experimenter knowing if the mouse was transgenic or normal. All procedures adhered to the ARVO Statement for the Use of Animals in Ophthalmic and Vision Research. Electroretinography Mice were anesthetized with an intraperitoneal injection of 15 £tl/g body weight of a saline solution containing ketamine (1 mg/ml), xylazine (0.4 mg/ml), and urethane (40 mg/ml). The pupil was dilated with 2.5% phenylephrine HC1, and the animals were placed on a heating pad. Electroretinograms were recorded using a coiled stainless steel wire contacting the anesthetized (1% proparacaine HC1) corneal surface through a layer of 1% methylcellulose. A similar wire placed in the mouth and a needle electrode inserted in the tail served as reference and ground leads, respectively. Responses were differentially amplified (half bandpass: 1 to 1000 Hz), averaged, and stored using a Nicolet (Madison, WI) Pathfinder II signal averaging system. Strobe flash stimuli (t < 1 msec) were presented in a Nicolet ganzfeld (GS-2000), either in the dark or superimposed on an adapting field. Electroretinograms were recorded in two sessions. In the first, dark-adapted, luminance-response functions were obtained using flash luminances ranging from -3.13 to 0.85 log cd-sec/m2. Stimuli were presented in order of increasing luminance, and the responses to two successive flashes at each intensity were averaged. A 30-second interflash interval was used for the five lowest luminance flashes; a 1-minute interval was used for the eight higher luminances. The animals were then exposed to a 1.60 log cd/m 2 light-adapting field, and, after a period of 10 minutes during which responses reached a stable amplitude,20 ERGs were elicited at flash luminances ranging from —0.23 to 0.85 log cd-sec/m2. At each luminance, responses to 50 successive flashes presented at a rate of 2.3 Hz were averaged. In the second session, ERG recordings were ob-
64
Investigative Ophthalmology & Visual Science, January 1995, Vol. 36, No. 1
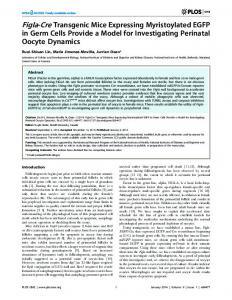
tained during dark adaptation after a 3-minute exposure to a bright preadapting field (2.4 log cd/m 2 ) that bleached approximately 18% of the rhodopsin content of the retina. This study was limited to 2month-old mice, because in older transgenic animals the ERGs were too small to record during the initial phase of dark adaptation. For each animal, five baseline (dark-adapted) responses were recorded to a standard low luminance flash (-2.12 log cd-sec/m2). After the light-adapting field was extinguished, the standard flash was used to monitor response recovery at various times in darkness. This protocol was continued until ERG amplitude returned to baseline or the mouse awoke from anesthesia. In several mice, a control condition was used to determine the contribution of conemediated activity to the dark-adapted ERG. For these experiments, stimuli were superimposed on an adapting field (0.91 log cd/m 2 ) that suppressed rod function but had little effect on cone-mediated potentials.21 Rhodopsin Densitometry In situ measurements of rhodopsin density were obtained with a modified microscope-based fundus reflectometer22 adapted for measurements on isolated retinas mounted receptor-side up on a circular disk of filter paper. Details of the rapid scan, computerbased instrument have been described previously.23 Briefly, absorbance difference spectra were derived from transmissivity data recorded at 25 wavelengths ranging from 410 nm to 700 nm. The density differences [ ADX] represent the wavelength variation in retinal transmissivity between scans recorded from a dark-adapted retina and again after the retina had been exposed for 2 minutes to an intense yellow light (Wratten 16; 460 mW/mm2) that bleached virtually the full complement of available rhodopsin in the test area of the measuring beam. It is important to note that the value of ADX does not represent the rhodopsin density for light passing axially through the rod outer segments. Even when measured in vivo, the absorbance changes are diluted by stray light, that is, that fraction of the light reaching the photocell that has passed through the interstices between photoreceptors.2'1 In the isolated retina, additional factors contribute to significant reductions in the measured absorbance changes, namely, disorientation of receptor outer segments with respect to the path of the incident light, and the loss of outer segments during the detachment and removal of the retina.25 Nevertheless, the technique provides a reliable means by which to compare the relative content of rhodopsin in normal and diseased retinae. 151926 - 28 RESULTS Figure 1 shows representative ERG recordings from a 2-month-old normal mouse and from VPP mice of
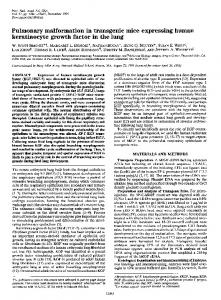
various ages in response to flash stimuli delivered under dark-adapted conditions (Fig. 1A) and presented on a steady background field of 1.60 log cd/m 2 (Fig. IB). Flash luminance was the maximum available (0.85 log cd-sec/m2). It is evident that the amplitudes of the dark-adapted responses from transgenic animals were reduced as early as 1 month after birth and that there was a further reduction in the recordings from older animals. The light-adapted recordings from VPP mice gave a somewhat different picture (Fig. IB). Response amplitudes appeared to be relatively unaffected until approximately 5 months of age and declined thereafter; by 9 months of age, however, the light-adapted response also was markedly reduced. Rod and Cone Contributions to the ERG Waveform There is good evidence to indicate that mouse ERGs evoked by incremental flashes superimposed on a background luminance of 1.60 log cd/m 2 (Fig. IB) are mediated by the cone mechanism,2029 but the relative contributions of the rod and cone systems to the dark-adapted potentials are not immediately apparent. Figure 2 shows results that address this question experimentally. In Figure 2A, the test flash was delivered first to the dark-adapted eye (dashed lines) and then on a background field (0.91 log cd/m 2 , continuous lines) that exerted a strong suppressive effect on rod-mediated responses but had little effect on conemediated potentials.21 The recordings from a normal (N) and a 3-month-old transgenic (VPP) mouse indicate that the cone-mediated receptor potential makes only a negligible contribution to the dark-adapted awave in normal and transgenic mice. However, there is a substantial cone contribution to the dark-adapted b-wave recorded from the normal retina, and this component becomes even more prominent in the darkadapted responses of the VPP mice owing to the profound loss of rod-mediated activity. On the other hand, when a dim test flash was presented to the darkadapted eye, a b-wave-dominated response was elicited (Fig. 2B, dashed line); in this case, the test flash was reduced by almost 3 log units (to —2.12 log cd-sec/ m2) as compared with that of Figure 2A. More important, no response was detectable to the same test flash when superimposed on the weak adapting field (Fig. 2B, solid line), indicating that only rod-mediated responses are activated at this stimulus intensity. Progressive Changes in the Electroretinal Potentials The age-related changes in dark- and light-adapted ERG components of transgenic mice are illustrated in Figures 2C and 2D, respectively. As mentioned earlier, a significant reduction in the ERG amplitude was already evident in the dark-adapted responses of VPP mice at 1 month of age (Fig. 2C). Both the a- and b-
Transgenic Mice Expressing a Mutant Rhodopsin Gene
A
b.
65
Dark-Adapted
B
Light-Adapted
200 /M I 50 MV
-25
0
25
50
75 100 125 150
Time (msec)
-25
0
25
50
75 100 125 150
Time (msec)
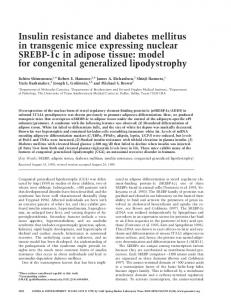
FIGURE l. Electroretinograms obtained from representative normal and VPP mice of different ages to a 0.85 log cd-sec/m2 flash stimulus (A) presented to the dark-adapted eye, or (B) superimposed on a background field of 1.60 log cd/m2. Vertical dashed lines indicate stimulus onset. The amplitude of the a-wave was measured from the prestimulus baseline to the trough of the cornea-negative peak (a). The b-wave was measured from the a-wave trough to the positive peak (b); b-wave implicit times (see Fig. 4) represent the interval from flash onset to the b-wave peak. wave potentials were approximately one half of normal at this stage and declined progressively in the responses from older animals. By 9 months of age, the a-wave was no longer detectable with the recording methods used here, but the b-wave was still in evidence. The apparent retention of the dark-adapted bwave probably reflects the greater photic sensitivity of this response component30 as well as an underlying contribution from the cone-mediated b-wave potential (Fig. 2A). Responses recorded under light-adapted conditions are derived almost exclusively from cone-mediated activity and, as shown in Figure 2D, exhibited very different age-related defects. The b-wave responses were only minimally reduced for the first 5 months after birth, and, although there was a gradual decline thereafter, response amplitudes recorded from 9-month-old animals were still about one third of normal at this relatively advanced age. The Temporal Course of Dark Adaptation Figure 3 illustrates the time-dependent changes in the ERG b-wave after exposure to a preadapting light (2.4 log cd/m 2 ) that bleaches approximately 18% of the available rhodopsin in a normal retina. All responses were elicited with a constant test luminance (—2.12 log cd-sec/m2); note that with this intensity test flash (see Fig. 2B), only the rod system was activated throughout the course of dark adaptation. To minimize intersubject differences in absolute amplitude,
responses for each mouse are expressed as a percentage of the average dark-adapted baseline for that mouse. After extinguishing the light-adapting field, normal mice (open circles) required approximately 10 minutes for amplitude to recover one half its original magnitude and approximately 25 to 30 minutes in darkness to return to the initial dark-adapted level. In normal mice, the response amplitudes overshot the original baseline values. This could be a property of the normal retina or may indicate that the retina had not been fully dark adapted at the onset of light adaptation. Data from the VPP mice (filled circles) show that the recovery of response amplitude during dark adaptation was grossly abnormal. The rate of recovery was retarded (ti /2 = 40 minutes), and response amplitudes did not reach the preexposure level within a 2hour period of dark adaptation.
Rhodopsin and Retinal Sensitivity Table 1 presents data on the rhodopsin density measurements and a-wave amplitude recordings from normal animals and VPP mice at 1 and 2 months of age. Rhodopsin values represent absorbance measurements (ADJ a t the peak of the difference spectrum (x = 510 nm; see Fig. 4B). Note that at comparable ages, the two metrics are reduced relative to the normal by approximately the same proportion. Thus, at 1 month of age, the values for AD510 and for the a-wave amplitude are reduced to 45% and 46% of normal, respectively, whereas at 2 months, the corresponding
66
Investigative Ophthalmology & Visual Science, January 1995, Vol. 36, No. 1
Dark-Adapted
-25 0 25 50 75 100 125 150
Time (msec)
N1
2 3 4 5 6 7 8 9
Age (months)
FIGURE 2. (A) Electroretinographic recordings from a normal (N) and a VPP mouse to a 0.85 log cd-sec/m2 flash stimulus presented in the dark (dotted lines) or against a 0.91 log cd/m 2 adapting field (continuous lines). Vertical dashed lines indicate the time of flash presentation. (B) Responses from a normal mouse elicited with the dim flash used to monitor dark adaptation (—2.12 log cd-sec/m2) presented under the same adaptation conditions as in (A). Note the absence of an underlying cone component in both the dark- and lightadapted responses. (C) Age-related changes in the amplitude of the dark-adapted ERG awave (circles) and b-wave (triangles). Open symbols represent the mean of 28 normal mice. Seven to 10 VPP mice were tested at 1 to 4 months; three to four VPP mice were tested at later ages. Error bars indicate ±1 SEM and are omitted when smaller than the plotted point. (D) Age-related changes in the amplitude of the cone electroretinographic b-wave; symbols as in (C).
20
80
100
Minutes in Dark FIGURE 3. Rod b-wave amplitude recovery during dark adaptation after the termination of a 2.4 log cd/m2 background field; all responses were elicited with a constantflashluminance of —2.12 log cd-sec/m2. Amplitudes obtained from each mouse are normalized to the average baseline response obtained after dark adaptation. Open circles represent averaged (±1 SEM) results obtained from six normal 2-monthold mice. Filled circles indicate results obtained from four 2-month-old VPP mice.
reductions are to 32% and 25% of normal. As shown in Figure 4A, this relation applies also when retinal thresholds, derived from ERG measurements, are plotted as a function of the rhodopsin density, expressed as percent of normal. Three different indices of threshold were used: (i) the luminance required to generate a criterion a-wave response of 50 /uV (ii) the luminance giving rise to a 100 JJLV b-wave, and (iii) the luminance required to evoke a b-wave with an implicit time of 80 msec (a point that falls on the linear portion of the function relating b-wave implicit time to stimulus luminance; see Fig. 4C). The data for each of these threshold measures is approximated by a curve (solid line) that relates threshold elevations to a decrease in the probability of quantal absorption by rhodopsin.22 This so-called "probability function" has been shown to hold in patients with various forms of Rp15'26>27 a n d for conditions in which the rhodopsin density measurements are low due to a reduced length of the rod outer segments, for example, in the developing retina.31 The dashed line shows results obtained in rat,32 and represents the log-linear relation between b-wave threshold and rhodopsin density that applies to situations in which a fraction of the native rhodopsin is
Transgenic Mice Expressing a Mutant Rhodopsin Gene
TABLE l. Rhodopsin Density and Maximum a-Wave Amplitudes of Normal and Transgenic Mice Number of Animals
Rhodopsin AD5W
ERG a-wave (fiV)
7 6 6
0.152 ± 0.011 0.070 ± 0.005 0.048 ± 0.008
523.3 ± 57.5 233.5 ± 10.0 131.4 ± 18.1
Normal VPP 1 month VPP 2 month
ERGs were recorded from mice that were dark adapted overnight; a-wave data are for responses to a 0.85 log cd-sec/m2 flash stimulus. One to 2 days later, the same mice were again dark adapted and killed, and the retinas were isolated for rhodopsin densitometry. Tabulated values give the mean ± SEM.
depleted either by bleaching32 or as a consequence of vitamin A deficiency.2633"36 It is clear that the data obtained from the VPP mice are not fit well by the log-linear relation.
DISCUSSION The main objectives of the present study were to examine the effects on retinal function of the expression of the VPP point mutations in the murine rhodopsin gene and to assess some of the factors that might be responsible for the genetically induced abnormalities in structure and function. These mutations result in a slow degeneration of the rod photoreceptors, as demonstrated both histologically1011 and by the gradual reduction in a-wave amplitude of the rod-mediated ERG (Figs. 1 A, 2C). Moreover, it appears that the VPP mutations exert an effect on the development of the rod photoreceptors. Although the inner retina develops normally and the outer nuclear layer appears initially to contain a normal complement of photoreceptor nuclei, the rod outer segments never achieve the length seen in age-matched normal mice and they become progressively shorter as the disease progresses.10" This is consistent with the observation that the rod receptor potential (a-wave) is reduced by ~50% at the earliest age (1 month) at which the ERG was tested (Fig. 1A) and declines as a function of age (Fig. 2C). Because the transgene is expressed only in rods, the VPP mutations would be expected to spare initially the cone system, and the electroretinographic results indicate that this is indeed the case. The conemediated ERG amplitudes remained relatively normal until approximately 5 months of age, and only then did they begin to decrease (Figs. IB, 2D). This observation suggests that cone dysfunction occurs subsequent to rod degeneration in VPP mice and reflects perhaps a structural disorganization of cone photoreceptors due to the loss of support provided by neighboring rods, or to the effects of some toxic by-product of rod degeneration. In any case, the factors underlying the
67
various anomalies in the cone ERG remain to be identified. Abnormalities in the recovery of ERG amplitude during dark adaptation (Fig. 3) provide a potentially important insight into the nature of the disease process. It is not possible with noninvasive techniques to identify the molecular basis for the remarkably slow time course over which dark adaptation proceeds in the VPP mice. Nevertheless, it is noteworthy that similar aberrations have been reported for psychophysical measures of dark adaptation in patients who have ADRP with the P23H rhodopsin mutation,15 as well as in some individuals with RP involving a different rhodopsin mutation 37 or in whom genetic tests were not performed.38 There are obviously a number of possible explanations to account for this type of anomaly. The delay could reflect a defect in the processes underlying the regeneration of rhodopsin. For example, the VPP mutations might interfere with the process by which rhodopsin is reformed after bleaching. The binding site for the chromophore is located within the transmembrane domain of the opsin molecule,39 but there is evidence to suggest that the protein-chromophore interaction may be modified by changes in the intradiskal regions of the molecule,40 including the N-terminus.41 Thus, there is the possibility that the VPP mutations interfere with the mechanism by which 11-a.wetinaldehyde enters the binding pocket of the mutant opsin. Alternatively, a delay in dark adaptation could be caused by prolonged lifetimes of phototransduction byproducts that desensitize the rods.42 Photoactivated rhodopsin (R*) is normally inactivated by a sequence of events involving phosphorylation and arrestin binding.43 Any interference with these interactions by the mutated opsin molecules might produce delays in the recovery of visual sensitivity. However, each of the forgoing hypothetical scenarios implicates processes initiated by the photoactivation of rhodopsin, and there is reason to doubt that these types of abnormalities are instrumental in triggering the disease process. The results of recent studies (Naash et al, manuscript in preparation) have shown that VPP mice reared in darkness from birth undergo a progressive, albeit slower, retinal degeneration similar to that seen in animals reared in cyclic lighting. Determining the mechanism underlying the delayed dark adaptation observed in VPP mice and in patients with the P23H form of ADRP is clearly a significant question for future studies. There remains, of course, the possibility that the mutant rhodopsin of VPP mice is a constitutively active molecule that gives rise to a persistent 'dark light.' As mentioned earlier, it has been suggested16 that sustained activation of the transduction process may induce degenerative changes similar to those produced by prolonged exposure to light itself.44"46 Interestingly, there are a number of point mutations that re-
68
Investigative Ophthalmology & Visual Science, January 1995, Vol. 36, No. 1
suit in opsins capable of constitutively activating transducin when expressed in an in vitro assay system.1718'47 However, the presence of these mutations in humans results in widely disparate disorders, ranging from congenital stationary night blindness47''8 to a rapidly progressive form of RP.6 Neither of these conditions is similar in their functional consequences to those expressed by the VPP mice or patients who have ADRP with the P23H mutation in rhodopsin, nor has it been shown unequivocally that under light conditions that lead to photic injury, the activation of transducin per se is the event that induces the degenerative process. Also inconsistent with the equivalent light hypothesis are the results shown in Figure 4, wherein log thresholds (the logarithm of the luminance required to achieve a criterion response) are plotted as a function of the rhodopsin content of the retina (expressed on a linear scale). Studies on a variety of vertebrate species, including humans, have shown that denuding opsin of its chromophore, whether by photic bleach-
3.0 ,.
E
ing22'32'49 or vitamin A deprivation,26'34 36, leads to a disproportionately large loss of visual sensitivity relative to that expected simply from the decrease in quantal absorption. For reasons that are still unclear, the results seem to be best approximated by a loglinear relationship; b-wave data from rat32 provide a good example of this sort of relation (dashed line, Fig. 4A), although the slope of the function may differ for other species.22 The results obtained for the VPP mice fail to fit a pattern consistent with the equivalent light hypothesis. The data points of Figure 4 do not deviate significantly from the continuous curve that describes the function to be expected if the probability of quantal absorption were the sole determinant of the rise in threshold. In these circumstances, reducing the rhodopsin content of the rods by 50% would produce a twofold (0.3 log unit) rise in threshold, whereas a reduction of 90% would elevate threshold by only tenfold (1 log unit). This is consistent with the short rod outer segments of VPP mice seen histologically
A
• a-wave (50 /iV) 2.0+ A b-wave (80 msec) • b-wave (100/iV)
-2.0
-3
N 100
50
25
-2
-1
0
log cd-sec/m 2
Percent Rhodopsin FIGURE 4. (A) The relation between electrically recorded thresholds (1/sensitivity) and the relative content of rhodopsin in normal (open symbols) and transgenic {filled symbols) mice. Three threshold criteria were used: the intensity required to elicit a 50-//V a-wave {circles), a 100-^iV b-wave {diamonds), or an 80-msec b-wave (triangles). Data points for normal mice (open symbols) indicate the mean (±1 SEM; N = 7); data points for VPP mice represent the averaged (±1 SEM) value for four mice with similar rhodopsin densities, or the value obtained from a 7.5-month-old mouse with a low rhodopsin density (data at far right). Values for the three measures have been adjusted vertically in order that the normal means coincide. The solid line is the function expected if threshold elevation is due solely to a reduction in quantal absorption. The dashed line represents changes in b-wave threshold recorded during the regeneration of bleached rhodopsin in the rat retina.32 (B) Examples of the absorbance difference spectra (DDi) obtained from a normal mouse (open circles) and from VPP mice at different ages (1 month, filled circles; 2 months, filled triangles; 3 months, filled diamonds). (C) Examples of b-wave implicit time functions. The mean normal function is represented by open circles; individual VPP mice are shown as filled symbols. The solid lines represent the least-squares fit linear regression to the data spanning the linear range of each function. The dashed line indicates the 80-msec criterion from which the threshold luminance was determined.
Transgenic Mice Expressing a Mutant Rhodopsin Gene
and with the ERG evidence that these photoreceptors are capable of functioning surprisingly well with this degree of structural impairment.10 Although it seems difficult to reconcile the retention of rod-mediated electrical activity with such gross losses in the rhodopsin content of the visual cells, it should be noted that similar findings have been reported in individuals with the P23H rhodopsin mutation,1'5 as well as in other patients with ADRP in whom the gene mutations were not identified.19'2627 This situation, and the observation that the rod outer segments of VPP mice become progressively shorter with age,10 raise the possibility that one consequence of the opsin mutation is an imbalance between the rates of disk formation and disk shedding.1926 The mutant opsin may induce a more rapid rate of disk shedding, or it may somehow impede the processes by which newly formed opsin is transported to, or inserted into, the disk membranes. In either event, the delicate balance between new disk formation and disk shedding is upset, and there follows a progressive shortening and eventual death of the visual cells. It is important to recall that the rhodopsin expressed in the VPP mice includes three point mutations: V20G, P23H, and P27L. Although P23H is responsible for some forms of human ADRP,1"3'15 neither V20G nor P27L have been identified to date in patients with ADRP.50 This observation, and the fact that proline 23 is highly conserved among normal opsins in a wide variety of species,51 make it highly likely that the P23H mutation is primarily responsible for the retinal degeneration seen in the VPP mice. Nevertheless, it would be circumspect to determine whether mutations V20G, P27L, or both, contribute in some way to the degenerative process; lines expressing only one or the other of these mutations are necessary to address this possibility. Another fundamental issue that will be important for our understanding of the morphologic and physiological abnormalities observed in the transgenic animals concerns the functional status of the opsin induced by the VPP mutation. At present, we have no evidence as to whether the mutant opsin expressed in the VPP mice is capable of binding retinoid and interacting with the enzymes of the transduction cascade, or indeed whether it is inserted into the rod disk membranes.52'53 These questions are currently under investigation, and the outcome will obviously influence the interpretation of the data presented in this study. These issues aside, the results of our experiments have identified several important functional similarities between the VPP mice and human subjects with the P23H form of ADRP. Individuals with the P23H mutation exhibit a relatively slow rod degeneration with initial sparing of cone function,1'2 an unusually slow rate of dark-adaptation,15 and threshold elevations that can be ascribed solely to the reduced proba-
69
bility of quantal absorption resulting from the diminished rhodopsin content of the rods.lD The results of the present study indicate that each of these characteristics is shared by the VPP mice. In view of the decadeslong time course of human ADRP, the VPP mice appear to provide a useful animal model in which to examine the mechanisms by which mutations in the N-terminus region of rhodopsin disrupt the functional and structural integrity of the visual cells and lead ultimately to a widespread retinal degeneration. Key Words retinitis pigmentosa, electroretinogram, visual sensitivity, rhodopsin density, transgenic mice Acknowledgments The authors thank Dr. Duco Hamasaki for advice on mouse anesthesia and Drs. Kenneth Alexander, Muayyad Al-Ubaidi, Gerald Fishman, Paul Malchow, and David Pepperberg for comments on the manuscript. The authors also thank Jane Zakevicius and Yifan Sun for invaluable services throughout the course of the study. References 1. Dryja TP, McGee TL, Reichel E, et al. A point mutation of the rhodopsin gene in one form of retinitis pigmentosa. Nature. 1990;343:364-366. 2. Berson EL, Rosner B, Sandberg MA, Dryja TP. Ocular findings in patients with autosomal dominant retinitis pigmentosa and a rhodopsin gene defect (pro-23-his). Arch Ophthalmol. 1991; 109:92-101. 3. Diyja TP, Hahn LB, Cowley GS, McGee TL, Berson EL. Mutation spectrum of die rhodopsin gene among patients with autosomal dominant retinitis pigmentosa. Proc Natl Acad Sti USA. 1991;88:9370-9374. 4. Gal A, Ardich A, Ludwig M, Niemeyer G, Schwinger E, Schinzel A. Pro347Arg mutation of the rhodopsin gene in autosomal dominant retinitis pigmentosa. Genomics. 1991; 11:468-470. 5. Inglehearn CF, Bashir R, Lester DH, Jay M, Bird AC, Bhattacharya SS. A 3-bp deletion in the rhodopsin gene in a family with autosomal dominant retinitis pigmentosa. AmJHum Genet. 1991;48:26-30. 6. Keen TJ, Inglehearn CF, Lester DH, et al. Autosomal dominant retinitis pigmentosa: Four new mutations in rhodopsin, one of them in the retinal attachment site. Genomics. 1991; 11:199-205. 7. Sheffield VC, Fishman GA, Beck JS, Kimura AE, Stone EM. Identification of novel rhodopsin mutations associated with retinitis pigmentosa by GC-clamped denaturing gradient gel electrophoresis. Am J Hum Genet. 1991;49:699-706. 8. Sung C-H, Davenport CM, Hennessey JC, et al. Rhodopsin mutations in autosomal dominant retinitis pigmentosa. Proc Natl Acad Sti USA. 1991;88:6481-6485. 9. Olsson JE, Gordon JW, Pawlyk BS, et al. Transgenic mice with a rhodopsin mutation (Pro23His): A mouse model of autosomal dominant retinitis pigmentosa. Neuron. 1992;9:815-830. 10. Naash MI, Hollyfield JG, Al-Ubaidi MR, Baehr W. Sim-
70
11.
12.
13.
14.
15.
16.
17.
18.
19. 20.
21.
22. 23.
24.
25.
26.
27.
Investigative Ophthalmology & Visual Science, January 1995, Vol. 36, No. 1 ulation of human autosomal dominant retinitis pigmentosa in transgenic mice expressing a mutated murineopsin gene. ProcNatlAcadSti USA. 1993;90:54995503. Naash MI, Al-Ubaidi MR, Hollyfield JG, Baehr W. Simulation of autosomal dominant retinitis pigmentosa in transgenic mice. In: Hollyfield JG, Anderson RE, LaVail MM, eds. Retinal Degeneration: Clinical and Laboratory Applications. New York: Plenum; 1993:201-210. Chen J, Woodford B, Jiang H, Nakayama T, Simon MI. Expression of a G-terminal truncated rhodopsin gene leads to retinal degeneration in transgenic mice. ARVO Abstracts. Invest Ophthalmol Vis Sci. 1993; 34:768. Wong, F. Creating transgenic mouse models of photoreceptor degeneration caused by mutations in the rhodopsin gene. In: Hollyfield JG, Anderson RE, LaVail MM, eds. Retinal Degeneration: Clinical and Laboratory Applications. New York: Plenum; 1993:211-217. Sung C-H, Makino C, Baylor D, Nathans J. A rhodopsin gene mutation responsible for autosomal dominant retinitis pigmentosa results in a protein that is defective in localization to the photoreceptor outer segment. J Neurosci. 1994; 14:5818-5833. Kemp CM, Jacobson SG, Roman AJ, Sung C-H, Nathans J. Abnormal rod dark adaptation in autosomal dominant retinitis pigmentosa with proline-23-histidine rhodopsin mutation. Am J Ophthalmol. 1992; 113:165-174. Fain GL, Lisman JE. Photoreceptor degeneration in vitamin A deprivation and retinitis pigmentosa: The equivalent light hypothesis. Exp Eye Res. 1993;57:335340. Robinson PR, Cohen GB, Zhukovsky EA, Oprian DD. Constitutively active mutants of rhodopsin. Neuron. 1992;9:7l9-725. Rao VR, Cohen GB, Oprian DD. Rhodopsin mutation G90D and a molecular mechanism for congenital night blindness. Nature. 1994; 367:639-642. Ripps H. Night blindness revisited: From man to molecules. Invest Ophthalmol Vis Sci. 1982;23:588-609. Peachey NS, Goto Y, Al-Ubaidi MR, Naash MI. Properties of the mouse cone-mediated electroretinogram during light adaptation. Neurosci Lett. 1993; 162:9-11. Hood DC, Birch DG. Human cone receptor activity: The leading edge of the a-wave and models of receptor activity. Vis Neurosci. 1993; 10:857-871. Dowling JE, Ripps H. Visual adaption in the retina of the skate. / Gen Physiol. 1970;56:491-520. Ripps H, Snapper A. Computer analysis of photochemical changes in die human retina. Compul Biol Med. 1974; 4:107-122. Ripps H, Mehaffey L III, Siegel IM, Ernst W, Kemp CM. Flash photolysis of rhodopsin in the cat retina. / Gen Physiol. 1981;77:295-315. Sun Y, Ripps H. Rhodopsin regeneration in the normal and in the detached/replaced retina of the skate. Exp Eye Res. 1992;55:679-689. Ripps H, Brin KP, Weale RA. Rhodopsin and visual threshold in retinitis pigmentosa. Invest Ophthalmol Vis Sci. 1978; 17:735-745. Perlman I, Auerbach E. The reladonship between vi-
28.
29.
30.
31.
32.
33.
34. 35. 36.
37.
38.
39.
40. 41.
42.
43. 44.
45.
46.
sual sensitivity and rhodopsin density in retinitis pigmentosa. Invest Ophthalmol Vis Sci. 1981; 20:758-765. Highman VN, Weale RA. Rhodopsin density and visual threshold in retinitis pigmentosa. Am J Ophthalmol. 1973; 75:822-832. Peachey NS, Goto Y, Al-Ubaidi MR, Naash MI. Rod and cone dysfunction in transgenic mice. In: Vision Science and its Applications, 1994 Technical Digest Series. Vol. 2. Washington, DC: Optical Society of America; 1994:362-365. Hood DC, Birch DG. A computational model of the amplitude and implicit time of the b-wave of the human ERG. Vis Neurosci. 1992;8:107-126. Engbretson GA, Witkovsky P. Rod sensitivity and visual pigment concentration in Xenopus. J Gen Physiol 1978; 72:801-819. Perlman I. Kinetics of bleaching and regeneration of rhodopsin in abnormal (RCS) and normal albino rats in vivo. /Physiol. 1978; 278:141-159. Kemp CM, Jacobson SG, Faulkner DJ, Walt RW. Visual function and rhodopsin levels in humans with vitamin A deficiency. Exp Eye Res. 1988;46:185-197. Dowling JE, Wald G. Vitamin A deficiency and night blindness. Proc Natl Acad Sci USA. 1958;44:648-661. Dowling JE. The chemistry of visual adaptation in the rat. Nature. 1960; 188:114-118. Witkovsky P, Gallin E, Hollyfield JG, Ripps H, Bridges CDB. Photoreceptor thresholds and visual pigment levels in normal and vitamin A-deprived Xenopus tadpoles. J Neurophysiol. 1976;39:1272-1287. Moore AT, Fitzke FW, Kemp CM, et al. Abnormal dark adaptation kinetics in autosomal dominant sector retinitis pigmentosa due to rod opsin mutation. BrJ Ophthalmol 1992; 76:465-469. Alexander KR, Fishman GA. Prolonged rod dark adaptation in retinitis pigmentosa. Br J Ophthalmol. 1984;68:561-569. Franke RR, Sakmar TP, Graham RM, Khorana HG. Structure and function in rhodopsin: Studies of the interaction between the rhodopsin cytoplasmic domain and transducin./Bio/ Chem. 1992;267:1476714774. Khorana HG. Rhodopsin, photoreceptor of the rod ceti.JBiol Chem. 1992;267:1-4 Doi T, Molday R, Khorana H. Role of the intradiskal domain in rhodopsin assembly and function. Proc Natl Acad Sci USA. 1990;87:4991-4995. Lamb TD. Dark adaptation: A re-examination. In: Hess RF, Sharpe LT, Nordby K, eds. Night Vision. Cambridge: Cambridge University Press; 1990: 177-222. Stryer L. Molecular basis of visual excitation. Cold Spring Harb Symp Quant Biol. 1988;53:283-294. Rapp L, Williams T. A parametric study of retinal light damage in albino and pigmented rats. In: Williams T, Baker B, eds. The Effects of Constant Light on Visual Processes. New York: Plenum; 1980:135-159. Noell WK. Possible mechanisms of photoreceptor damage by light in mammalian eyes. Vision Res. 1980;20:1163-1171. Noell WK, Walker VS, Kang BS, Berman S. Retinal damage by light in rats. Invest Ophthalmol 1966;5:450-473.
Transgenic Mice Expressing a Mutant Rhodopsin Gene 47. Dryja TP, Berson EL, Rao VR, Oprian DD. Heterozygous missense mutation in the rhodopsin gene as a cause of congenital stationary night blindness. Nature Genet. 1993;4:280-283. 48. Sieving PA, Richards JE, Bingham EL, Naarendorp F. Dominant congenital complete nyctalopia and Gly90Asp rhodopsin mutation. ARVO Abstracts. Invest Ophthalmol Vis Sci. 1992;33:1397. 49. Rushton WAH. Rhodopsin measurement and darkadaptation in a subject deficient in cone vision. J Physiol. 1961; 156:193-205.
71 50. Berson EL. Retinitis pigmentosa. Invest Ophthalmol Vis Sci. 1993; 34:1659-1676. 51. Applebury ML, Hargrave PA. Molecular biology of the visual pigments. Vision Res. 1986;26:1881-1895. 52. Sung C-H, Schneider BG, Agarwal N, Papermaster DS, Nathans J. Fuctional heterogeneity of mutant rhodopsins responsible for autosomal dominant retinitis pigmentosa. ProcNatAcad Sci USA. 1991; 88:8840-8844. 53. Sung C-H, Davenport CM, Nathans J. Rhodopsin mutations responsible for autosomal dominant retinits pigmentosa. J Biol Chem, 1993;268:26645-26649.