Functional Brain Networks Develop from a ‘‘Local to Distributed’’ Organization Damien A. Fair1.*, Alexander L. Cohen2., Jonathan D. Power2, Nico U. F. Dosenbach2, Jessica A. Church2, Francis M. Miezin2,3, Bradley L. Schlaggar2, Steven E. Petersen4* 1 Behavioral Neuroscience Department, Oregon Health and Science University, Portland, Oregon, United States of America, 2 Department of Neurology, Washington University School of Medicine, St. Louis, Missouri, United States of America, 3 Department of Radiology, Washington University School of Medicine, St. Louis, Missouri, United States of America, 4 McDonnell Center for Higher Brain Functions, Washington University School of Medicine, St. Louis, Missouri, United States of America
Abstract The mature human brain is organized into a collection of specialized functional networks that flexibly interact to support various cognitive functions. Studies of development often attempt to identify the organizing principles that guide the maturation of these functional networks. In this report, we combine resting state functional connectivity MRI (rs-fcMRI), graph analysis, community detection, and spring-embedding visualization techniques to analyze four separate networks defined in earlier studies. As we have previously reported, we find, across development, a trend toward ‘segregation’ (a general decrease in correlation strength) between regions close in anatomical space and ‘integration’ (an increased correlation strength) between selected regions distant in space. The generalization of these earlier trends across multiple networks suggests that this is a general developmental principle for changes in functional connectivity that would extend to large-scale graph theoretic analyses of large-scale brain networks. Communities in children are predominantly arranged by anatomical proximity, while communities in adults predominantly reflect functional relationships, as defined from adult fMRI studies. In sum, over development, the organization of multiple functional networks shifts from a local anatomical emphasis in children to a more ‘‘distributed’’ architecture in young adults. We argue that this ‘‘local to distributed’’ developmental characterization has important implications for understanding the development of neural systems underlying cognition. Further, graph metrics (e.g., clustering coefficients and average path lengths) are similar in child and adult graphs, with both showing ‘‘small-world’’-like properties, while community detection by modularity optimization reveals stable communities within the graphs that are clearly different between young children and young adults. These observations suggest that early school age children and adults both have relatively efficient systems that may solve similar information processing problems in divergent ways. Citation: Fair DA, Cohen AL, Power JD, Dosenbach NUF, Church JA, et al. (2009) Functional Brain Networks Develop from a ‘‘Local to Distributed’’ Organization. PLoS Comput Biol 5(5): e1000381. doi:10.1371/journal.pcbi.1000381 Editor: Olaf Sporns, Indiana University, United States of America Received January 30, 2009; Accepted April 1, 2009; Published May 1, 2009 Copyright: ß 2009 Fair et al. This is an open-access article distributed under the terms of the Creative Commons Attribution License, which permits unrestricted use, distribution, and reproduction in any medium, provided the original author and source are credited. Funding: This work was supported by National Institutes of Health grants NS053425 (BLS), NS41255 and NS46424 (SEP), and NS062489 (ALC), National Science Foundation IGERT grant 0548890 (ALC), the John Merck Scholars Fund, the Burroughs-Wellcome Fund, the Dana Foundation, and the Ogle Family Fund (BLS), and the Washington University Chancellor’s Graduate Fellowship and UNCF/Merck Graduate and Postgraduate Science Research Fellowship (DAF). The funders had no role in study design, data collection and analysis, decision to publish, or preparation of the manuscript. Competing Interests: The authors have declared that no competing interests exist. * E-mail:
[email protected] (DAF);
[email protected] (SEP) . These authors contributed equally to this work.
In addition to fMRI activation studies, the relatively new and increasingly utilized method of resting state functional connectivity MRI (rs-fcMRI) allows for a complementary examination of the functional relationships between regions across development. Resting state fcMRI is based on the discovery that spontaneous low-frequency (,,0.1 Hz) blood oxygen level dependent (BOLD) signal fluctuations in sometimes distant, but functionally-related grey matter regions, show strong correlations at rest [11]. These low frequency BOLD fluctuations appear to relate to spontaneous neural activity [11–13]. In effect, rs-fcMRI evaluates regional interactions that occur when a subject is not performing an explicit task (i.e., subjects are ‘‘at rest’’) [11,12,14–23]. To date, rs-fcMRI has been used in several domains to examine systems-level organization of motor [11], memory [24,25], attention [26], and task control systems [21,22,27]. In addition, because rs-fcMRI does not require active engagement in a behavioral task, it unburdens experimental
Introduction The mature human brain is both structurally and functionally specialized, such that discrete areas of the cerebral cortex perform distinct types of information processing. These areas are organized into functional networks that flexibly interact to support various cognitive functions. Studies of development often attempt to identify the organizing principles that guide the maturation of these functional networks. [1–6]. A major portion of the work investigating the nature of functional human brain development is based on results from functional magnetic resonance imaging (fMRI) studies. By examining the differences in the fMRI activation profile of a particular brain region between children, adolescents, and adults, the developmental trajectory of that region’s involvement in a cognitive task can be outlined [3,5,7–10]. These experiments have been crucial to our current understanding of typical and atypical brain development. PLoS Computational Biology | www.ploscompbiol.org
1
May 2009 | Volume 5 | Issue 5 | e1000381
Brain Develops from Being ‘‘Local to Distributed’’
Spontaneous correlated activity within brain networks develops over age
Author Summary The first two decades of life represent a period of extraordinary developmental change in sensory, motor, and cognitive abilities. One of the ultimate goals of developmental cognitive neuroscience is to link the complex behavioral milestones that occur throughout this time period with the equally intricate functional and structural changes of the underlying neural substrate. Achieving this goal would not only give us a deeper understanding of normal development but also a richer insight into the nature of developmental disorders. In this report, we use computational analyses, in combination with a recently developed MRI technique that measures spontaneous brain activity, to help us to understand the principles that guide the maturation of the human brain. We find that brain regions in children communicate with other regions more locally but that over age communication becomes more distributed. Interestingly, the efficiency of communication in children (measured as a ‘small world’ network) is comparable to that of the adult. We argue that these findings have important implications for understanding both the maturation and the function of neural systems in typical and atypical development.
In two prior developmental studies, we used rs-fcMRI to examine the development of the task control and cerebellar functional networks [22] and, separately, the default mode network [32]. The first study, addressing functional connectivity changes within and between the two task control networks and the cerebellar network [22], showed that the structure of these networks differed between children and adults in several ways (see [22]). In general, many of the specific changes showed trends of decreases in shortrange functional connections (i.e., correlations between regions close in space) and increases in long-range functional connections (i.e., correlations between regions more distant in space). We suggested that these global developmental processes support the maturation of a dual-control system and its functional connections with the cerebellar network [22]. These results have now been replicated in a developmental resting connectivity study targeting sub-regions of the anterior cingulate [34]. The development of the default mode network was independently examined in a separate analysis [32]. In children, the default mode network was only sparsely functionally connected. Many regions were relatively isolated with few or no functional connections to other default mode regions. Over age, correlations within the default mode network increased and by adulthood it had matured into a fully integrated system. Interestingly, as opposed to the task-control and cerebellar networks, very few short-range functional connections involving the default mode network regions existed in children. Hence the numerous strong short-range functional connections that decreased with age when investigating the dual control networks were not seen within the default network. In fact, some connections such as the functional connection between the ventromedial prefrontal cortex (vmPFC; 23, 39, 22) and anterior medial prefrontal cortex (amPFC; 1, 54, 21) regions, which are fairly close in space (i.e., short-range at ,2.7 cm), had a substantial increase in correlation strength over development [32]. The observation that different analyses suggested different developmental features suggests a need for a more nuanced and integrated characterization of the development of functional networks. The goal of this manuscript is to employ several different network analysis tools to provide such a characterization. Visualization techniques such as spring embedding, and quantitative measures, including ‘small world’ metrics and community detection algorithms, will be applied to these networks in an attempt to identify principles for the changes observed across development. Because of the overlapping and sometimes inconsistent use of terminology between neuroscience and the computational sciences, we will briefly define two terms for the purposes of this paper. The term ‘‘networks’’ will be used in the typical cognitive neuroscience formulation: a group of functionally related brain regions (as described above). The overall collection of regions (encompassing all four ‘‘networks’’) will be referred to as the ‘‘graph.’’
design, subject compliance, and training demands. Thus, rs-fcMRI is becoming a frequently used tool for examining changes in network structure in disease [28–31], in aging [24,29], and across development [22,32–35].
Resting-state fcMRI identifies separable brain networks in adults In previous work regarding task-level control in adults, we applied rs-fcMRI to a set of regions derived from an fMRI metaanalysis that included studies of control-demanding tasks. This analysis revealed that brain regions exhibiting different combinations of control signals across many tasks are grouped into distinct ‘‘frontoparietal’’ and ‘‘cingulo-opercular’’ functional networks [21,36] (see Table 1 and Figure 1). Based on functional activation profiles of these regions characterized in the previous fMRI study, the frontoparietal network appears to act on a shorter timescale, initiating and adjusting top-down control. In contrast, the cingulo-opercular network operates on a longer timescale providing ‘‘set-initiation’’ and stable ‘‘set-maintenance’’ for the duration of task blocks [37]. Along with these two task control networks [21,36], a set of cerebellar regions showing error-related activity across tasks [36] formed a separate cerebellar network (Figure 1). In adults, the cerebellar network is functionally connected with both the frontoparietal and cingulo-opercular networks [21,22]. These functional connections may represent the pathways involved in task level control that provide feedback information to both control networks [22,36]. Another functional network, and one of the most prominent sets of regions to be examined with rs-fcMRI, is the ‘‘default mode network’’. The default mode network (frequently described as being composed of the bilateral posterior cingulate/precuneus, inferior parietal cortex, and ventromedial prefrontal cortex) was first characterized by a consistent decrease in activity during goaldirected tasks compared to baseline [38,39]. Resting-state fcMRI analyses have repeatedly shown that these regions, along with associated medial temporal regions, are correlated at rest in adults [15,16,32,40]. While the distinct function of the default mode network is often linked to internally directed mental activity [39], this notion continues to be debated [25,32,41–44]. PLoS Computational Biology | www.ploscompbiol.org
Results Spring-embedded visualization in combination with functional connectivity suggests that regions are linked more locally in childhood and are more distributed in adulthood Graph theory analyses were applied to 210 subjects, aged 7–31, to investigate the emergence of temporal correlations in sponta2
May 2009 | Volume 5 | Issue 5 | e1000381
Brain Develops from Being ‘‘Local to Distributed’’
Table 1. Regions, coordinates, and properties.
Regions of Interest (ROI)
ROI Abbreviations
Coordinates
x
y
Functional Network
Network Color
z
dorsolateral prefrontal cortex
dlPFC
243
22
34
Fronto_Parietal
Yellow
dorsolateral prefrontal cortex
dlPFC
43
22
34
Fronto_Parietal
Yellow
Frontal
frontal
241
3
36
Fronto_Parietal
Yellow
Frontal
frontal
41
3
36
Fronto_Parietal
Yellow
mid cingulate cortex
mCC
0
229
30
Fronto_Parietal
Yellow
inferior parietal lobule
IPL
251
251
36
Fronto_Parietal
Yellow
inferior parietal lobule
IPL
51
247
42
Fronto_Parietal
Yellow
intraparietal sulcus
IPS
231
259
42
Fronto_Parietal
Yellow
intraparietal sulcus
IPS
30
261
39
Fronto_Parietal
Yellow
Precuneus
Precun
29
272
37
Fronto_Parietal
Yellow
Precuneus
Precun
10
269
39
Fronto_Parietal
Yellow
anterior Prefrontal Cortex
aPFC
228
51
15
Cingulo_Opercular
Black
anterior Prefrontal Cortex
aPFC
27
50
23
Cingulo_Opercular
Black
anterior insula/frontal operculum
aI/fO
235
14
5
Cingulo_Opercular
Black
anterior insula/frontal operculum
aI/fO
36
16
4
Cingulo_Opercular
Black
dorsal anterior cingulate/medial superior frontal cortex
dACC/msFC
21
10
46
Cingulo_Opercular
Black
superior frontal cortex
ant thal
212
215
7
Cingulo_Opercular
Black
anterior thalamus
ant thal
10
215
8
Cingulo_Opercular
Black
anterior thalamus
amPFC
1
54
21
Default
Red
ventromedial prefrontal cortex
vmPFC
23
39
22
Default
Red
superior frontal cortex
sup frontal
214
38
52
Default
Red
superior frontal cortex
sup frontal
17
37
52
Default
Red
inferior temporal
inf templ
261
233
215
Default
Red
inferior temporal
inf templ
65
217
215
Default
Red
parahippocampal
parahippo
222
226
216
Default
Red
parahippocampal
parahippo
25
226
214
Default
Red
posterior cingulate cortex
pCC
22
236
37
Default
Red
lateral parietal
latP
247
267
36
Default
Red
lateral parietal
latP
53
267
36
Default
Red
retro splenial
retro splen
3
251
8
Default
Red
lateral cerebellum
lat cereb
232
266
229
Cerebellar
Blue
lateral cerebellum
lat cereb
31
261
229
Cerebellar
Blue
inferior cerebellum
inf cereb
219
278
233
Cerebellar
Blue
inferior cerebellum
inf cereb
18
280
233
Cerebellar
Blue
doi:10.1371/journal.pcbi.1000381.t001
neous BOLD activity between regions of the default mode, cerebellar, and two task-control networks. For this initial analysis, average age-group matrices were created using a sliding boxcar grouping of subjects in age-order (i.e., group1: subjects 1–60, group2: subjects 2–61, group3: subjects 3–62, etc.). This generated a series of groups with average ages ranging from 8.48 years to 25.58 years. Each of the groups’ average correlation matrices was converted into a graph, with correlations between regions greater than or equal to 0.1 considered as functionally connected. In a first analysis, we used a visualization algorithm commonly used in graph theoretic analyses known as spring embedding that aids in the qualitative interpretation of graphs (Figure 2 and Video S1) [45]. In spring embedding, the positions of the nodes (i.e., regions) in a graph are based solely on the strength and pattern of functional connections instead of their anatomical locations. In this PLoS Computational Biology | www.ploscompbiol.org
procedure, each functional connection between a pair of nodes is treated as a spring with a spring constant related to the strength of the specific correlation. The entire system of pair-wise regional functional connections is then iteratively allowed to relax to the lowest global energetic state, i.e., groups of nodes that are strongly interconnected will be placed close together even if anatomically distant. By creating spring embedded graphs for each of the sliding boxcar groups in age-order, a movie representation can be made that shows the development of the network relationships (from average age 8.48 to 25.48 years) (Video S1). The panels in Figure 2 provide snapshots from child, adolescent, and adult average ages in this movie. In both Figure 2 and Video S1, each node is colorcoded in two ways: the outer border represents the general anatomical location (i.e., cerebral lobe) of the node; the inner core 3
May 2009 | Volume 5 | Issue 5 | e1000381
Brain Develops from Being ‘‘Local to Distributed’’
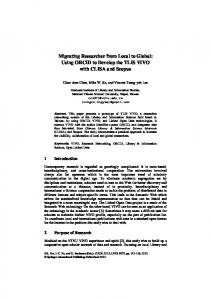
Figure 1. Anatomical location of regions shown in Table 1. Regions are colored by network membership (red – default mode network; black – cingulo-opercular network; yellow – fronto-parietal network; blue – cerebellar network) and shown on an inflated cortical surface represention. doi:10.1371/journal.pcbi.1000381.g001
mode network. Over age, however, the functional connections between default mode network regions mature and the network integrates into a highly correlated system in adults (Figure 2B and Video S1) (also see [32]). We note that these results were not specific to the 60-subject boxcar, and persist with smaller subject boxcars as well (see Video S2).
color represents the coding by ‘‘function’’ as defined by a large number of fMRI studies. One of the primary observations from the movie relates to this anatomical-functional distinction. In children, regions appear to be largely arranged by anatomical proximity. This arrangement can be seen in Figure 2 and Video S1 where, in children, regions can be readily grouped by cerebral lobe (outline colors of spheres in Figure 2 and Video S1). Over age, as functional connections mature, the node arrangements change such that anatomically close regions are now largely distributed across the graph layout, in a pattern more aligned with the mature networks’ functional properties (core colors of spheres in Figure 2) [21,36–39]. Thus, across development, local clusters of regions ‘‘segregate’’ from one another and ‘‘integrate’’ into more distributed adult functional relationships with more distant regions. A group of regions in the frontal cortex provides a particularly salient example of segregation. Frontal cortex contains regions that, in adults, are members of each of the task-control networks (e.g., dlPFC, frontal, dACC/msFC) and the default network (e.g., vmPFC, amPFC). As can be seen in Figure 2A (and Video S1), extensive correlations exist between most of these frontal regions in childhood (see blue cloud Figure 2A). Over the developmental window afforded by the current dataset, some of these strong ‘‘frontal-frontal’’ correlations begin to weaken. With increasing age, regions in the frontal cluster segregate into 3 separate functional networks. Accompanying this segregation is strong integration within the functional networks. The default mode network provides the clearest example. As illustrated in Figure 2B (and in Video S1), correlations between regions of the default mode network are weak (or absent) in children (red cloud, Figure 2B). Just as functional connections between the set of frontal regions are related to their anatomical proximity in children, the regions of the default mode network are each functionally connected to anatomical neighbors, and not to other members of the anatomically dispersed default PLoS Computational Biology | www.ploscompbiol.org
Quantitative modularity analysis confirms the qualitative observations The qualitative observations noted above can be quantified using community structure detection tools. Using such an approach is particularly important because of the bias inherent in relying on qualitative methods for deciding whether groups of regions that appear to be clustered are indeed clustered, and because of the a priori definitions of each network. As stated by Newman: ‘‘A good division of a graph into communities is not merely one in which there are few edges between communities; it is one in which there are fewer than expected edges between communities. If the number of edges between two groups is only what one would expect on the basis of random chance, then few thoughtful observers would claim this constitutes evidence of meaningful community structure. On the other hand, if the number of edges between groups is significantly less than we expect by chance, or equivalently if the number within groups is significantly more, then it is reasonable to conclude that something interesting is going on [46].’’ Among the many methods used to detect communities in graphs, the modularity optimization algorithm of Newman is one of the most efficient and accurate to date [46]. This method uses modularity, a quantitative measure of the observed versus expected intra-community connections, as a means to guide 4
May 2009 | Volume 5 | Issue 5 | e1000381
Brain Develops from Being ‘‘Local to Distributed’’
Figure 2. Over age the graph architecture matures from a ‘‘local’’ organization to a ‘‘distributed’’ organization. In this figure we show the dynamic development and interaction of positive correlations between the two task control networks, the default network, and cerebellar network using spring embedding. The figure highlights the segregation of local, anatomically clustered regions and the integration of functional networks over development. A and B represent individual screen shots (at average ages 8.48, 13.21, and 25.48 years) of dynamic movies (Video S1) of the transition in the network architecture from child to adult ages. Nodes are color coded by their adult network profile (core of the nodes) and also by their anatomical location (node outlines). Black – cingulo-opercular network; Yellow – fronto-parietal network; Red – default network; Blue – cerebellar network; Light blue – frontal cortex; Grey – parietal cortex; Green - temporal cortex, Pink – cerebellum, Light pink – thalamus. Connections with r$0.1 were considered connected. (A) In children regions are largely organized by their anatomical location, but over age anatomically clustered regions segregate. The cluster of frontal regions (highlighted in light blue) best demonstrates this segregation. (B) In children the more distributed adult functional networks are in many ways disconnected. Over development the functional networks integrate. The isolated regions of the default mode network in childhood (highlighted in light red) that coalesce into a highly correlated network best illustrate this integration. Over age node organization shifts from the ‘‘local’’ arrangement in children to the ‘‘distributed’’ organization commonly observed in adults. doi:10.1371/journal.pcbi.1000381.g002
assignments of nodes into communities. We applied the modularity optimization algorithm to the group connectivity matrices derived from the sliding boxcars described above. Measures of modularity (Q) were high, and did not show large changes across the age range (Figure 3A and Figure S1 and Figure S2). This result was not dependent on any particular threshold (Figure S1). Although comparable community structure was detected at all ages examined, the components of the communities varied by age. As per our qualitative approach described above, in children, region clusters were largely arranged by cerebral lobe; while in adults, regions were largely clustered by their adult functional properties (Figure 4A). Again, this result was not unique to any particular threshold (Figure 4B and 4C) or size of boxcar (Figure S3). We do note, however, that limited data points (i.e., subjects) are available between the ages of 16 and 19 years (see Materials and Methods) and that our estimate of the specific transitions within this period should be interpreted with care. PLoS Computational Biology | www.ploscompbiol.org
Over development, functional connections seem to evolve progressively along a ‘‘local to distributed’’ organizational axis As previously reported [22,34], the segregation of closely apposed regions and the integration of distributed functional networks is associated with a general decrease in correlation strength between regions close in space and an increase in correlation strength between many regions distant in space. This trend is shown in Figure 5 and also Figure S4. Long-range functional connections tend to be weak, but increase over time (warm colors above the diagonal in Figure 5C and 5D and Figure S4C and S4D), integrating distant regions into functional networks. Short-range functional connections tend to be stronger (i.e., higher correlation strength) in children, yet those regions that do change predominantly become weaker over age (cool colors below the diagonal in Figure 5A and 5B and Figure S4A and S4B). 5
May 2009 | Volume 5 | Issue 5 | e1000381
Brain Develops from Being ‘‘Local to Distributed’’
Figure 3. Modularity and ‘small world’ topology remain constant over age. In this figure a modularity optimization algorithm is applied, and average clustering coefficients and average path lengths are calculated for each average matrix of the ‘sliding boxcar’ across age (see Materials and Methods). A threshold of r$0.1 was applied to the matrices before calculations were performed and denotes connected versus non-connected region pairs (see Materials and Methods). (A) From childhood through adulthood modularity (Q) remains high and constant. This result is not dependent on a specific threshold as shown in Figure S1. (Note: All age graphs to the right the asterisk show 100% graph connectedness, meaning there is a path between every node in the network. Graphs to the left of the asterisk are 78% graph connected, on average. For details see Materials and Methods and Figure S1). (B) Relative to equivalent lattice and random networks, average clustering coefficients remain high across age and do not appear to be different between children and adults. (C) Relative to equivalent lattice and random networks, average path lengths remain low across age and do not appear to be different between children and adults. High clustering coefficients and short path lengths suggest a ‘small world’ organization that does not change across the age range studied here. 95% confidence intervals are also plotted for clustering coefficients and path lengths for the generated random graphs. doi:10.1371/journal.pcbi.1000381.g003
However, there are some interesting nuances to this trend that deserve mention. For instance, not all short-range functional connections decrease in strength over age (Figure 5A and 5B and Figure S4A and S4B). While few, some of the short-range functional connections, typically those in the same network, increase in strength over age (Figure 5A and Figure S4A). Similarly, although many longrange functional connections increase in strength, many others do not statistically change across development (Figure 5C and,5D and Figure S4C and S4D, grey connections).
average path length of a graph. The clustering coefficient measures how well connected the neighbors of a node are to one another. The average path length measures the average minimum number of steps needed to go between any two nodes. Lattices, optimized for local processes, have high average clustering coefficients but long average path lengths. Conversely, random graphs, which have no preference for short-range connections, have low average clustering coefficients and short average path lengths, making them well suited for communication between distant nodes. One of Watts & Strogatz’s key insights was that by randomly rewiring a relatively small number of connections in a lattice graph (i.e., introducing a few long-range connections), a graph could retain its high average clustering coefficient, but dramatically reduce its average path length, thereby enabling efficient short- and long-range processes. It is this hybrid graph topology (i.e., high clustering coefficients and short path lengths) that matches the observed ‘‘small world’’ networks in many complex systems [47]. As previously reported [21,48,49], relative to comparable lattice and completely random graphs, the adult graph architecture showed high clustering coefficients and short path lengths, consistent with the ‘small world’ architecture (Figure 3B and 3C). Interestingly for these networks, in children (i.e., as early as age 8), these metrics were quite similar to adults (Figure 3B and 3C), and over age there was very little change in path lengths and
‘Small world’ network properties are present in both children and adults In a seminal 1998 paper, Watts and Strogatz noted that the topology of many complex systems can be described as ‘‘small world’’, a type of graph architecture that efficiently permits both local and distributed processing. Graphs with a regular, lattice-like structure have abundant short-range connections, but no longrange connections. Local interactions are thus efficient, but distributed processes involving distant nodes require the traversal of many intermediate connections. Conversely, completely randomly connected graphs are fairly efficient at transferring distant or long-range signals across a network, but they are poor at local, short-range information transfer. Watts and Strogatz, and others, often describe ‘‘small world’’ properties with two metrics: the average clustering coefficient and PLoS Computational Biology | www.ploscompbiol.org
6
May 2009 | Volume 5 | Issue 5 | e1000381
Brain Develops from Being ‘‘Local to Distributed’’
Figure 4. Despite high modularity in both children and adults, community assignments change over age. As in Figure 3, a modularity algorithm was applied to each matrix of the sliding boxcar across age (A) and with varying thresholds (B, C). Region legends are color coded by anatomy on the left and by adult functional network on the right (colors match Figure 2). (A) The left side of the box represents the community assignments for the youngest subjects (i.e., subjects 1–60), and the right side of the box represents the community assignments for the oldest subjects (i.e., subjects 151–210) - an age scale is presented at the top. As can be seen in the left of panel A, the modularity algorithm divided regions into communities arranged by anatomical proximity. Over age this organization transitions into modules arranged by adult functional properties. For this central panel a threshold of r$0.1 was used to denote connected versus non-connected region pairs. (B) Community assignments of the youngest boxcar (subjects 1–60), at thresholds ranging from 0 to 0.20. Regardless of threshold regions are largely organized by anatomical proximity in this youngest age group. (C) Community assignments of the oldest boxcar (subjects 151–210), at thresholds ranging from 0 to 0.20. Regardless of threshold regions are largely organized by adult function in this oldest group. doi:10.1371/journal.pcbi.1000381.g004
clustering coefficients relative to comparable random and lattice graphs. It was originally anticipated that path lengths would decrease over age as long-range anatomical connections were added. Yet even at the youngest ages examined, path length was already quite short, near those of random graphs. Importantly,
these results were not dependent on any particular threshold (Figure S5). We note that while the results shown here are largely descriptive, the error bars provided in Figure 3B and 3C constructed from random graphs underscores the difference between random configurations and the observed trends.
Figure 5. The ‘‘local to distributed’’ maturation is supported by a general decrease in functional connections between regions close in space, an increase in functional connection between regions distant in space, and the maintenance of several short and longrange connections that do not change with age. In this figure, functional connections are divided based on distance. Short-range functional connections are in (A,B), long-range functional connections (C,D) (y-axis, adult r-values; x-axis child r-values). Warm colors represent functional connections that are significantly greater in adults than children. Cool colors represent functional connections that are significantly greater in children than adults. Functional connections that do not significantly change with age are plotted in grey. As can be seen in (A,B), the majority of short-range functional connections that significantly change with age tend to decrease. The majority of long-range functional connections (C,D) that significantly change with age increase over time. However, many long and short-range functional connections do not significantly change over age (grey). In addition, while few, some long and short-range functional connections go against the general trend of short-range connections ‘‘growing down’’ and long-range functional connections ‘‘growing up.’’ See Figure S2 for an extended version of this figure, which includes a visualization of these functional connections on a semi-transparent brain. doi:10.1371/journal.pcbi.1000381.g005
PLoS Computational Biology | www.ploscompbiol.org
7
May 2009 | Volume 5 | Issue 5 | e1000381
Brain Develops from Being ‘‘Local to Distributed’’
to a distributed solution? Under the current proposal, it is not clear then why resting state functional connectivity would change so dramatically over the reported age range. One could argue that the general experiential environment and processing demands systematically change to encourage increasing use of long-range, distributed processing relationships. We believe, however, that at least part of the explanation lies in the interaction of these ‘‘environmental demands’’ with maturational changes of the neural substrate. By approximately 9 months of age the elaboration of most, if not all, short and long-range axonal connections between brain regions is thought to be complete [61]. However, synapse formation, the tuning of synaptic weights, synaptic pruning, and myelination all have unique developmental timecourses that extend further into development. For instance, from approximately 30 weeks gestation through the first two postnatal years there is substantial growth in the number of synaptic contacts throughout the cortex [62]. This growth is followed by a protracted period of synaptic pruning that reaches adult levels in the late second decade of life [63–65]. Importantly, pruning is selective, not random. Pruning is also largely activity dependent, and is considered critical in the differentiation of distinct functional areas [56,66,67]. Another commonly referenced postnatal event is myelination. As with synaptic pruning, myelination continues to occur through young adulthood. Increased myelination is thought to proceed from primary sensory and motor regions to association areas [68– 71], roughly following the hierarchical organization introduced by Felleman and Van Essen [72] (Note that while the most frequently referenced neuroanatomical changes that occur throughout development have been highlighted here, there are several others that deserve consideration [62,73–75]).
Discussion The combination of graph theoretic analyses and rs-fcMRI allowed for the examination of the dynamic relationships between multiple networks over development. In the current manuscript, we examined four networks - the cingulo-opercular, fronto-parietal, cerebellar, and default mode networks. As illustrated by qualitative observations in Figure 2 (and Video S1) and modularity analysis in Figure 4, locally organized groups of regions ‘‘segregate’’ over development into multiple distributed adult functional networks, while the functional networks themselves ‘‘integrate.’’ These results support the hypothesis that functional brain development proceeds from a ‘‘local’’ to ‘‘distributed’’ organization. However, despite the ‘‘local to distributed’’ developmental trend, ‘small world’ organizational properties are present in both 7–9 year old child and adult graph architecture. In the following section, these results are discussed considering two postulates: (1) the temporal pattern of spontaneous activity measured by rs-fcMRI represents a history of repeated coactivation between regions, and (2) the brain attempts to use the most efficient processing pathways available when faced with specific processing demands.
rs-fcMRI may reflect an interaction between the maturing neural substrate and the use of efficient pathways for general task completion As early as 1875 spontaneous synchronized neural activity has been used to study various aspects of adult brain organization [50– 53]. However, despite the passing of over 130 years since its initial use, there remains uncertainty as to the role of intrinsic spontaneous brain activity in brain function. In adults, spontaneous correlated activity has been suggested to be important for gating information flow [54], building internal representations [43,44,54], and maintaining mature network relationships [43,44,54]. Much less work has been done in regards to development, but there are suggestions that spontaneous activity is important for the establishment of early cortical patterns (e.g., ocular dominance columns) [55–58] and may over time represent (in a Hebbian sense) a history of repeated co-activation between regions [21,22,27,32,34,59,60]. Within this framework, the changes in the correlation structure of spontaneous activity over development seen in this report may provide insight regarding the arrangement by which brain regions are communicating in children compared to adults. If we consider the previously mentioned postulates, our results suggest that, typically, the most efficient way for children to respond to processing demands is to utilize more ‘‘local’’ level interactions as compared to adulthood. That is, in childhood there is, relatively greater co-activation of anatomically proximal regions than for adults with similar processing demands. A clear example of this is seen in Brown et al. [3], where identical task performance on lexical processing tests strongly activates a large set of visual regions in children, but strong visual activation is much more restricted in adults. These relationships may be reflected in correlated spontaneous activity measured via rs-fcMRI. The correlations in our youngest children would then represent the anatomical and spontaneous activity-defined initial regional relationships plus 7 years of experience-dependent Hebbian processes tuning these developing connections.
Changes in the neural substrate over development may lead to more efficient neural pathways for general task completion. Considering the continually changing nature of
the neural substrate over development, a context for changes in rsfcMRI can be created. For instance, as previously mentioned, increased signal propagation through the addition of a myelin sheath likely allows for more efficient communication between distant regions [22,32,34,76]. Such facilitated communication may promote interactions between brain regions that, previously, had substantially less efficient communication, allowing for a more effective ‘‘solution’’ to any particular set of processing demands. In addition, as new, more efficient, pathways become prominent, older inefficient connections likely decrease in use, leading to experience/activity-dependent decreases of specific area-area connection strengths. In other words, as myelination continues through development and allows for more effective long-distance neural pathways, repeated co-activation becomes more prevalent between many distant regions, and less so between many locally aligned regions, thus changing synaptic efficiencies. The statistical histories of such interactions, stored as relative synaptic weights, are then revealed via rs-fcMRI, and would lead to the ‘‘local to distributed’’ organization principle seen here. It is important to note, however, that improved communication between distant regions (via myelination) would not necessarily cause a wholesale decrease in connections that were originally organized locally. Many of these local connections likely continue to contribute to the most efficient ‘‘solution’’ for any particular task and remain in use. In fact, the change in dynamics may actually contribute to distinct local connections increasing with time. This possibility may underlie the increases in strength of specific shortrange connections seen in Figure 5 and Figure S2.
Changes in the neural substrate occur concurrently with changes in resting state functional connectivity. If the
correlations we find in children already represent 7 years of experience-driven tuning, why should additional experience lead PLoS Computational Biology | www.ploscompbiol.org
8
May 2009 | Volume 5 | Issue 5 | e1000381
Brain Develops from Being ‘‘Local to Distributed’’
Along the same lines, as Fuster [77] has pointed out, we note that myelination is not an indispensable property of utilized axons. Unmyelinated axonal connections are still quite capable of transmitting information. For this reason, the first 7 years of experience dependent statistical learning may indeed result in increases in long distance functional connections well before mature myelination is in place, an idea consistent with the short average path lengths found in even the youngest networks we examined (Figure 3). Thus, it is not surprising that some longdistant functional connections are present in children and do not statistically change with age (Figure 5 and Figure S2). We note that recent results in the aging literature suggest that many of the trajectories observed in the current manuscript continue inversely with advancing age [24,78]. That is, with aging, the functional organization, revealed via rs-fcMRI, becomes less distributed and more local. Thus the dynamic interactions we describe here likely continue as part of normal senescence [78].
already a significant number of long-range short cuts present. These long-range functional connections are likely responsible for the relatively short path lengths in the child group. We anticipate that if the developmental trajectory of short and long-range functional connections were extended to younger ages, fewer longrange ‘short-cut’ functional connections would be present, and more short-range functional connections would exist. Hence, the path lengths at these younger ages (,7 years old) would likely be longer. Nevertheless, by 8 years old, the networks already display ‘small world’ properties similar to those of adult networks, indicating that efficient graph structures are already in place for both local and distant processing, though they are organized differently than in later development. While we identified small world properties in both child and adult graphs, the size of the graph is relatively small with only 34 nodes. Therefore, it is possible that with an increased number of nodes the specific results identified here will change, a possibility that will be addressed in further studies.
The results presented here are consistent with other views of functional brain development
Need for generalization to other regions and modalities The regions used in the present analyses were all derived from adult imaging studies. It seems likely that additional regions may be included in one or more of these networks in childhood. In addition, individual differences with regards to the regions and networks chosen likely exist. Future work that includes regions derived from studies using a child population and obtaining the functional connections within subjects from individually defined functional areas may refine the networks and developmental timecourses presented here [84]. Of note, resting-state functional connectivity has been reported to be constrained by anatomical distance (i.e., correlations between regions decrease as a function of distance following an inverse square law) [85]. Thus, if a shift in this general bias occurred with development, then it is feasible that some of the changes seen here could be related to such a shift. With this said, the specificity of the connection changes observed over age, the number of connections that run opposite to the general trends, and the similarity of the distance relationship in connectivity between children and adults when plotting all possible connections (see Figure S6), all suggest that the majority of changes observed here are not related to changes in this bias. In addition, while there are now reports suggesting that changes observed over development with blood oxygen level dependent (BOLD) fMRI are not the product of changes in hemodynamic response mechanisms over age [86,87], differences in the hemodynamic response function between children and adults could conceivably affect our results [88]. A limitation of rs-fcMRI in general is the restricted frequency distribution that can be examined. rs-fcMRI is used to measure correlations in a very low frequency range, typically below 0.1 Hz. Dynamic changes in correlations in other frequency distributions could exist (for example see [89]). It is also possible that there are undetected developmental changes in power across frequency bands orthogonal to the changes visualized here. The combination of other imaging and psychometric techniques with rs-fcMRI will likely help address these considerations. Characterizing additional networks and how these changes map onto behavior will also help further characterize functional brain development. Specifically, future work that demonstrates a direct relationship between behavior and the developmental trajectory seen here with rsfcMRI, is presently needed to confirm (or reject) many of the theories presented here and elsewhere. Importantly, consideration of these issues need not be limited to developmental studies, but should be considered whenever investigators compare groups with rs-fcMRI.
The ‘‘local to distributed’’ organizing principle resonates with recent suggestions that perceptual and cognitive development involve the simultaneous segregation and integration of information processing streams [1,22,76,79,80]. For instance, the ‘‘interactive specialization’’ hypothesis advanced by Johnson and colleagues, is consistent with these findings [1,81–83]. Johnson points out that cortical regions and pathways have biased information processing properties at birth due to anatomic connectivity, yet they are much less selective than in adults (i.e., they are ‘‘broadly tuned’’). Interactive specialization predicts that shortly after birth, large sets of regions and pathways will be partially active during specific task conditions, However, as these pathways interact and compete with each other throughout development, selected regions will come online, be maintained, or become selectively activated or ‘‘tuned’’ as particular pathways dominate for specific task demands. Thus, regional specialization relies on the evolving and continuous interactions with other brain regions over development. If one extends this framework to the network level, the increases, decreases, and maintenance of correlation strengths seen between regions may reflect ‘‘specialization’’ of specific neural pathways to form the functional networks seen in adults.
Graph analysis suggests that small world properties are present in late childhood The ‘‘local to distributed’’ developmental trajectory, discussed above, seems to be driven by an abundance of local, short range connections that generally decrease in strength over age as well as distant, long range connections that generally increase in strength over age. Given the more prevalent short-range connections in children, we expected a more lattice-like structure, with high clustering coefficients and relatively high path lengths. The results, however, clearly indicated that path lengths were near those of equivalent random graphs, and that the child functional networks are already organized as small world networks. This result can be explained in the context of the re-wiring procedure discussed by Watts and Strogatz [47]. Randomly rewiring a small percentage of local connections in a lattice has a mild linear effect on clustering coefficients, but a highly non-linear effect on path lengths. This is to say, that by rewiring a small fraction of a lattice’s connections, substantial drops in path lengths can be seen, with almost no change in the clustering coefficient. In late childhood, as shown in Figure 5 and Figure S2, there are PLoS Computational Biology | www.ploscompbiol.org
9
May 2009 | Volume 5 | Issue 5 | e1000381
Brain Develops from Being ‘‘Local to Distributed’’
the correlation preprocessing. These pre-processing steps likely decrease or remove developmental changes in correlations driven by changes in respiration and heart rate over age.
Nonetheless, the general results presented here represent a strong set of hypotheses to be tested in broader domains and larger-scale brain graphs. First, that by age 8 years, regional relationships, as defined by rs-fcMRI, are organized as smallworld-like networks, which, relative to adults, emphasize local connections. Second, that for the same regions, adult networks show similar network metrics but with regional relationships that have a longer-range, more distributed structure reflecting adult functional histories. In other words, the modular structure of largescale brain networks will change with age, but even school age children will show relatively efficient processing architecture.
Extraction of resting state timeseries Resting state (fixation) data from 210 subjects (66 aged 7–9; 53 aged 10–15; 91 aged 19–31) were included in the analyses. For each subject at least 555 seconds (9.25 minutes) of resting state BOLD data were collected. 34 previously published regions comprising 4 functional networks (i.e., cingulo-opercular, frontoparietal, cerebellar, and default networks; see Table 1 and Figure 1) were used in this analysis [16,21,22,37]. For each region, a resting state timeseries was extracted separately for each individual. For 10 adult subjects, resting data was continuous. For the remaining 200 subjects, resting periods were extracted from between task periods in blocked or mixed blocked/event-related design studies [22]. These concatenated-extracted rest periods were shown to be equivalent to continuous resting data in a recent study describing this method [23]. In addition, several previous findings using this technique [21,22,32] have now been replicated using continuous resting blocks [27,33,34] and other continuous resting data [89].
Materials and Methods Subjects Subjects were recruited from Washington University and the local community. Participants were screened with a questionnaire to ensure that they had no history of neurological/psychiatric diagnoses or drug abuse. Informed consent was obtained from all subjects in accordance with the guidelines and approval of the Washington University Human Studies Committee.
Data acquisition and pre-processing
Generation of average group correlation matrices across development
fMRI data were acquired on a Siemens 1.5 Tesla MAGNETOM Vision system (Erlangen, Germany). Structural images were obtained using a sagittal magnetization-prepared rapid gradient echo (MP-RAGE) three-dimensional T1-weighted sequence (TE = 4 ms, TR = 9.7 ms, TI = 300 ms, flip angle = 12 deg, 128 slices with 1.256161 mm voxels). Functional images were obtained using an asymmetric spin echo echo-planar sequence sensitive to blood oxygen level-dependent (BOLD) contrast (volume TR = 2.5 sec, T2* evolution time = 50 ms, a = 90u, inplane resolution 3.7563.75 mm). Whole brain coverage was obtained with 16 contiguous interleaved 8 mm axial slices acquired parallel to the plane transecting the anterior and posterior commissure (AC-PC plane). Steady state magnetization was assumed after 4 frames (,10 s). Functional images were first processed to reduce artifacts [23,90]. These steps included: (i) removal of a central spike caused by MR signal offset, (ii) correction of odd vs. even slice intensity differences attributable to interleaved acquisition without gaps, (iii) correction for head movement within and across runs and (iv) within run intensity normalization to a whole brain mode value of 1000. Atlas transformation of the functional data was computed for each individual via the MP-RAGE scan. Each run then was resampled in atlas space (Talairach and Tournoux, 1988) on an isotropic 3 mm grid combining movement correction and atlas transformation in one interpolation [91,92]. All subsequent operations were performed on the atlas-transformed volumetric timeseries.
To examine the functional connections within and between the large set of regions used in this manuscript we chose to use graph theory. Graph theory is particularly well suited to study large-scale systems organization across development, but requires the data be organized into specific correlation matrices. To do this, for each of the 210 subjects, the resting state BOLD timeseries from each region was correlated with the timeseries from every other region, creating 210 square correlation matrices (34634). Average group matrices were then created using a sliding boxcar grouping of subjects in age-order (i.e., group1: subjects 1–60, group2: subjects 2–61, group3: subjects 3–62, … group151: subjects 151–210), thus generating a series of groups with average ages ranging from 8.48 years old to 25.48 years old with each group composed of 60 subjects. Average correlation coefficients (r) for each group were generated from the subjects’ individual matrices using the Schmidt-Hunter method for meta-analyses of r-values [21,85,93]. In cases when the terms ‘‘child’’ or ‘‘adult’’ are used, the matrices or results referred to are the first and last of the sliding boxcar groups respectively, i.e., the child group is the youngest 60 subjects, with an average age of 8.48 years old, and the adult group is the oldest 60 subjects, with an average age of 25.48 years old.
Spring-embedded graph theoretic layout and visualization To generate a dynamic representation of the functional connections between regions across development, each of the groups’ correlation matrices was converted into a thresholded graph, such that correlations higher than r$0.1 were considered connections, while correlations lower than the threshold were not connections. For our initial analyses [21,22,32] graphs in child and adult groups were presented in either a pseudo-anatomical fashion or in their actual 3D positions (in Talairach space). Here we add another representation often used in graph theory - spring embedding. In this procedure, a spring constant is added to all of the connections in the network allowing for the pairwise regional connections to relax to their lowest energetic state. The algorithm applied in the present analysis is known as Kamada-
rs-fcMRI pre-processing For rs-fcMRI analyses as previously described [16,23], several additional preprocessing steps were used to reduce spurious variance unlikely to reflect neuronal activity (e.g., heart rate and respiration). These steps included: (1) a temporal band-pass filter (0.009 Hz,f,0.08 Hz) and spatial smoothing (6 mm full width at half maximum), (2) regression of six parameters obtained by rigid body head motion correction, (3) regression of the whole brain signal averaged over the whole brain, (4) regression of ventricular signal averaged from ventricular regions of interest (ROIs), and (5) regression of white matter signal averaged from white matter ROIs. Regression of first order derivative terms for the whole brain, ventricular, and white matter signals were also included in PLoS Computational Biology | www.ploscompbiol.org
10
May 2009 | Volume 5 | Issue 5 | e1000381
Brain Develops from Being ‘‘Local to Distributed’’
robustness of the community assignments was also tested using a different information theoretic procedure implemented by Meila, [95], which utilizes the measure ‘variation of information (VOI)’ (see Figure S7 and also [96]). All calculations were performed in MATLAB (The Mathworks, Inc., Natick, MA).
Kawai [45] - one of the most commonly used strategies for displaying graph network data. In brief, each functional connection between a pair of nodes is treated as a spring with a spring constant related to the strength of the specific correlation. The nodes are then randomly placed in a plane, which places high strain on the ‘‘spring-loaded’’ connections. The algorithm then iteratively adjusts the positions of each node to reduce the total energy of the system to a minimum. As the pair-wise connections relax to their lowest energetic states the ‘‘natural’’ configuration of the network is revealed. By observing multiple ‘‘spring embedded’’ graphs across the subjects in age-order, approximately representing a 6 month temporal sliding box car (i.e., group1: subjects 1–60, group2: subjects 2–61, etc.), a movie representation can be made that shows the development of the full system (see Video S1). The interpolations, algorithm application, and movie production were performed using MATLAB (The Mathworks, Natick, MA) and SoNIA (Social Network Image Animator) [94].
Characterization of connection length versus the change in correlation strength over development To characterize the relationship between connection length and the change in correlation strength over development, we split all 561 possible connections into 4 groups based on vector distance. Since using vector distance as an approximate for connectional distance is much more inconsistent when comparing ROIs across the midline, only intrahemispheric connections or connections to midline structures (i.e., within 5 mm of the midline) were examined. These connections were then sorted by connection length and plotted on a graph where the x-axis corresponds to the child correlation strengths and the y-axis corresponds to the adult correlation strengths (Figure 5 and Figure S2). On both the graphs (Figure 5) and the cortical surfaces (Figure S2), the color of the lines denotes the strength of correlation. Significant differences seen in Figure 5 and Figure S2 were obtained via direct comparison between children (the youngest 60 children out of 210 total subjects; age 7.01–9.67; average age 8.48) and adults (the oldest 60 adults out of 210 total subjects; age 22.47–31.39; average age 25.48). Two-sample two-tailed t-tests (assuming unequal variance; p#0.05) were performed on all potential connections that passed the above criteria. Fischer z transformation was applied to the correlation coefficients to improve normality for the random effects analysis. To account for multiple comparisons the Benjamini and Hochberg False Discovery Rate [97] was applied. Connections that were significantly different between groups, but r,0.1 in both groups, were not displayed.
Modularity analysis Communities for our graph were detected with the modularity optimization method of Newman [46]. The modularity, or Q, of a graph is a quantitative measure of the number of edges found within communities versus the number predicted in a random graph with equivalent degree distribution. A positive Q indicates that the number of intra-community edges exceeds those predicted statistically. A wide range of Q may be found for a graph, depending on how nodes are assigned to communities. The set of node assignments that returns the highest Q is the optimal community structure sought by the modularity optimization algorithm, which follows a recursive two-step process. First, a modularity matrix similar to a Laplacian is constructed from the nodes in question, comparing observed versus expected edges. If this matrix has a positive eigenvalue, the eigenvector of the largest eigenvalue is used to split the nodes into two subgraphs, and Q is calculated. Second, nodes are swapped individually between the two subgraphs to see if an increase in Q can be found. Once a maximal Q is found from these swaps, the process is repeated on the subgraphs. At any point in this process, if the matrix has no positive eigenvalues, or if a proposed split does not increase Q, the subgraph is set aside, and defines a community. To detect communities in our networks over a range of ages, we used the sliding boxcar group average correlation matrices described above in ‘‘Generation of average group correlation matrices across development.’’ With weights retained, the modularity optimization algorithm was applied to each matrix along the sliding boxcar. A range of thresholds was explored to define connections for these calculations (see Figure 4 and Figure S1). Any particular threshold did not change the conclusions presented in the main manuscript. A threshold of 0.10 was chosen to display in the main manuscript because it balances two principles: (1) eliminating a multitude of weak correlations, which may obscure more physiologically relevant correlations, and (2) retaining high graph connectedness, so that communities arise from partitioning and not thresholding. Graph connectedness captures the extent of nodes fragmented from the main graph due to increasing thresholds. It is defined for a graph of N nodes as the mean of an NxN matrix, where cell i,j is 1 if a path exists between node i and node j (self-connections are allowed), and is 0 otherwise. A graph in which all nodes can reach each other has 100% graph connectedness, whereas a fragmented network in which some nodes cannot reach the rest has a lower connectedness. The modularity optimization analysis returned a set of community assignments for the nodes, as well as the Q of the graph with those assignments. The group assignments for the nodes were converted to colors and are displayed in Figure 4. The PLoS Computational Biology | www.ploscompbiol.org
‘Small world’ characterization The small-world metrics were calculated according to descriptions by Watts and Strogatz [47]. In the main manuscript, calculations were performed on the group average correlation matrices thresholded at 0.10 and converted to binary matrices (for analysis across varying thresholds see Figure S3). For each matrix across age, the average clustering coefficient and average path lengths were compared to those values in lattices with equivalent N (number of nodes) and K (number of connections). To ensure that our matrices also differed from random graphs, 100 random graphs with equivalent degree distributions were also created. From these graphs mean average path lengths and clustering coefficients were calculated. These metrics are presented in Figure 3 and Figure S3. All calculations were performed in MATLAB (The Mathworks, Natick, MA).
Supporting Information Figure S1 Modularity remains relatively high across age and
does not differ between children and adults across differing thresholds. Blue dots represent modularity and red dots represent graph connectedness. A graph in which there is a path between all nodes represents 100% graph connectedness, whereas a fragmented network in which some nodes cannot reach the rest has a lower graph connectedness (see Materials and Methods for details). (A) Modularity across age as presented in Figure 3 of the main manuscript. (B) Modularity across thresholds for children. (C) Modularity across thresholds for adults. Found at: doi:10.1371/journal.pcbi.1000381.s001 (0.50 MB TIF) 11
May 2009 | Volume 5 | Issue 5 | e1000381
Brain Develops from Being ‘‘Local to Distributed’’
Scatterplot of modularity as a function of age. Each point in the graph represents the modularity calculated for each individual subject. A threshold of r$0.1 was applied to each subject’s matrices before calculations were performed and denotes connected versus non-connected region pairs (see Materials and Methods). Found at: doi:10.1371/journal.pcbi.1000381.s002 (0.35 MB TIF)
Figure S2
means, which are plotted as error bars. (A) VOI over a range of alpha in the youngest boxcar and equivalent random graphs. (B) VOI over a range of alpha in the oldest boxcar and equivalent random graphs. Compared to random graphs the community assignments in both children and adults are significantly robust. Found at: doi:10.1371/journal.pcbi.1000381.s007 (0.43 MB TIF) Video S1 Over age, the graph architecture matures from a ‘‘local’’ organization to a ‘‘distributed’’ organization. This movie shows the dynamic development and interaction of positive correlations between the two task control networks, the default network, and cerebellar network using spring embedding. The figure highlights the segregation of local, anatomically clustered regions and the integration of functional networks over development. This is the full movie that Figure 3 is based on in the main text. Nodes are color coded by there adult network profile (core of the nodes) and also by there anatomical location (node outlines). Black - cingulo-opercular network; Yellow - fronto-parietal network; Red - default network; Blue - cerebellar; Light blue frontal cortex; Grey - parietal cortex; Green - temporal cortex, Pink - cerebellum, Light pink - thalamus. At the beginning of the movie (i.e. in children) regions are largely organized by their anatomical location, but over age anatomically clustered regions segregate. The cluster of frontal regions (light blue outlines) best demonstrates this segregation. In addition, at the beginning of the movie (i.e., in children) the more distributed adult functional networks (core colors of nodes) are in many ways disconnected; however, over development the functional networks integrate. The isolated regions of the default network in childhood (Red) that coalesce into a highly correlated network best illustrate this integration. Over age node organization shifts from the ‘‘local’’ arrangement in children to the ‘‘distributed’’ organization commonly observed in adults. Found at: doi:10.1371/journal.pcbi.1000381.s008 (9.68 MB MP4)
Figure S3 Reducing the boxcar size does not substantially alter
community assignments over age. The same procedure as presented in Figure 4 with the boxcar reduced to (A) 40 subjects and (B) 20 subjects. Found at: doi:10.1371/journal.pcbi.1000381.s003 (4.65 MB TIF) Figure S4 An extended version of Figure 5, which includes a visualization of these connections represented on a semitransparent brain. Found at: doi:10.1371/journal.pcbi.1000381.s004 (4.69 MB TIF) Figure S5 Clustering coefficients and path lengths do not differ between children and adults across differing thresholds with respect to comparable lattice and random graphs. For children all parameters across thresholds were calculated from the first 60 subjects in age order (i.e., subjects 1–60, average age 8.48). For adults, all parameters across thresholds were calculated from the last 60 subjects in age order (i.e., subjects 151–210, average age 25.48. (A) Clustering Coefficients across thresholds for children compared to equivalent lattice and random networks. (B) Path lengths across thresholds for children compared to equivalent lattice and random graphs. (C) Clustering Coefficients across thresholds for adults compared to equivalent lattice and random graphs. (D) Path lengths across thresholds for adults compared to equivalent lattice and random graphs. At all thresholds examined, both children and adults show relatively high clustering coefficients and low path lengths, consistent with ‘small world’ topology. Found at: doi:10.1371/journal.pcbi.1000381.s005 (0.59 MB TIF) Figure S6 Connection strength as a function of distance for all possible connections is similar between children and adults. The relationship of correlation as a function of distance is described by the inverse square law, r,1/D2, as reported in [85] for all possible connections in children (blue) and adults (red). Found at: doi:10.1371/journal.pcbi.1000381.s006 (0.71 MB TIF)
Video S2 Reducing the boxcar size to 40 subjects does not change qualitative patterns observed with the 60 subject boxcar. The same procedure as presented in Figure 3 and Video S1 is presented here with the boxcar reduced to 40 subjects. Found at: doi:10.1371/journal.pcbi.1000381.s009 (9.62 MB MPG)
Figure S7 Variation of information (VOI) in observed and equivalent random networks subjected to perturbation alpha. VOI is a measure of how much information is not shared between two sets of community assignments and allows for the quantification of network robustness (see [95] and [96]). Values of 0 indicate identical community assignments, and values of 1 indicate maximally different community assignments. To assess the stability of community assignments, the edges of a network are randomized with probability alpha to perturb the network, and the VOI between the original and perturbed networks are calculated over a range of alpha. An equivalent random network was generated for comparison. The entire perturbation process was repeated 50 times to obtain mean VOI values and standard errors of the
Acknowledgments We thank Marcus Raichle, Steven M. Nelson, Alecia C. Vogel, and Adriana Hernandez for technical assistance and helpful discussions, and Mark McAvoy and Abraham Z. Snyder for help with data analysis.
Author Contributions Conceived and designed the experiments: DAF ALC BLS SEP. Performed the experiments: DAF ALC JDP. Analyzed the data: DAF ALC JDP. Contributed reagents/materials/analysis tools: DAF ALC JDP NUFD JAC FMM BLS SEP. Wrote the paper: DAF ALC JDP BLS SEP.
References 5. Luna B, Thulborn KR, Munoz DP, Merriam EP, Garver KE, et al. (2001) Maturation of widely distributed brain function subserves cognitive development. Neuroimage 13: 786–793. 6. Fair DA, Brown TT, Petersen SE, Schlaggar BL (2006) A comparison of analysis of variance and correlation methods for investigating cognitive development with fMRI. Dev Neuropsychol 30: 531–546. 7. Schlaggar BL, Brown TT, Lugar HM, Visscher KM, Miezin FM, et al. (2002) Functional neuroanatomical differences between adults and school-age children in the processing of single words. Science 296: 1476–1479.
1. Johnson MH (2001) Functional brain development in humans. Nat Rev Neurosci 2: 475–483. 2. Moses P, Roe K, Buxton RB, Wong EC, Frank LR, et al. (2002) Functional MRI of global and local processing in children. Neuroimage 16: 415–424. 3. Brown TT, Lugar HM, Coalson RS, Miezin FM, Petersen SE, et al. (2005) Developmental changes in human cerebral functional organization for word generation. Cereb Cortex 15: 275–290. 4. Casey BJ, Galvan A, Hare TA (2005) Changes in cerebral functional organization during cognitive development. Curr Opin Neurobiol 15: 239–244.
PLoS Computational Biology | www.ploscompbiol.org
12
May 2009 | Volume 5 | Issue 5 | e1000381
Brain Develops from Being ‘‘Local to Distributed’’
37. Dosenbach NU, Fair DA, Cohen AL, Schlaggar BL, Petersen SE (2008) A dualnetworks architecture of top-down control. Trends Cogn Sci 12: 99–105. 38. Shulman GL, Fiez JA, Corbetta M, Buckner RL, Miezin FM, et al. (1997) Common blood flow changes across visual tasks: II. Decreases in cerebral cortex. J Cogn Neurosci 9: 648–663. 39. Raichle ME, MacLeod AM, Snyder AZ, Powers WJ, Gusnard DA, et al. (2001) A default mode of brain function. Proc Natl Acad Sci U S A 98: 676–682. 40. Fransson P (2005) Spontaneous low-frequency BOLD signal fluctuations: an fMRI investigation of the resting-state default mode of brain function hypothesis. Hum Brain Mapp 26: 15–29. 41. Mason MF, Norton MI, Van Horn JD, Wegner DM, Grafton ST, et al. (2007) Wandering minds: the default network and stimulus-independent thought. Science 315: 393–395. 42. Gilbert SJ, Dumontheil I, Simons JS, Frith CD, Burgess PW (2007) Comment on ‘‘Wandering minds: the default network and stimulus-independent thought’’. Science 317: 43; author reply 43. 43. Raichle ME, Snyder AZ (2007) A default mode of brain function: a brief history of an evolving idea. Neuroimage 37: 1083–1090. 44. Buckner RL, Vincent JL (2007) Unrest at rest: default activity and spontaneous network correlations. Neuroimage 37: 1091–1096. 45. Kamada K, Kawai S (1989) An algorithm for drawing general undirected graphs. Inf Process Lett 31: 7–15. 46. Newman ME (2006) Modularity and community structure in networks. Proc Natl Acad Sci U S A 103: 8577–8582. 47. Watts DJ, Strogatz SH (1998) Collective dynamics of ‘small-world’ networks. Nature 393: 440–442. 48. Sporns O, Zwi JD (2004) The small world of the cerebral cortex. Neuroinformatics 2: 145–162. 49. Sporns O, Honey CJ (2006) Small worlds inside big brains. Proc Natl Acad Sci U S A 103: 19219–19220. 50. Berger H (1929) Uber das electrenkephalogramm des menschen. Arch Psychiatr Nervenkr 87: 527–570. 51. Berger H (1933) Uber das electrenkephalogramm des menschen. Arch Psychiatr NervenkrBr 100: 301–320. 52. Caton R (1875) The electric currents of the brain. Br Med J 2: 278. 53. Swartz BE, Goldensohn ES (1998) Timeline of the history of EEG and associated fields. Electroencephalogr Clin Neurophysiol 106: 173–176. 54. Varela F, Lachaux J-P, Rodriguez E, Martinerie J (2001) The brainweb: phase synchronization and large-scale integration. Nat Rev Neurosci 2: 229–239. 55. Katz LC, Crowley JC (2002) Development of cortical circuits: lessons from ocular dominance columns. Nat Rev Neurosci 3: 34–42. 56. Luo L, O’Leary DD (2005) Axon retraction and degeneration in development and disease. Annu Rev Neurosci 28: 127–156. 57. Price DJ, Kennedy H, Dehay C, Zhou L, Mercier M, et al. (2006) The development of cortical connections. Eur J Neurosci 23: 910–920. 58. Sur M, Leamey CA (2001) Development and plasticity of cortical areas and networks. Nat Rev Neurosci 2: 251–262. 59. Miltner WH, Braun C, Arnold M, Witte H, Taub E (1999) Coherence of gamma-band EEG activity as a basis for associative learning. Nature 397: 434–436. 60. Bi G, Poo M (1999) Distributed synaptic modification in neural networks induced by patterned stimulation. Nature 401: 792–796. 61. Conel JL (1939–1963) The Postnatal Development of the Human Cerebral Cortex. Cambridge, MA: Harvard University Press. 62. Levitt P (2003) Structural and functional maturation of the developing primate brain. J Pediatr 143: S35–S45. 63. Huttenlocher PR (1979) Synaptic density in human frontal cortex developmental changes and effects of aging. Brain Res 163: 195–205. 64. Huttenlocher PR, Dabholkar AS (1997) Regional differences in synaptogenesis in human cerebral cortex. J Comp Neurol 387: 167–178. 65. Huttenlocher PR, de Courten C, Garey LJ, Van der Loos H (1982) Synaptogenesis in human visual cortex—evidence for synapse elimination during normal development. Neurosci Lett 33: 247–252. 66. Ebbesson SO (1980) The parcellation theory and its relation to interspecific variability in brain organization, evolutionary and ontogenetic development, and neuronal plasticity. Cell Tissue Res 213: 179–212. 67. Greenough WT, Black JE, Wallace CS (1987) Experience and brain development. Child Dev 58: 539–559. 68. Brody BA, Kinney HC, Kloman AS, Gilles FH (1987) Sequence of central nervous system myelination in human infancy. I. An autopsy study of myelination. J Neuropathol Exp Neurol 46: 283–301. 69. Flechsig PE Anatomie des Menschlichen Gehirn und Ruckenmarks, auf Myelogenetischer Grundlage, Thieme G, editor. 70. Paus T, Collins DL, Evans AC, Leonard G, Pike B, et al. (2001) Maturation of white matter in the human brain: a review of magnetic resonance studies. Brain Res Bull 54: 255–266. 71. Sowell ER, Trauner DA, Gamst A, Jernigan TL (2002) Development of cortical and subcortical brain structures in childhood and adolescence: a structural MRI study. Dev Med Child Neurol 44: 4–16. 72. Felleman DJ, Van Essen DC (1991) Distributed hierarchical processing in the primate cerebral cortex. Cereb Cortex 1: 1–47. 73. Fair DA, Schlaggar BL (2008) Brain Development. In: Haith MM, Benson JB, eds (2008) Encyclopedia of Brain Development. San Diego, CA: Academic Press.
8. Durston S, Davidson MC, Tottenham N, Galvan A, Spicer J, et al. (2006) A shift from diffuse to focal cortical activity with development. Dev Sci 9: 1–8. 9. Crone EA, Wendelken C, Donohue S, van Leijenhorst L, Bunge SA (2006) Neurocognitive development of the ability to manipulate information in working memory. Proc Natl Acad Sci U S A 103: 9315–9320. 10. Gaillard WD, Hertz-Pannier L, Mott SH, Barnett AS, LeBihan D, et al. (2000) Functional anatomy of cognitive development: fMRI of verbal fluency in children and adults. Neurology 54: 180–185. 11. Biswal B, Yetkin FZ, Haughton VM, Hyde JS (1995) Functional connectivity in the motor cortex of resting human brain using echo-planar MRI. Magn Reson Med 34: 537–541. 12. Nir Y, Hasson U, Levy I, Yeshurun Y, Malach R (2006) Widespread functional connectivity and fMRI fluctuations in human visual cortex in the absence of visual stimulation. Neuroimage 30: 1313–1324. 13. Leopold DA, Murayama Y, Logothetis NK (2003) Very slow activity fluctuations in monkey visual cortex: implications for functional brain imaging. Cereb Cortex 13: 422–433. 14. Lowe MJ, Mock BJ, Sorenson JA (1998) Functional connectivity in single and multislice echoplanar imaging using resting-state fluctuations. Neuroimage 7: 119–132. 15. Greicius MD, Krasnow B, Reiss AL, Menon V (2003) Functional connectivity in the resting brain: a network analysis of the default mode hypothesis. Proc Natl Acad Sci U S A 100: 253–258. 16. Fox MD, Snyder AZ, Vincent JL, Corbetta M, Van Essen DC, et al. (2005) The human brain is intrinsically organized into dynamic, anticorrelated functional networks. Proc Natl Acad Sci U S A 102: 9673–9678. 17. Beckmann CF, DeLuca M, Devlin JT, Smith SM (2005) Investigations into resting-state connectivity using independent component analysis. Philos Trans R Soc Lond B Biol Sci 360: 1001–1013. 18. Salvador R, Suckling J, Schwarzbauer C, Bullmore E (2005) Undirected graphs of frequency-dependent functional connectivity in whole brain networks. Philos Trans R Soc Lond B Biol Sci 360: 937–946. 19. Achard S, Salvador R, Whitcher B, Suckling J, Bullmore E (2006) A resilient, low-frequency, small-world human brain functional network with highly connected association cortical hubs. J Neurosci 26: 63–72. 20. Damoiseaux JS, Rombouts SA, Barkhof F, Scheltens P, Stam CJ, et al. (2006) Consistent resting-state networks across healthy subjects. Proc Natl Acad Sci U S A 103: 13848–13853. 21. Dosenbach NU, Fair DA, Miezin FM, Cohen AL, Wenger KK, et al. (2007) Distinct brain networks for adaptive and stable task control in humans. Proc Natl Acad Sci U S A 104: 11073–11078. 22. Fair DA, Dosenbach NUF, Church JA, Cohen AL, Brahmbhatt S, et al. (2007) Development of distinct control networks through segregation and integration. Proc Natl Acad Sci U S A 104: 13507–13512. 23. Fair DA, Schlaggar BL, Cohen AL, Miezin FM, Dosenbach NU, et al. (2007) A method for using blocked and event-related fMRI data to study ‘‘resting state’’ functional connectivity. Neuroimage 35: 396–405. 24. Andrews-Hanna JR, Snyder AZ, Vincent JL, Lustig C, Head D, et al. (2007) Disruption of large-scale brain systems in advanced aging. Neuron 56: 924–935. 25. Hampson M, Driesen NR, Skudlarski P, Gore JC, Constable RT (2006) Brain connectivity related to working memory performance. J Neurosci 26: 13338–13343. 26. Fox MD, Corbetta M, Snyder AZ, Vincent JL, Raichle ME (2006) Spontaneous neuronal activity distinguishes human dorsal and ventral attention systems. Proc Natl Acad Sci U S A 103: 10046–10051. 27. Seeley WW, Menon V, Schatzberg AF, Keller J, Glover GH, et al. (2007) Dissociable intrinsic connectivity networks for salience processing and executive control. J Neurosci 27: 2349–2356. 28. Church JA, Fair DA, Dosenbach NUF, Cohen AL, Miezin FM, et al. (2009) Control networks in pediatric Tourette Syndrome show immature and anomalous patterns of functional connectivity. Brain 132: 225–238. 29. Greicius MD, Srivastava G, Reiss AL, Menon V (2004) Default-mode network activity distinguishes Alzheimer’s disease from healthy aging: evidence from functional MRI. Proc Natl Acad Sci U S A 101: 4637–4642. 30. Castellanos FX, Margulies DS, Kelly AMC, Uddin LQ, Ghaffari M, et al. (2008) Cingulate-precuneus interactions: a new locus of dysfunction in adult attentiondeficit/hyperactivity disorder. Biol Psychiatry 63: 332–337. 31. Just MA, Cherkassky VL, Keller TA, Kana RK, Minshew NJ (2007) Functional and anatomical cortical underconnectivity in autism: evidence from an FMRI study of an executive function task and corpus callosum morphometry. Cereb Cortex 17: 951–961. 32. Fair DA, Cohen AL, Dosenbach NU, Church JA, Miezin FM, et al. (2008) The maturing architecture of the brain’s default network. Proc Natl Acad Sci U S A 105: 4028–4032. 33. Fransson P, Skiold B, Horsch S, Nordell A, Blennow M, et al. (2007) Restingstate networks in the infant brain. Proc Natl Acad Sci U S A 104: 15531–15536. 34. Kelly AM, Di Martino A, Uddin LQ, Shehzad Z, Gee DG, et al. (2008) Development of anterior cingulate functional connectivity from late childhood to early adulthood. Cereb Cortex 19: 640–657. 35. Lin W, Zhu Q, Gao W, Chen Y, Toh CH, et al. (2008) Functional connectivity MR imaging reveals cortical functional connectivity in the developing brain. AJNR Am J Neuroradiol 29: 1883–1889. 36. Dosenbach NU, Visscher KM, Palmer ED, Miezin FM, Wenger KK, et al. (2006) A core system for the implementation of task sets. Neuron 50: 799–812.
PLoS Computational Biology | www.ploscompbiol.org
13
May 2009 | Volume 5 | Issue 5 | e1000381
Brain Develops from Being ‘‘Local to Distributed’’
74. Cowan WM, Fawcett J, O’Leary DDM, Stanfield BB (1984) Regressive events in neurogenesis. Science 225: 1258–1265. 75. Lidow MS, Goldman-Rakic PS, Rakic P (1991) Synchronized overproduction of neurotransmitter receptors in diverse regions of the primate cerebral cortex. Proc Natl Acad Sci U S A 88: 10218–10221. 76. Luna B, Sweeney JA (2004) The emergence of collaborative brain function: FMRI studies of the development of response inhibition. Ann N Y Acad Sci 1021: 296–309. 77. Fuster JM (2003) Cortex and Mind: Unifying Cognition. Oxford University Press. 78. Meunier D, Achard S, Morcom A, Bullmore E (2009) Age-related changes in modular organization of human brain functional networks. Neuroimage 44: 715–723. 79. Fair DA, Brown TT, Petersen SE, Schlaggar BL (2006) fMRI reveals novel functional neuroanatomy in a child with perinatal stroke. Neurology 67: 2246–2249. 80. Bunge SA, Wright SB (2007) Neurodevelopmental changes in working memory and cognitive control. Curr Opin Neurobiol 17: 243–250. 81. Johnson MH (2000) Functional brain development in infants: elements of an interactive specialization framework. Child Dev 71: 75–81. 82. Johnson MH (2000) Cortical specialization for higher cognitive functions: beyond the maturational model. Brain Cogn 42: 124–127. 83. Johnson MH, Munakata Y (2005) Processes of change in brain and cognitive development. Trends Cogn Sci 9: 152–158. 84. Cohen AL, Fair DA, Dosenbach NU, Miezin FM, Dierker D, et al. (2008) Defining functional areas in individual human brains using resting functional connectivity MRI. Neuroimage 41: 45–57. 85. Salvador R, Suckling J, Coleman MR, Pickard JD, Menon D, et al. (2005) Neurophysiological architecture of functional magnetic resonance images of human brain. Cereb Cortex 15: 1332–1342. 86. Kang HC, Burgund ED, Lugar HM, Petersen SE, Schlaggar BL (2003) Comparison of functional activation foci in children and adults using a common stereotactic space. Neuroimage 19: 16–28.
PLoS Computational Biology | www.ploscompbiol.org
87. Wenger KK, Visscher KM, Miezin FM, Petersen SE, Schlaggar BL (2004) Comparison of sustained and transient activity in children and adults using a mixed blocked/event-related fMRI design. Neuroimage 22: 975–985. 88. D’Esposito M, Deouell LY, Gazzaley A (2003) Alterations in the BOLD fMRI signal with ageing and disease: a challenge for neuroimaging. Nat Rev Neurosci 4: 863–872. 89. Srinivasan R (1999) Spatial structure of the human alpha rhythm: global correlation in adults and local correlation in children. Clin Neurophysiol 110: 1351–1362. 90. Miezin F, Maccotta L, Ollinger J, Petersen S, Buckner R (2000) Characterizing the hemodynamic response: effects of presentation rate, sampling procedure, and the possibility of ordering brain activity based on relative timing. Neuroimage 11: 735–759. 91. Lancaster JL, Glass TG, Lankipalli BR, Downs H, Mayberg H, et al. (1995) A modality-independent approach to spatial normalization of tomographic images of the human brain. Hum Brain Mapp 3: 209–223. 92. Snyder AZ (1996) Difference image vs. ratio image error function forms in PETPET realignment. In: Myer R, Cunningham VJ, Bailey DL, Jones T, eds (1996) Quantification of Brain Function Using PET. San Diego, CA: Academic Press. pp 131–137. 93. Field AP (2001) Meta-analysis of correlation coefficients: a Monte Carlo comparison of fixed- and random-effects methods. Psychol Methods 6: 161–180. 94. Bender-deMoll S, McFarland DA (2006) The art and science of dynamic network visualization. JJ Soc Struct 7: 2. 95. Meila M (2007) Comparing clusterings - an information based distance. J Multivar Anal 98: 873–895. 96. Karrer B, Levina E, Newman ME (2008) Robustness of community structure in networks. Phys Rev E Stat Nonlin Soft Matter Phys 77: 046119. 97. Benjamini Y, Hochberg Y (1995) Controlling the false discovery rate: a practical and powerful approach to multiple testing. J R Stat Soc B 57: 289–300.
14
May 2009 | Volume 5 | Issue 5 | e1000381