Psychological Medicine, Page 1 of 13. doi:10.1017/S0033291715001397
OR I G I N A L A R T I C L E
© Cambridge University Press 2015
Functional connectivity for face processing in individuals with body dysmorphic disorder and anorexia nervosa T. D. Moody1*, M. A. Sasaki1, C. Bohon2, M. A. Strober1, S. Y. Bookheimer1, C. L. Sheen1 and J. D. Feusner1 1 2
Psychiatry and Biobehavioral Sciences, UCLA, Los Angeles, CA, USA Psychiatry and Biobehavioral Sciences, Stanford University School of Medicine, Stanford, CA, USA
Background. Body dysmorphic disorder (BDD) and anorexia nervosa (AN) are both characterized by distorted perception of appearance. Previous studies in BDD suggest abnormalities in visual processing of own and others’ faces, but no study has examined visual processing of faces in AN, nor directly compared the two disorders in this respect. Method. We collected functional magnetic resonance imaging data on 60 individuals of equivalent age and gender in each of three groups – 20 BDD, 20 weight-restored AN, and 20 healthy controls (HC) – while they viewed images of others’ faces that contained only high or low spatial frequency information (HSF or LSF). We tested hypotheses about functional connectivity within specialized sub-networks for HSF and LSF visual processing, using psychophysiological interaction analyses. Results. The BDD group demonstrated increased functional connectivity compared to HC between left anterior occipital face area and right fusiform face area (FFA) for LSF faces, which was associated with symptom severity. Both BDD and AN groups had increased connectivity compared to HC between FFA and precuneous/posterior cingulate gyrus for LSF faces, and decreased connectivity between FFA and insula. In addition, we found that LSF connectivity between FFA and posterior cingulate gyrus was significantly associated with thoughts about own appearance in AN. Conclusions. Results suggest similar abnormal functional connectivity within higher-order systems for face processing in BDD and AN, but distinct abnormal connectivity patterns within occipito-temporal visual networks. Findings may have implications for understanding relationships between these disorders, and the pathophysiology underlying perceptual distortions. Received 10 January 2015; Revised 25 June 2015; Accepted 25 June 2015 Key words: Anorexia nervosa, body dysmorphic disorder, functional connectivity, psychophysiological interaction.
Introduction Body dysmorphic disorder (BDD) is a psychiatric disorder in which individuals are preoccupied with misperceived defects in their physical appearance, often involving facial features. Like those with BDD, individuals with anorexia nervosa (AN) experience distorted perceptions of appearance, but they mainly stem from the conviction of being overweight despite extreme thinness. AN and BDD share a peak age of onset during adolescence, and have similar diagnostic comorbidities (Phillips & Kaye, 2007; Swinbourne & Touyz, 2007; Kollei et al. 2012). AN and BDD often cooccur – upwards of 32% of patients with BDD report a lifetime eating disorder (Ruffolo et al. 2006), and the
* Address for correspondence: T. D. Moody, Ph.D., Psychiatry UCLA Semel Institute, Los Angeles, CA 90095-1759, USA. (Email:
[email protected])
converse is true for between 25% and 39% of those with AN (Grant et al. 2002, Rabe-Jablonska Jolanta & Sobow Tomasz, 2000). Further, there is over concern with the appearance of specific body parts, such as size of abdomen, hips, and thighs (Grant & Phillips, 2004). On the other hand, there are important differences; notably in gender distribution, which is far less skewed toward females in BDD (Rief et al. 2006; Koran et al. 2008; Buhlmann et al. 2010). BDD is also characterized by more negative self-evaluation, poorer self-worth, and more avoidance of social activities compared to AN (Rosen & Ramirez, 1998; Hrabosky et al. 2009; Kollei et al. 2012). These similarities raise the possibility that AN and BDD may experience partially shared abnormalities in visual processing, expressed in pathological extremes of body shape or size perception (Cororve & Gleaves, 2001). Previous research by the authors suggests abnormalities in the processing of configural and holistic visual
2 T. D. Moody et al. information (Feusner et al. 2007, 2011) along with abnormalities in brain network organization and white-matter microstructure in BDD (Arienzo et al. 2013; Buchanan et al. 2013; Feusner et al. 2013). Although several neuroimaging studies in AN suggest abnormal brain activation when visually processing body images (Wagner et al. 2003; Uher et al. 2005; Sachdev et al. 2008) no studies have directly compared visual processing, or patterns of functional connectivity across BDD and AN – an approach that may elucidate transdiagnostic neural phenotypes (Insel & Cuthbert, 2009). Here we report on functional connectivity within an occipito-temporal visual network specialized for face processing, using a task-functional magnetic resonance imaging (fMRI) experiment. We interrogated this circuit with face stimuli because of the abundant background knowledge of face processing from studies conducted with healthy controls (HC), and because prior studies by our group in BDD allowed for a testable model of an aberrant phenotype shared by BDD and AN (Hrabosky et al. 2009). A model of aberrant visual information processing Available neurophysiological and MRI data depict circuitry and nodes of information flow governing the processing of visual stimuli at high and low spatial frequency (HSF/LSF, respectively). HSF information conveys the fine details of an image, while LSF information provides the coarse features, including configural and holistic elements; it is the joint processing of these spatial frequency details that form integrated percepts (Bullier, 2001). Consistent with this model, there is evidence of a disassociation in occipital and temporal cortices for HSF and LSF information (Hegde, 2008) and for specialized sub-networks for processing different spatial frequency information (Shipp & Zeki, 1995; Shipp, 2001). The well-described face-processing network that includes the occipital face area and right fusiform face area (R FFA; Fox et al. 2009) also has specialized sub-networks for HSF and LSF information (Shipp & Zeki, 1995; Rotshtein et al. 2007; Shipp, 2001). Accordingly, we tested a model proposed by Rotshtein et al. (2007), supported, as well, by multiple previous psychophysical, fMRI and electroencephalographic studies (see Ruiz-Soler & Beltran, 2006 for a review), which posits convergence of LSF and HSF processing in R FFA from an earlier split in the processing stream. We examine a model of convergence of LSF and HSF processing at the R FFA, wherein LSF information feeds forward bilaterally via an anterior occipital face area to R FFA, and HSF information feeds forward via a posterior occipital
face area to left inferior temporal gyrus (ITG), and then to R FFA (Rotshtein et al. 2007). This model of face processing, provided a structure for testing our hypotheses regarding visual processing abnormalities in AN and BDD (Fig. 1). Based on previous fMRI studies in BDD (Feusner et al. 2007, 2010, 2011), and assuming similar visual processing abnormalities in AN as in BDD, we hypothesized that BDD and AN would have reduced functional connectivity compared to HC within an occipito-temporal face network, specifically between the anterior occipital face area (right and left) and R FFA for LSF stimuli. For HSF stimuli, because previous studies in BDD have not found abnormal activation for HSF images in visual systems, we hypothesized that BDD, AN, and HC would not differ in functional connectivity between the posterior occipital face area and R FFA, nor between left ITG and R FFA. We also predicted that AN and BDD would have greater functional connectivity than HC between the R FFA and regions in the salience network for HSF, but not for LSF, due to greater salience of details of appearancerelated features. The salience network is important in processing interoceptive information (Seeley et al. 2007), and a recent study found reduced salience network activity in AN (McFadden et al. 2014). In additional exploratory analyses, we investigated wholebrain connectivity using R FFA as a seed to probe for other aberrant neural circuitry.
Participants and method Participants We recruited 60 adults, aged 20–48 years, in three groups: BDD (n = 20), weight-restored AN (n = 20), and HC (n = 20). All participants gave written informed consent for the UCLA Institutional Review Boardapproved protocol. Clinical evaluations were performed for BDD participants by J.D.F. and for AN participants by C.B. or M.S. We screened participants for primary or comorbid diagnoses with the Mini-International Neuropsychiatric Interview (MINI v. 6.0; Sheehan et al. 1998). We assessed for severity of psychiatric symptoms using the Hamilton Anxiety Rating Scale (HAMA; Hamilton, 1959), Brown Assessment of Beliefs Scale (BABS; Eisen et al. 1998), and the Montgomery–Åsberg Depression Rating Scale (MADRS; Montgomery & Asberg, 1979). In addition, BDD participants received the BDD version of the Yale–Brown Obsessive–Compulsive Scale (BDDYBOCS; Phillips et al. 1997), and AN participants received a modified version of the Eating Disorder Evaluation Edition 16.0D (EDE; Fairburn et al. 2008).
Face processing in BDD and AN 3 All of our AN participants were restricting type and were weight-restored. All participants had normal/corrected visual acuity, as tested with a Snellen eye chart, and all were righthanded, per the Edinburgh Handedness Inventory (Oldfield, 1971). One BDD and one AN participant was taking psychiatric medications and the rest were unmedicated.
to respond as quickly as possible. The control task consisted of matching ovals and circles. (Normal spatial frequency face images were also shown but were not part of this analysis.) A total of 48 sets of face stimuli were presented in alternating blocks of HSF, LSF, NSF, or control, with four sets of images per block. The order of stimuli was counterbalanced across participants using a Latin squares design.
AN and BDD inclusion/exclusion criteria
MRI acquisition protocol
BDD individuals were eligible who met DSM-IV criteria using the BDD Diagnostic Module (Phillips et al. 1995) and had a score of 520 on the BDD-YBOCS. Any screened BDD individual positive for a lifetime diagnosis of AN or bulimia nervosa was excluded. Individuals with AN were eligible if they met DSM-IV criteria (excluding the requirement of amenorrhea) and had a body mass index (BMI) of 518.5. We chose to study only weight-restored AN individuals to avoid confounds of starvation on brain activity. Six of the 20 AN participants and three of the 20 BDD participants were in treatment at the time of the study. Individuals with co-morbid AN and BDD were excluded, as were those with concurrent Axis I disorders besides major depression, dysthymia, panic disorder, social phobia, generalized anxiety disorder. These diagnoses were allowed given their frequency in BDD and AN, and our wish to recruit a representative clinical sample. Individuals were excluded if they had current substance use disorders.
Scanning was performed on a 3-T Siemens TRIO at the Ahmanson-Lovelace Brain Mapping Center at University of California, Los Angeles. We collected blood oxygenation level dependent (BOLD) functional echo-planar images (EPI) using: repetition time (TR) 2.5 s; echo time (TE) 25 ms; flip angle, 80°; voxel dimensions, 3 × 3 × 3 mm; 0.75 mm gap; field-ofview, 192 mm; matrix, 64 × 64; 133 measurements; 32 slices. Data collected during the first three TRs were discarded for T1 equilibration. A matched-bandwidth T2 structural scan, co-planar to the EPIs, was acquired: TR of 5 s; TE, 34 ms; flip angle, 90°; 32 slices; voxel dimensions, 1.5 × 1.5 × 3 mm, field-of-view, 192 mm; and matrix, 128 × 128. We obtained a high-resolution MPRAGE T1-weighted image to provide detailed brain anatomy with: TR 1.9 s, TE 2.26 ms, and voxel dimensions 1 × 1 × 1 mm.
HC exclusion criteria HC participants could not meet any criteria for Axis I disorders, including substance use disorders. Ethical standards The authors assert that all procedures contributing to this work comply with the ethical standards of the relevant national and institutional committees on human experimentation and with the Helsinki Declaration of 1975, as revised in 2008. Faces: stimuli and task Visual stimuli included neutral-expression faces, spatial frequency-filtered to include only HSF and LSF as previously described (Iidaka et al. 2004). The forcedchoice, two-sample task consisted of a target face and two selection faces that appeared simultaneously on the screen for 4 s (Fig. 2). Participants pressed the right or left button to choose the selection face that was identical to the target face, and after the participant responded, the fixation cross appeared during the inter-stimulus interval of 0.5 s. We told participants
MRI data processing MRI data were processed using FEAT (FMRI Expert Analysis Tool) version 6.0, part of FSL (FMRIB’s Software Library; http://www.fmrib.ox.ac.uk/fsl). Image processing steps included motion correction, skull-stripping, spatial smoothing, normalization, and temporal filtering. Registration to standard space was carried out using a three-step transformation to register each functional image to a co-planar structural image, then to MPRAGE, and finally to Montreal Neurological Institute (MNI) standard brain space. We visually inspected all images for proper registration as well as relative and absolute motion to identify motion spikes. There was not a significant effect of motion among groups as measured by DVARS (F57,2 = 1.41, p = 0.25) where DVARS is D: temporal Derivative of time courses; VARS: root mean square VARiance over voxels, a measure of the change rate of signal across the brain. Additional details of motion calculation and exclusions are given in the Supplementary material. Face-processing model: seeds and targets The model of face processing which underlies our analysis is diagrammed in Fig. 1a. We tested LSF and HSF
4 T. D. Moody et al.
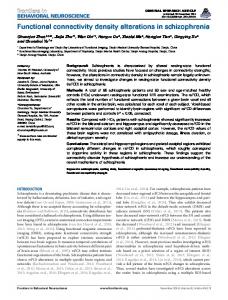
Fig. 1. (a) Model of face-processing regions: LSF, low spatial frequency; HSF, high spatial frequency; FFA, fusiform face area; ITG, inferior temporal gyrus. Regions specialized for LSF processing in purple and HSF processing in green and aqua; regions specialized for both LSF and HSF in yellow (adapted from Rotshtein et al. 2007). Right-most panel shows regions within the salience network, in red. (b) Seed and target masks for functional connectivity analyses. (a), (b) FFA mask shown in yellow, bilateral anterior occipital face area seeds in purple, right posterior occipital face area seed in green, and left ITG seed in aqua. (c) Salience network mask, in red.
streams separately: functional connectivity between left and right anterior occipital face areas and R FFA for LSF faces; and between right posterior occipital face area and R FFA, and left ITG and R FFA, for HSF faces. Functional seeds for each group were
derived from data during face processing, using the leave-one-subject-out (LOSO) procedure to reduce bias due to non-independence (Esterman et al. 2010). We created separate group LOSO masks of right and left anterior occipital face area, right posterior occipital
Face processing in BDD and AN 5
Fig. 2. (a) Example face stimuli. HSF, High spatial frequency; LSF, low spatial frequency; NSF, normal spatial frequency. (b) Functional magnetic resonance imaging experimental design: matching task in blocks of HSF, LSF, and NSF faces, alternating with control task of circles and ovals.
face area, left ITG, and right R FFA, to functionally localize face visual processing areas (Fig. 1b). The salience network mask was derived from the Harvard Oxford Atlas, comprised of orbitofrontal, anterior cingulate, and insula masks thresholded at 50% (Seeley et al. 2007). (See Supplementary method for LOSO analysis.) Statistical analyses We used one-way ANOVAs and χ2 tests to assess differences among groups for our demographic, clinical, and task performance measures. We calculated functional connectivity using psychophysiological interaction (PPI) analyses (Friston et al. 1997). PPI is a hypothesis-driven method of analyzing functional connectivity of brain regions during a specific task, based upon correlation of the time-series between ‘seed’ and ‘target’ brain regions. It is used to test for interactions between a ‘psychological’ state (in this experiment, matching human faces) and a ‘physiological’ state (coupling of activation between seed and target time series). A first-level PPI analysis of faces stimuli contrasted to control task was obtained for all participants for each set of LSF and HSF stimuli. Then first-level PPI results, specific for each functional seed and spatial frequency, were carried up to group-level analyses specific for each target region. First-level contrast Z
statistic images were entered in between-group analyses using each subject as a random factor. All Z statistic images were thresholded using clusters determined by Z > 2.0, and a corrected-cluster significance threshold of p= 0.05 (Worsley, 2001), with the exception of two exploratory analyses that used Z > 1.7, as indicated, and a cluster-corrected significance threshold of p = 0.05). For LSF processing, we evaluated connectivity between the left and right anterior occipital face area and R FFA. For HSF processing, we evaluated connectivity between right posterior occipital face area and R FFA, and between left ITG and R FFA. For salience network connectivity, we evaluated connectivity between R FFA and a salience-network target mask. For exploratory analyses we tested connectivity between R FFA and all other voxels in the brain. We performed one-way between-group ANOVAs for each seed-target pair hypothesis, followed by t tests for AN v. HC and BDD v. HC to test group specificity. As post-hoc exploratory analyses, we also compared AN v. BDD for the aforementioned connectivity. Results Demographics and behavioral results Results of one-way ANOVAs revealed that BDD, AN, and HC groups did not differ in mean age or years
6 T. D. Moody et al. Table 1. Demographics and psychometrics
Age, years Sex (females/males) Education (years completed) BMI HAMA MADRS BABS BDD-YBOCs (BDD) EDE (AN) Co-morbidities BDD concerns Facial Non-facial Facial and non-facial
Tukey follow-up statistics
BMI
MADRS
HAMA
AN (n = 20)
BDD (n = 20)
HC (n = 20)
22.3 ± 4.4 18/2 14.1 ± 3.2 20.4 ± 1.4 6.7 ± 5.6 10.5 ± 9.5 N.A. N.A. 2.8 ± 1.4 7
21.5 ± 3.5 15/5 13.5 ± 2.0 22.6 ± 2.8 11.6 ± 6.2 18.4 ± 8.1 14.1 ± 3.5 31.0 ± 5.3 N.A. 13
23.3 ± 4.6 17/3 14.7 ± 2.8 22.2 ± 2.2 2.0 ± 1.8 0.9 ± 1.3 N.A. N.A. N.A. 0
N.A.
8 1 11
N.A.
N.A. N.A.
Tukey test for differences between means AN v. BDD AN v. HC BDD v. HC AN v. BDD AN v. HC BDD v. HC AN v. BDD AN v. HC BDD v. HC
F 0.88 χ2 = 1.68 1.80 5.5 19.2 29.2
p level 0.42 0.43 0.17 0.0061 < 0.0012 < 0.0013
N.A. N.A.
Difference −2.2 −1.8 0.3 −7.9 9.6 17.5 −4.9 4.8 9.7
Test statistics 4.4 4.3 8.8 4.4 6.4 10.8 4.4 4.3 8.8
p level 0.009 0.03 0.9 0.003 HC, t18 = 8.76, p < 0.001); MADRS
(AN < BDD, t 18 = 4.9, p = 0.003; AN > HC, t 18 = 5.9, p < 0.001; BDD > HC, t18 = 10.8, p < 0.001). Co-morbidities and types of appearance concerns in BDD (facial and non-facial) are also listed in Table 1. A complete list of co-morbidities can be found in Supplementary Table S4 (see also Supplementary method). There were no significant group differences in response times or accuracy rates during the matching tasks (see Supplementary Figs S3 and S4). PPI analysis results R FFA connectivity with occipital-temporal face network LSF connectivity with R FFA. The ANOVA results demonstrated significant differences between groups for LSF connectivity. Contrary to our hypotheses, comparisons between groups found greater connectivity
Face processing in BDD and AN 7
Fig. 3. (a) Regions within fusiform face area (FFA) target (blue) with significantly greater connectivity from the left anterior occipital face area seed for low spatial frequency (LSF) faces, for body dysmorphic disorder (BDD) compared to healthy controls (HC), left side, and BDD compared to anorexia nervosa (AN), right side, (Z > 2.0, P = 0.05, corrected). Box plots indicate the direction of the connectivity, showing the average t statistic for each group for the cluster. (b) Regions within the salience network target (red) with significantly greater connectivity from the FFA seed for high spatial frequency (HSF) faces, for AN compared to BDD (Z > 2.0, p = 0.05, corrected).
between left anterior occipital face area and R FFA for BDD v. HC (Fig. 3a, left). Also contrary to our hypotheses, there were no significant differences in connectivity between right anterior occipital face area and the R FFA for either AN v. HC, or BDD v. HC. There was greater connectivity between left anterior occipital face area and R FFA for BDD v. AN (Fig. 3a, right). This cluster was examined as a region of interest to explicate group differences, with the t statistic group averages shown in the box plots. (See Supplementary method: ‘Method for examining direction of connectivity differences’ for details of the method.) In addition, we reran all of our significant betweengroup results with sex as a covariate, and found that the results were virtually identical (see Supplementary Fig. S7). HSF connectivity with R FFA. Consistent with our hypotheses, for HSF connectivity the ANOVA revealed no significant differences between groups for
connectivity between right posterior occipital face area and R FFA or for left ITG and R FFA. R FFA connectivity with the salience network LSF connectivity with the salience network. Consistent with our hypotheses, for LSF stimuli the ANOVA revealed no significant differences between groups for connectivity between R FFA and the salience network. HSF connectivity with the salience network. For HSF stimuli, the ANOVA resulted in significant differences between groups. Contrary to our hypotheses, followup comparisons found no differences for AN v. HC or BDD v. HC for connectivity between R FFA and the salience network; however, there was greater connectivity for AN v. BDD in salience network regions, including right insula and right orbitofrontal cortex (Fig. 3b).
8 T. D. Moody et al.
Fig. 4. Exploratory results for connectivity between the fusiform face area (FFA) seed and the rest of the brain for low spatial frequency (LSF) faces. (a) Body dysmorphic disorder (BDD) > healthy controls (HC) in blue; HC > BDD in green; Z > 2.0, p = 0.05, corrected. (b) anorexia nervosa (AN) > HC in red; HC > AN in green; Z > 1.7, p = 0.05, corrected.
R FFA connectivity to whole brain – exploratory LSF connectivity – exploratory BDD < HC and AN < HC. There was lower LSF connectivity for BDD v. HC between R FFA and right insula, putamen, thalamus, and central opercular cortex (Fig. 4a). For AN < HC, there were no significant differences at Z > 2.0, but reducing the statistical threshold (Z > 1.7, p< 0.05, corrected) revealed lower connectivity for AN between R FFA and right insula and central opercular cortex (Fig. 4b). BDD > HC and AN > HC. There was greater LSF connectivity for BDD v. HC between R FFA and right and left precuneus, right posterior cingulate cortex (PCC), and left lingual gyrus (Fig. 4a). For AN > HC, there were no significant differences at Z > 2.0, but reducing the statistical threshold (Z > 1.7, P < 0.05, corrected) revealed greater connectivity for AN between R FFA and right and left precuneus, left PCC, and right thalamus (Fig. 4b). Additional details of LSF significant results can be found in Supplementary Table S1 and Fig. S1.
HSF connectivity–exploratory. HSF significant results for all groups are shown in Supplementary Fig. S2. Post-hoc regression analyses. To follow up on the significant between-groups results, we performed post-hoc regression analyses on functional connectivity and the main symptom measure for each of the AN and BDD groups, using Bonferroni-adjusted alpha levels as a correction for multiple comparisons. The relationship between LSF connectivity between the left anterior occipital face area and the R FFA and BDD-YBOCS scores (see Fig. 5a), showed that higher connectivity strength showed a trend for association with lower BDDYBOCS scores (R2 = 0.26, F1,19 = 5.8, P = 0.027), not surviving Bonferroni correction (α = 0.05/3 = 0.017). For AN, we examined the relationship between degree of HSF connectivity between the R FFA and the orbitofrontal cortex (in the salience network), and clinical symptom severity (EDE) scores for AN (see Fig. 5b). Higher connectivity strength showed a trend for association with lower scores (R2 = 0.19, F1,19 = 4.14, P = 0.057), although not surviving Bonferroni correction (α = 0.05/5 = 0.01).
Face processing in BDD and AN 9 in the scanner triggered thoughts about their own appearance (see Supplementary Table S3 and Supplementary method for linear regressions). For AN, we found that greater connectivity for LSF faces between R FFA and PCC was significantly associated with higher self-referential thinking scores (R2 = 0.46, F1,16 = 12.7, p = 0.003) (Fig. 5c), passing Bonferroni correction (α = 0.05/3 = 0.017). For BDD, there was no significant relationship between connectivity and the subjective experience scores. Discussion
Fig. 5. (a) Low spatial frequency (LSF) functional connectivity between left (L) anterior occipital face area and fusiform face area (FFA) trend for association with body dysmorphic disorder–Yale-Brown Obsessive Compulsive Scale (BDD-YBOCS) score for BDD. (b) High spatial frequency functional connectivity between right (R) FFA and R frontal orbital cortex trend for association with Eating Disorder Evaluation (EDE). (c) LSF functional connectivity between R FFA and posterior cingulate cortex (PCC) is associated with degree of self-referential thinking for anorexia nervosa. Note: values for self-referential thinking scores are demeaned.
To understand how abnormal functional connectivity patterns in face-processing systems may relate to subjective experience in AN and BDD participants when viewing facial images, we performed additional regression analyses between the degree of functional connectivity and scores on post-scan questionnaires that quantified the degree to which each face viewed
To our knowledge, our results provide the first evidence of aberrant functional connectivity in BDD within an occipito-temporal face-processing network, specifically for faces that contain configural and holistic elements. This pattern was not observed in AN, although there was a remarkably similar pattern of functional connectivity for these image types in AN and BDD between the R FFA and higher-order regions including insula, central opercular cortex, and PCC/ precuneus. For high detail images, BDD and AN showed differences from each other and HC in functional connectivity patterns between R FFA and higher-order regions, but not in occipito-temporal networks. This profile suggests BDD and AN have similar LSF processing-stream abnormalities in higher-order systems; however, LSF connectivity within occipitotemporal fac- processing networks is affected in BDD, but not AN. Although we predicted lower connectivity for LSF stimuli for both AN and BDD groups, we found greater connectivity between right anterior occipital face area and R FFA, in the BDD group only. We had predicted decreased connectivity based on the relative hypoactivity for LSF faces observed in a previous study examining patterns of regional fMRI activation (Feusner et al. 2010). However, abnormalities in degree of regional activation do not always indicate a corresponding alteration in functional connectivity. Moreover, the regions found to be hypoactive in the previous study were earlier in the visual processing stream (V1 and V2) than those examined in the current study. It is possible therefore that increased connectivity may reflect compensatory mechanisms for abnormal processing in earlier visual regions (Bolte et al. 2006). This is supported by the observation that those with higher connectivity strength had lower symptom severity (BDD-YBOCS scores). While the phenomenology of AN suggests that individuals may experience perceptual distortions, this may not be reflected in abnormalities in these occipitotemporal visual networks for faces. Instead, this may be a function of disturbances in higher-order
10 T. D. Moody et al. processing of consciously perceived images. Alternatively, the absence of significant abnormalities in occipito-temporal visual network could be a reflection of the clinical observations (J. D. Feusner et al. unpublished observations) that faces do not seem to be as much a focus of attention in AN as other appearance features, such as abdomen, thighs, and hips. By contrast, facial features, including facial skin, are common appearance concerns in BDD (Phillips, 2005), which is consistent with the pattern of specific concerns found in our sample (see Table 1). Another possibility is that aberrant connectivity in AN is limited to the acutely malnourished state, remitting when BMI is normalized. Consistent with this idea Kingston et al. (1996) showed that underweight AN improved their performance on the Rey Complex Figure Task (RCFT) after gaining 10% of body weight (although the RCFT task taps into both visuo-spatial and executive functioning systems; Shin et al. 2006). Moreover, a recent effective connectivity fMRI study in underweight individuals with AN found abnormal functional organization within a body-processing visual network for body visual stimuli (Suchan et al. 2013). Future within-subject study designs, comparing face and non-face stimuli in AN scanned prospectively, will help discern these possibilities. R FFA connectivity to salience network is greater for high detail images in AN than BDD Contrary to our hypotheses, we did not find greater connectivity for HSF stimuli for either AN or BDD compared to HC. Instead, we found greater HSF connectivity for AN relative to BDD between R FFA and right fronto-insular regions. This could be related to aberrant insular and orbitofrontal activity (Frank et al. 2012) and/or insular connectivity (Kullmann et al. 2014) that previous studies have found in AN, and could reflect abnormal integration of high-detail face information in the context of general body awareness. Why this was observed for AN only in contrast to BDD is unclear. The observation that individuals with higher connectivity between R FFA and the orbitofrontal cortex had lower severity of eating disorder symptoms could be an indication of a compensatory process. As hypothesized, compared to HC, neither the BDD nor the AN group had greater connectivity for LSF images between R FFA and the salience network. R FFA has similar connectivity to higher-order regions in AN and BDD Our results in AN and BDD showed similar, abnormally strong, connectivity between R FFA and precuneus and adjacent PCC for LSF stimuli, although the
magnitude of the differences from HC was greater for BDD than AN (as reflected in results significant only at a lower Z threshold for AN). Connectivity in response to face stimuli has been observed between R FFA and precuneus in HC (Davies-Thompson & Andrews, 2012). Moreover, the precuneus and PCC are implicated in memory, visual imagery (Cavanna & Trimble, 2006), retrieving episodic memories associated with faces (Gobbini & Haxby, 2007), and, particularly as network hubs in the default mode network (DMN) (Gusnard et al. 2001; Raichle et al. 2001), self-referential thinking (Berman et al. 2011). Our results are consistent with a recent study in AN that found increased activation in DMN regions associated with self-referential thought (Cowdrey et al. 2014). One interpretation of our results is that enhanced connectivity between face-processing regions and precuneus/PCC in AN and BDD could reflect similar tendencies across disorders to engage in self-referential thinking when viewing images of others, particularly since individuals with both disorders spend an inordinate amount of time thinking about their appearance and comparing their appearance to others. Facial stimuli could also trigger thoughts of self or thoughts of others’ perspectives of themselves (Cavanna & Trimble, 2006), or they could initiate thoughts of others as suggested by a recent AN study examining perspective-taking related to self-identity that found greater activation in precuneus for thoughts of friends and their appearance (McAdams & Krawczyk, 2014). These interpretations are speculative; however, we have evidence that specific thought patterns may be related to connectivity between these regions in the current study, as the post-hoc regression analysis revealed that the degree to which the facial stimuli triggered self-referential thinking is associated with activity in precuneous and PCC for AN participants. It is unclear at present why this relationship was not observed in BDD participants. Regions of decreased LSF connectivity for both BDD and AN groups compared to HC were found in insula and in central opercular cortex. These results are in line with recent studies that report aberrant insula and salience network activity in women with AN (Kim et al. 2012; Kullmann et al. 2014; McFadden et al. 2014). The insula is important for recognition and response to salient stimuli and for processing interoceptive information. The decrease in connectivity between the R FFA and the insula could disrupt interoceptive functions and result in misinterpretation of interoceptive information, contributing to disturbances in integration of configural and holistic information about face with general body awareness, ultimately exacerbating AN and BDD symptoms.
Face processing in BDD and AN Clinical significance The findings have clinical relevance. Distortions of perception may contribute to poor insight in BDD, limiting engagement in treatment (Eisen et al. 2004), and unremitted perceptual disturbance may foreshadow increased risk of relapse in AN (Keel et al. 2005). Aberrant processing in occipito-temporal face networks of configural and holistic visual elements in BDD could be associated with a reduced ability to contextualize details, which, in turn, could maintain perceptual distortions expressed clinically as a conviction of flaws and imperfections. The results also have implications for understanding phenotypic overlaps in AN and BDD. Given evidence for similar abnormal functional connectivity for face processing in higher-order integrative and emotional systems, this abnormality may explain heightened selfreferential thinking across body image disorders. In contrast, the existence of distinct phenotypes of abnormal connectivity patterns within visual networks may shed light on syndrome-specific clinical-behavioral variations. In this regard, the combined results for LSF and HSF point to abnormalities that could inform the development of innovative perceptual retraining treatments. For BDD, therapies using tasks that mediate configural and holistic elements of a stimulus by engaging the dorsal visual stream (Nan et al. 2013), may hold benefit by normalizing LSF connectivity if it compensates for deficient activation in the visual cortical areas that normally feed forward LSF information to the dorsal stream. Likewise, for AN, there may be utility in perceptual retraining that involves face and body awareness/integration (Vocks et al. 2010). For both AN and BDD patients, empirical study of psychotherapy techniques that reduce self-referential thinking, such as those used in existing psychotherapies – Acceptance and Commitment Therapy (Hayes, 2005) being one recent example, mindfulness therapy being another, has at least theoretical justification.
11
explored because only one BDD patient had only nonface concerns. Future connectivity studies should examine responses to body stimuli in body processing networks. Co-morbidities differed between AN and BDD groups, which could have affected results. We did not have data on the length of weight restoration for all AN participants (for the three participants for whom we have data, the length was 5 months, 2 years, and 3 years). This information is difficult to obtain because typically part of the treatment for those with AN is to not weigh themselves, and often their therapists or dieticians do not tell them their weight.
Conclusions We found similar abnormal functional connectivity for face processing in higher-order systems in BDD and AN, but distinct abnormal connectivity patterns within occipito-temporal visual networks. The observed abnormalities in functional connectivity for configural and holistic visual information within face-processing networks in individuals with BDD may contribute to distorted perception due to formation of an atypical visual template. For individuals with AN, the absence of similar abnormalities in connectivity in earlier faceprocessing networks may be due to a lesser degree of emotional relevance of faces, or perhaps to attenuation of aberrant connectivity with normalization of weight. Findings have implications for understanding relationships between these disorders and the pathophysiology underlying perceptual distortions.
Supplementary material For supplementary material accompanying this paper visit http://dx.doi.org/10.1017/S0033291715001397.
Limitations
Acknowledgements
There are several limitations. We did not have functional localizer data available to optimally identify individual visual seed regions; instead we created functional seeds using the LOSO method which reduces statistical non-independence bias (Esterman et al. 2010). Results from PPI analyses do not specify directionality, preventing conclusions about direction of information flow. We chose face stimuli due to prior knowledge of visual processing with respect to spatial frequencies in HC and in BDD; however, face stimuli may be more salient and symptom-relevant in BDD compared to AN. A comparison of BDD subgroups with face v. non-face concerns could not be
We thank all the individuals who participated in this study, Nathan Hutcheson and Sarah Madsen for helpful comments on the manuscript, and Giulia Salgari for statistical analysis of ratings scores. Dr Strober received support from the Resnick endowed Chair in Eating Disorders. Funding sources are: Dr Feusner (R01MH093535 and 5K23MH079212) and Dr Bohon (2T32MH073517).
Declaration of Interest None.
12 T. D. Moody et al. References Arienzo D, Leow A, Brown JA, Zhan L, Gadelkarim J, Hovav S, Feusner JD (2013). Abnormal brain network organization in body dysmorphic disorder. Neuropsychopharmacology 38, 1130–1139. Berman MG, Peltier S, Nee DE, Kross E, Deldin PJ, Jonides J (2011). Depression, rumination and the default network. Social Cognitive and Affective Neuroscience 6, 548–555. Bolte S, Hubl D, Feineis-Matthews S, Prvulovic D, Dierks T, Poustka F (2006). Facial affect recognition training in autism: can we animate the fusiform gyrus? Behavioral Neuroscience 120, 211–216. Buchanan B, Rossell S, Maller JJ (2013). Brain connectivity in body dysmorphic disorder compared with controls: a diffusion tensor imaging study. Biological Psychiatry 73, 306S–306S. Buhlmann U, Glaesmer H, Mewes R, Fama JM, Wilhelm S, Brahler E, Rief W (2010). Updates on the prevalence of body dysmorphic disorder: a population-based survey. Psychiatry Research 178, 171–175. Bullier J (2001). Integrated model of visual processing. Brain Research Reviews 36, 96–107. Cavanna AE, Trimble MR (2006). The precuneus: a review of its functional anatomy and behavioural correlates. Brain 129, 564–583. Cororve MB, Gleaves DH (2001). Body dysmorphic disorder: a review of conceptualizations, assessment, and treatment strategies. Clinial Psychological Review 21, 949–970. Cowdrey FA, Filippini N, Park RJ, Smith SM, McCabe C (2014). Increased resting state functional connectivity in the default mode network in recovered anorexia nervosa. Human Brain Mapping 35, 483–491. Davies-Thompson J, Andrews TJ (2012). Intra- and interhemispheric connectivity between face-selective regions in the human brain. Journal of Neurophysiology 108, 3087–3095. Eisen JL, Phillips KA, Baer L, Beer DA, Atala KD, Rasmussen SA (1998). The brown assessment of beliefs scale: reliability and validity. American Journal of Psychiatry 155, 102–108. Eisen JL, Phillips KA, Coles ME, Rasmussen SA (2004). Insight in obsessive compulsive disorder and body dysmorphic disorder. Comprehensive Psychiatry 45, 10–15. Esterman M, Tamber-Rosenau BJ, Chiu YC, Yantis S (2010). Avoiding non-independence in fMRI data analysis: leave one subject out. Neuroimage 50, 572–576. Fairburn CG, Cooper Z, O’Connor ME (2008). Cognitive Behavior Therapy and Eating Disorders. The Guilford Press: New York. Feusner JD, Arienzo D, Li W, Zhan L, GadElkarim J, Thompson PM, Leow AD (2013). White matter microstructure in body dysmorphic disorder and its clinical correlates. Psychiatry Research-Neuroimaging 211, 132–140. Feusner JD, Hembacher E, Moller H, Moody TD (2011). Abnormalities of object visual processing in body dysmorphic disorder. Psychological Medicine 41, 2385–2397. Feusner JD, Moody T, Townsend J, McKinley M, Hembacher E, Moller H, Bookheimer S (2010). Abnormalities of visual processing and frontostriatal systems in body dysmorphic disorder. Archives of General Psychiatry 67, 197–205.
Feusner JD, Townsend J, Bystritsky A, Bookheimer S (2007). Visual information processing of faces in body dysmorphic disorder. Archives of General Psychiatry 64, 1417–1425. Fox CJ, Iaria G, Barton JJ (2009). Defining the face processing network: optimization of the functional localizer in fMRI. Human Brain Mapping 30, 1637–1651. Frank GK, Reynolds JR, Shott ME, Jappe L, Yang TT, Tregellas JR, O’Reilly RC (2012). Anorexia nervosa and obesity are associated with opposite brain reward response. Neuropsychopharmacology 37, 2031–2046. Friston KJ, Buechel C, Fink GR, Morris J, Rolls E, Dolan RJ (1997). Psychophysiological and modulatory interactions in neuroimaging. Neuroimage 6, 218–229. Gobbini MI, Haxby JV (2007). Neural systems for recognition of familiar faces. Neuropsychologia 45, 32–41. Grant JE, Kim SW, Eckert ED (2002). Body dysmorphic disorder in patients with anorexia nervosa: prevalence, clinical features, and delusionality of body image. International Journal of Eating Disorders 32, 291–300. Grant JE, Phillips KA (2004). Is anorexia nervosa a subtype of body dysmorphic disorder? Probably not, but read on. Harvard Review of Psychiatry 12, 123–126. Gusnard DA, Akbudak E, Shulman GL, Raichle ME (2001). Medial prefrontal cortex and self-referential mental activity: relation to a default mode of brain function. Proceedings of the National Academy of Sciences USA 98, 4259–4264. Hamilton M (1959). The assessment of anxiety states by rating. The British Journal of Medical Psychology 32, 50–55. Hayes S (2005). Get Out of Your Mind and Into Your Life: The New Acceptance and Commitment Therpay. New Harbinger Publications Inc.: Oakland, CA. Hegde J (2008). Time course of visual perception: coarse-to-fine processing and beyond. Progress in Neurobiology 84, 405–439. Hrabosky JI, Cash TF, Veale D, Neziroglu F, Soll EA, Garner DM, Strachan-Kinser M, Bakke B, Clauss LJ, Phillips KA (2009). Multidimensional body image comparisons among patients with eating disorders, body dysmorphic disorder, and clinical controls: a multisite study. Body Image 6, 155–163. Iidaka T, Yamashita K, Kashikura K, Yonekura Y (2004). Spatial frequency of visual image modulates neural responses in the temporo-occipital lobe. An investigation with event-related fMRI. Brain Research Cognitive Brain Research 18, 196–204. Insel TR, Cuthbert BN (2009). Endophenotypes: bridging genomic complexity and disorder heterogeneity. Biological Psychiatry 66, 988–989. Keel PK, Dorer DJ, Franko DL, Jackson SC, Herzog DB (2005). Postremission predictors of relapse in women with eating disorders. American Journal of Psychiatry 162, 2263–2268. Kim KR, Ku J, Lee JH, Lee H, Jung YC (2012). Functional and effective connectivity of anterior insula in anorexia nervosa and bulimia nervosa. Neuroscience Letters 521, 152–157. Kingston K, Szmukler G, Andrewes D, Tress B, Desmond P (1996). Neuropsychological and structural brain changes in anorexia nervosa before and after refeeding. Psychological Medicine 26, 15–28.
Face processing in BDD and AN Kollei I, Brunhoeber S, Rauh E, de Zwaan M, Martin A (2012). Body image, emotions and thought control strategies in body dysmorphic disorder compared to eating disorders and healthy controls. Journal of Psychosomatic Research 72, 321–327. Koran LM, Abujaoude E, Large MD, Serpe RT (2008). The prevalence of body dysmorphic disorder in the United States adult population. CNS Spectrums 13, 316–322. Kullmann S, Giel KE, Teufel M, Thiel A, Zipfel S, Preissl H (2014). Aberrant network integrity of the inferior frontal cortex in women with anorexia nervosa. Neuroimage: Clinical 4, 615–622. McAdams CJ, Krawczyk DC (2014). Who am I? How do I look? Neural differences in self-identity in anorexia nervosa. Social Cognitive and Affective Neuroscience 9, 12–21. McFadden KL, Tregellas JR, Shott ME, Frank GK (2014). Reduced salience and default mode network activity in women with anorexia nervosa. Journal of Psychiatry and Neuroscience 39, 178–188. Montgomery SA, Asberg M (1979). A new depression scale designed to be sensitive to change. British Journal of Psychiatry 134, 382–389. Nan W, Wan F, Lou CI, Vai MI, Rosa A (2013). Peripheral visual performance enhancement by neurofeedback training. Applied Psychophysiology and Biofeedback 38, 285–291. Oldfield RC (1971). The assessment and analysis of handedness: the Edinburgh inventory. Neuropsychologia 9, 97–113. Phillips KA (2005). The Broken Mirror. Oxford University Press: New York. Phillips KA, Atala KD, Pope HG Jr. (1995). Diagnostic Instruments for body dysmorphic disorder. In American Psychiatric Association 148th Annual Meeting, p. 157: Miami, FL. Phillips KA, Hollander E, Rasmussen SA, Aronowitz BR, DeCaria C, Goodman WK (1997). A severity rating scale for body dysmorphic disorder: development, reliability, and validity of a modified version of the Yale-Brown Obsessive Compulsive Scale. Psychopharmacology Bulletin 33, 17–22. Phillips KA, Kaye WH (2007). The relationship of body dysmorphic disorder and eating disorders to obsessive-compulsive disorder. CNS Spectrums 12, 347–358. Rabe-Jablonska Jolanta J, Sobow Tomasz M (2000). The links between body dysmorphic disorder and eating disorders. European Psychiatry 15, 302–305. Raichle ME, MacLeod AM, Snyder AZ, Powers WJ, Gusnard DA, Shulman GL (2001). A default mode of brain function. Proceedings of the National Academy of Sciences USA 98, 676–682. Rief W, Buhlmann U, Wilhelm S, Borkenhagen A, Brahler E (2006). The prevalence of body dysmorphic disorder: a population-based survey. Psychological Medicine 36, 877–885. Rosen JC, Ramirez E (1998). A comparison of eating disorders and body dysmorphic disorder on body image and psychological adjustment. Journal of Psychosomatic Research 44, 441–449.
13
Rotshtein P, Vuilleumier P, Winston J, Driver J, Dolan R (2007). Distinct and convergent visual processing of high and low spatial frequency information in faces. Cerebral Cortex 17, 2713–2724. Ruffolo J, Phillips K, Menard W, Fay C, Weisberg R (2006). Comorbidity of body dysmorphic disorder and eating disorders: severity of psychopathology and body image disturbance. International Journal of Eating Disorders 39, 11–19. Ruiz-Soler M, Beltran FS (2006). Face perception: an integrative review of the role of spatial frequencies. Psychological Research-Psychologische Forschung 70, 273–292. Sachdev P, Mondraty N, Wen W, Gulliford K (2008). Brains of anorexia nervosa patients process self-images differently from non-self-images: an fMRI study. Neuropsychologia 46, 2161–2168. Seeley WW, Menon V, Schatzberg AF, Keller J, Glover GH, Kenna H, Reiss AL, Greicius MD (2007). Dissociable intrinsic connectivity networks for salience processing and executive control. Journal of Neuroscience 27, 2349–2356. Sheehan DV, Lecrubier Y, Sheehan KH, Amorim P, Janavs J, Weiller E, Hergueta T, Baker R, Dunbar GC (1998). The Mini-International Neuropsychiatric Interview (M.I.N.I.): the development and validation of a structured diagnostic psychiatric interview for DSM-IV and ICD-10. Journal of Clinical Psychiatry 59(Suppl 20), 22–33. Shin MS, Park SY, Park SR, Seol SH, Kwon JS (2006). Clinical and empirical applications of the Rey-Osterrieth Complex Figure Test. Nat Protoc 1, 892–899. Shipp S (2001). Corticopulvinar connections of areas V5, V4, and V3 in the macaque monkey: a dual model of retinal and cortical topographies. Journal of Comparative Neurology 439, 469–490. Shipp S, Zeki S (1995). Segregation and convergence of specialised pathways in macaque monkey visual cortex. Journal of Anatomy 187, 547–562. Suchan B, Bauser DS, Busch M, Schulte D, Gronemeyer D, Herpertz S, Vocks S (2013). Reduced connectivity between the left fusiform body area and the extrastriate body area in anorexia nervosa is associated with body image distortion. Behavioral Brain Research 241, 80–85. Swinbourne JM, Touyz SW (2007). The co-morbidity of eating disorders and anxiety disorders: a review. European Eating Disorders Review 15, 253–274. Uher R, Murphy T, Friederich HC, Dalgleish T, Brammer MJ, Giampietro V, Phillips ML, Andrew CM, Ng VW, Williams SC, Campbell IC, Treasure J (2005). Functional neuroanatomy of body shape perception in healthy and eating-disordered women. Biological Psychiatry 58, 990–997. Vocks S, Busch M, Schulte D, Gronermeyer D, Herpertz S, Suchan B (2010). Effects of body image therapy on the activation of the extrastriate body area in anorexia nervosa: an fMRI study. Psychiatry Research 183, 114–118. Wagner A, Ruf M, Braus DF, Schmidt MH (2003). Neuronal activity changes and body image distortion in anorexia nervosa. Neuroreport 14, 2193–2197. Worsley KJ (2001). Statistical analysis of activation images. In Functional MRI: An Introduction to Methods (ed. P. Jezzard, P. M. Matthews and S. M. Smith), pp. 251–270. New York, NY: Oxford University Press.