Proceedings of the ASME 2015 International Design Engineering Technical Conferences & Computers and Information in Engineering Conference IDETC/CIE 2015 August 2-5, 2015, Boston, Massachusetts, USA
DETC2015-47865
EMPIRICAL STUDIES OF FUNCTIONAL DECOMPOSITION IN EARLY DESIGN
Joran W. Booth ∗ Abhinav K. Bhasin, Tahira N. Reid, Karthik Ramani School of Mechanical Engineering Purdue University
1
INTRODUCTION Functional decomposition has long been described as a an important step in early design, especially prior to concept generation (Table 1). The purpose of this method is to expand the potential design space that a designer can explore, thus increasing the number of generated ideas, and improving management and design team organization [1]. Others have suggested that this may lead to improved creativity [2]. Consequently, functional decomposition and related methods, such as biologicallyinspired design, design for affordance, and analogical design are very attractive for improving design creativity and quality. Consequently, this paper examines the impact of functional decomposition on concept generation and its impact on the overall design. This paper comprises two studies. In the first study, we introduce the concept of function to sophomore students and observe how they use this information to inform their designs. For this portion of the paper, we use “function” to mean “the solutionneutral detailed description of what are the intentions for the products” [3]. The second study in the paper looks at existing design reports from professional engineers. Because this second study is observational, we did not directly enforce any particular definition of “function” or “functional decomposition”. Others have noted that in practice, the different definitions of function are not necessarily problematic [4].
ABSTRACT This paper explores functional decomposition in early design. In the first part of this study, we explore how the three most common methods (top-down, energy-flow, enumeration) affect concept generation for novice design teams (n=25). We found that nearly all the features in the final concept could be mapped to the function diagram, though not all the functions mapped to the actual concept. This suggests that there is not much change in system functionality between these two phases, despite being separated by a few weeks. We also found that teams who used top-down and energy-flow performed nearly the same, and teams who used enumeration performed worse than those who used energy-flow. Based on these results, we recommend using either top-down or energy-flow, but not enumeration in early design. We also observed that teams used the diagramming process to reach a consensus and support team communication. The second part of this study evaluates design reports (n=78) from industry engineers taking a distance learning design course. Even though roughly half of the reports used functional decomposition, there was no correlation between using functional decomposition and final design quality as measured by various grade components. We also observed that half of the function diagrams were tree diagrams. This supports prior findings that a top-down, tree-based approach is more intuitive for engineers. Together, these results suggest that functional decomposition is helpful for team communication, but show no direct correlation with design outcome. We also recommend training strategies for teaching decomposition based on differences between the two datasets.
∗ Address
2
BACKGROUND We explore functional decomposition in design because it is reported to improve the search through the potential design space [1, 5]. Functional decomposition is a systematic method for aiding the thinking of engineering designers [6]. Function-
all correspondence to this author.
[email protected]
1
c 2015 by ASME Copyright
based thinking is important for engineers, and indeed, we find that most engineers are biased toward function over form [7]. To explore the recommended place of functional decomposition in early design, we examined two dozen engineering design books, only 15 of which mentioned any sort of activity related to functional decomposition. We further removed one book which only described functional analysis for reverse engineering, leaving 14 books (see Table 1). We then analyzed which methods these books recommended for following the functional decomposition task. We previously categorized these methods by the mode of identifying specific functions [8]. While the methods are described in more detail in our prior work [8, 9], we briefly describe them here as well. Energy-flow is when functions are identified by identifying system inputs and outputs, and then mapping changes in material, information, and energy flows into functions. Top-down is when the overall system function is determined and then subdivided into constituent functions, often coinciding with sub-assemblies and parts. Enumeration is haphazardly determining system functions with no systematic approach. We found that 79% of the text books teach a black-box approach to functional decomposition as described first by Pahl and Beitz [6]. Of these 11 that describe it, only four mention additional methods. Therefore the black-box method is by far the most common approach taught. Only two taught the top-down method [1,10]. Six out of 14 books (43%) describe enumeration, or fail to describe a method to identify functions at all. One book also describes a Subtract and Operate method, which is used for product dissection only [1], and is therefore omitted. In Table 1 we see that most authors place functional decomposition before or concurrent with concept generation. These sources also vary significantly in how they describe the process. For example, they use a wide variety of different diagrams to organize and communicate functional decompositions. We also note that only a few ideation techniques directly correspond with a function-based activity. The most common example of this is a morphology matrix [22], which depends on having a list of functions prior to the creation of the chart. The function-means tree method is a method which iterates between generating level of functions on a function tree and generating possible forms for each function [10]. Other than these two methods, most concept generation methods do not seem to be directly connected with a function-identifying activity. Research papers on functional decomposition in early design propose or discuss functional decomposition methods [18, 23– 27], develop taxonomies [28–30], propose educational interventions [31], or debate theory [32, 33], such as definitions [4, 34]. We omit from our search any papers which consider functions for mathematical modeling or methods that consider pre-existing artifacts. We only found one study that empirically tests functional decomposition in early design. This study used an energyflow method for identifying functions, and three different dia-
gram types for recording the functions. Their results suggest that using a pruned function diagram is more effective and producing concepts than a typical function diagram in terms of design outcome. However, it also found no statistical difference between using no function model and using one [35]. 3
METHODOLOGY To the best of our knowledge, no prior studies have compared multiple methods for identifying functions (energy-flow, top-down, enumeration) on concept generation. We also do not know of studies that relate the use of functional decomposition in early design to the final design outcome. Based on design texts, we assume that functional decomposition should 1) contribute to concept generation, and 2) contribute to the final design. Specifically, we wanted to ask two principle questions. • 1 - Which functional decomposition method is most effective for supporting concept generation? • 2 - Does the use of functional decomposition in early design correlate with the final design quality, as measured by grade? To answer these questions, we broke our study into two parts. For question 1, we directed several sophomore design teams embedded in a design course to use a specific functional decomposition method prior to concept generation. To answer question 2, we examined design reports submitted by professional engineers taking a distance-learning course. 3.1 Design of Experiment for Question 1 • 1 - Which functional decomposition method is most effective for supporting concept generation? In order to see how different methods contribute to concept generation, we examine how the generated functions correspond to the final concept. We expect an inferior method to have fewer details in the function tree as well as fewer functions that map to the final concept. The latter is a sign that a team wandered more before settling on a concept. To test this, we introduced three different methods for functional decomposition (energy-flow, topdown, enumeration) prior to the concept generation phase in a semester project. The course project was to design a device to improve the life of a disabled person. The study included inclass instruction, in-lab instruction and work time, and data collection. Most of these took place five weeks after the start of the semester. Because the project was conducted as a team, we measure the team output, rather than the individual output. All teams in a section received the same treatment (see Table 2). 3.1.1 Population Participants were all enrolled in ME 263, a 2nd year design class. While this is technically a convenience sample, the class is not elective for ME students, and the sample represents a little more than half the junior class at Purdue. Since the sample includes all students, the sample may be reasonably treated as random. Of participants who reported, 71 2
c 2015 by ASME Copyright
TABLE 1. Engineering design textbooks and their treatment of functional decomposition in original design tasks. * Starred processes are substeps in concept generation. Authors
Method
Wording in Text
Diagram
Subsequent Methods
Cross [11]
Black-box
Function analysis
FFBD
Set requirements, QFD, generate concepts
Enumeration
Clarifying objectives function tree
Cunniff et al. [12]
Black-box
Func. decomposition
FFBD
Find existing & generate concepts
Dieter [13]
Black-box
Func. decomposition
FFBD
Generate concepts
Dym & Little [10]
Black-box
Black & transparent boxes
Ordered FFBD
Enumeration
Enumeration of functions
List
Top-down
Function-means tree
Function-means tree
French [14]
Enumeration
Func. analysis
List
Morphological matrix
Hyman [15]
Black-box
Func. analysis
None described
QFD, plan the project, gather information, generate concepts
Magrab [16]
Enumeration
Func. decomposition / analysis
Table & Function tree
QFD, product design specification, generate concepts
Otto & Wood [1]
Black-box
Creating a function structure
FFBD
Product teardown (optional), benchmark, establish engineering specs, generate concepts
Bottom-up
Subtract & Operate method
Function tree
Enumeration
The FAST method
FAST diagram
Top-down
Function trees
Function tree
Pahl & Beitz [6]
Black-box
Func. interrelationship
FFBD
Search for principles & their combinations
Priest & S´anchez [17]
Enumeration
Func. allocation
Flowchart
Task analysis & failure modes analysis
Schmekel [18]
Top-down
Functional modeling
Network graph
Generate concepts
/
List & function tree
OBS
&
Define performance specs, determine metrics, generate concepts
Bottom-up Stoll [19]
Black-box
Func. decomposition / analysis
Blackbox & flowchart
Generate concepts
Ullman [20]
Black-box
Func. decomposition / modeling
Blackbox & flowchart
Generate concepts *
Ulrich & Eppinger [21]
Black-box
Func. decomposition
FFBD
Search externally & internally, generate functions *
out of 78 are junior level (91%). The remaining respondents are sophomores (9%). 3.2 Procedure In the in-class instruction, we covered the nature of functions, the difference between a function and behaviors, customer requirements, user actions, and other types of information. Another aspect was different diagram types that can be used. Finally, we gave several examples of functional decomposition in a design context, as well as information about how this can be
used to inform a morphological matrix. Next, we gave in-lab instructions to the different treatment groups for about 20 minutes. In this instruction, we reiterated the points discussed in lecture, and did a short practice with students on distinguishing functions from other types of information, such as user actions. We recommended a strategy for identifying functions for their project, and a diagram type for each strategy. We also recommended flow-charts for energy-flow groups, treediagrams for top-down groups, and lists for enumeration groups. 3
c 2015 by ASME Copyright
TABLE 2. The methods which were given to different labs, in order. The labs where there were missing data are also indicated Lab
Treatment
n = 40
1
Enumeration
5 groups
2
Top-down
6 groups
3
Energy-flow
6 groups
4
Enumeration
5 groups
5
Top-down
6 groups
6
Energy-flow (data not complete)
6 groups
7
Enumeration (data not complete)
6 groups
• Unmapped function ratio - the ratio of unmapped functions divided by the total number of functions • Unmapped high-level function ratio - the ratio of 2nd level functions that are not mapped divided by the total number of 2nd level functions. • Unmapped feature ratio (Feat. Ratio) - the number of unmapped features divided by the total number of features. 3.4
Hypotheses To test our data, we structured our expectations into hypotheses that could be tested with statistics. We expected the topdown method to perform the best, and the energy-flow method to perform the worst due to the need to think at a level of detail that is not decided yet. We generalized these expectations as follows: • H0 - There is no difference between any of the methods as measured by the ratio of unmapped functions to total functions, the ratio of unmapped high-level functions to highlevel functions, and the ratio of unmapped features to total features, as well as other metrics, including the number of functions (all metrics defined below). • H1a - The energy-flow approach is different from top-down • H1b - The energy-flow approach is different from enumeration • H1c - The top-down approach is different from enumeration
We provided a list of function verbs from the pruned functional basis [30], but did not enforce using these words. Teams worked on their functional decomposition diagram during lab time with help from the instructors, but with no help from the researchers. Immediately after this lab session, we distributed voluntary surveys that would be turned in to lab coordinators the next session. Since surveys were voluntary, we could not group responses by team, so these are considered separately. Finally, we collected copies of the homework assignment where student teams submitted their function tree. A few weeks later, we collected the concept chosen by each team from their lab reports. These excerpts were provided by the lab instructors.
3.5
Pre-Analysis Labs 6 and 7 did not submit the data for the final concept, so we can only compare their function trees with other sections. Consequently, the energy-flow group may have too few participants to make firm conclusions about that method. Furthermore, to ensure that students used the methods we provided, we asked them if they made any modifications to the method. Most teams reported not deviating from the given method. One team reported using the top-down method instead of energy-flow. Another team reported creating function diagrams as individuals and then combining their efforts into a team diagram. One team noted “after we created our list, we needed not a giant list. We needed a lot of interation [sic].” For the one team that reported using top-down instead of energy-flow, we grouped their data with the top-down pool. The statistical conditions for ANOVA were met, except the number of high-level unmapped functions which had a skew right distribution, which would potentially lead to a false positive for this variable [37].
3.3
Metrics Before analyzing the data, we hypothesized that certain methods would affect concept generation more directly. To measure this, we devised metrics that would assess the “connectivity” between the functional decomposition and the final concept chosen, where greater connectivity indicates less wandering through the concept generation process. We could not assess other concepts since these are not included in the report excerpts provided by the instructors. The metrics include the following: • Number of functions [8, 36] • Number of features demonstrated in the final concept sketch and description • Number of unmapped functions - the number of functions that do not translate into features in the final concept. • Number of unmapped features - the number of features that are not derived from functions in the function diagram • High-level unmapped functions - the number of functions on the 2nd level or equivalent in the function diagram that do not translate to the final concept
3.5.1 Analysis of Data for Question 1 We conducted an ANOVA statistical analysis (alpha = 0.05, n = 25) to determine which methods performed better than others. The number of functions (p = 0.037), the number of features (p = 0.027), the number of unmapped features (p = 0.003), and the ratio of unmapped features to total features (p = 0.001) were all significant. All other metrics were not significant.
A number of composite metrics were also calculated. The purpose of these metrics is to normalize the response, in case outliers skewed the results. 4
c 2015 by ASME Copyright
TABLE 3. Grouping Information Using Tukey Method and 95.0% Confidence for Significant Variables (Means that do not share a letter are significantly different No. of Functions (p = 0.037) N Mean Grouping Enumeration 11 15.1 Energy-Flow 13 16.3 Top-Down 16 19.7
No. of Features (p = 0.027) N Mean Grouping Energy-Flow 4 8.8 Top-Down 12 7.4 Enumeration 9 5.0
Unmapped Features (p = 0.003) N Mean Grouping Energy-Flow 4 1.3 Enumeration 9 0.2 Top-Down 12 0.0
Unmapped Feature Rate (p = 0.001)
agreement on the direction of the design. Our in-class observations since this study have also suggested this. 3.6 Design of Experiment for Question 2 • 2 - Does the use of functional decomposition in early design correlate with the final design quality? To answer the second question, we obtained design project reports from industry engineers enrolled in an on-line graduate level design course taught at Purdue. We used the report to see if 1) functional decomposition was used and 2) if using functional decomposition affected any of the grade components for the project. The report was a class assignment to design an extreme low-cost clothes washing device for developing countries. Each project was completed individually. They were instructed to use any methods they wished. A short list of methods were provided to give examples, but the listed methods were not required. This list included functional decomposition. We assume that the use of functional decomposition is the result of prior education or using examples found in lecture slides. The reports were graded in six areas: the development of customer requirements (15 points); demonstration of ability to inspire and develop potential concepts (15 points); the use of visual thinking (10 points); feasibility of the final design (40 points); effectiveness in communicating ideas, concepts, and strategies (10 points); and presentation and organization (10 points). These grades were summed into a final, overall grade (100 points). Each report was graded by at least two instructors, and these separate scores were normalized, then averaged. In the rubric given to graders, functional decomposition was given as an example method for the second point: the inspiration and development of potential concepts. We also consider the other points of the rubric, especially the feasibility of the final design, because the of the potential effect that functional decomposition may have on these points.
N Mean Grouping Energy-Flow 4 0.1 Enumeration 9 0.0 Top-Down 12 0.0
We then used a Tukey comparison to see how much each method was different (see Table 3). We found that groups who used top-down generated more functions than enumeration, but energy-flow was not distinguishable from these two. Groups who used the energy-flow method were more likely depict to more features in their final concept than enumeration, but top-down was indistinguishable from these. This pattern persists in the normalized feature rate metric. However, it is questionable if the addition of new features is meaningful, since on average, each energy-flow group only added 1.3 new features to their design. Together, this shows that the enumeration method is less effective at generating functions, and leads to less detail in concept generation. The energy-flow method may lead to more detailed concepts, and the top-down method may lead to more detailed function trees. However, the distinction between top-down and energy-flow is tenuous. Overall, functions generated during functional decomposition generally persist into the final concept, at least for novices. This corresponds with prior findings that for novices, the mental model of the system does not mature until after the modeling stage [38]. The functions expressed by the groups may also represent the boundaries of the design space they searched during concept generation. Our survey data supports the idea of a bounded design space. When we asked students what they thought functional decomposition might be most useful for, they reported “to figure out what we need to do” or “idea generation”. Our other survey was very similar to what we have previously reported [8], so we will not report the remainder of the surveys. While teams generated function diagrams, we observed that there was a great deal of discussion among team members. Paired with the evidence that the system functions do not change significantly between defining the functions and selecting the final concept, this probably means that the teams were using the diagram to coordinate ideas and ensure that all members were in
3.6.1 Population The subjects who created the reports were all off-campus, remote students enrolled in ME 553 for professional development. The engineers come from a variety of different industries, including industrial machinery, consumer products, telecommunications, aviation and military, medical, and automotive. More details are not provided to ensure the anonymity of the subjects and their respective companies. All subjects held bachelors degrees, and some held masters degrees. 3.7
Procedure and Metrics We examined each report for any indication of functional decomposition being used. A diagram or table was considered to be a function diagram if the engineer labeled it with any form of the word “function” and/or the majority of the diagram contained functions. We used a binary metric to indicate if a report used functional decomposition or not. We then categorized the diagrams based on their structure (described below). Other data 5
c 2015 by ASME Copyright
• Tables - Lists of functions, but tabulated with other types of information, such as parts, design requirements, etc.
we collected included the number of functions represented, the overall grade for the report, and the grade for each part of the rubric. We also rated the quality of each diagram based on the clarity, detail, and adherence to syntax and diagram structuring rules found in design texts. The quality of each diagram was analyzed as “low”, “medium”, or “high” based on first impression, with an inter-rater reliability of 75%. We also measured the rate of syntax errors. A syntax error is when a phrase in a function diagram does not begin with a verb. ”Motor” or ”Does not turn off” are example of syntax errors when included in a function diagram. A detailed description of syntax errors can be found in our prior work [8]. To distinguish between diagrams, we categorized them 15 groups based on their structure, content, and graphical directionality. Originally, we had a smaller number of diagram types, but we expanded our list when we found diagrams that did not fit our classification scheme. We then grouped these diagram types into five meta-groups, based on shared structural characteristics.
◦ Table - functions listed in a table, often paired with other types of information ◦ BOM table - a chart labeled as a function diagram that consists of a bill of materials with a column specifying the relevant function ◦ Unordered Overall/Basic/Secondary (Unordered OBS) - functions listed in a table but are also ranked by importance with ”overall”, ”basic”, and ”secondary”. ◦ BOM/OBS table - an unordered OBS table that also has parts paired with functions • No-organization diagrams ◦ List - no relationships between functions are shown. ◦ Free-form - no attempt at grouping the functions onto a single diagram is made, but each instance is clearly labeled as a function.
• Hierarchy diagrams - These diagrams have a single top-level function, which is branched to lower-level functions, which may also have lower levels. There is no directionality indicated between the nodes (i.e. it is not a flow chart). ◦ ◦ ◦ ◦
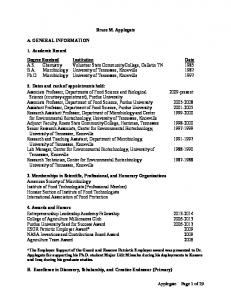
3.7.1 Results for Question 2 Out of the design reports (n = 78), 51% of the industry engineers used some form of functional decomposition in their design. There is no correlation between grade and using functional decomposition (0.075, p = 0.515). The same holds true for each of the rubric subcategories. While not a primary purpose for this paper, we also checked if reports included morphological matrices. The purpose for this test is to see if another method can have predictive value for the final grade. We found that using this method weakly correlates with the final grade (0.233, p = 0.040) and the grade for demonstration of ideation (0.293, p = 0.009). We also observed a weak correlation between the number of syntax errors and the grade for identifying user needs (0.222, p = 0.050). The syntax errors is an approximate measure for whether a phrase in the diagram is a function or not [9]. We observed many diagrams included non-functions such as customer requirements. Therefore, it make sense that we would see a correlation between the identification of needs and the recording of these needs in function diagrams. We also observe a weak negative correlation (-0.247, p = 0.029) between the number of syntax errors and the use of a morphological matrix. This indicates that the more non-functions used, the less likely that an engineer was to use a morphological matrix The frequency of different types of diagrams is shown in Figure 1. Energy-flow or time-flow based diagrams are by far the least common method. The engineers who used these diagrams usually also drew a p-diagram. The greatest plurality of diagrams 34.6% were hierarchy type diagrams, such as function trees, mind maps, or ordered OBS. A traditional function tree was the most common of these, accounting for 29.27% of the total diagrams. This may indicate that hierarchy diagrams are the most intuitive and energy-flow the least intuitive. Alternately,
Tree - A traditional hierarchy diagram Outline - A list with markers and indentations. Mind-map - A circular hierarchy chart. Ordered Overall/Basic/Secondary diagram (Ordered OBS) - three separate hierarchy diagrams, with an explicit rank order between them
• Network-type diagrams - These diagrams have no single top-level function, and any node may connect with any other node. Directionality is not indicated (i.e. not a flow-chart) ◦ Network - Nodes are interconnected with no clear parent function. Other types of information are not present. ◦ Hybrid Table - functions are explicitly paired with other types of information. Each type of information is ordered in a row or column and connections are drawn between each relevant connection. ◦ Hybrid Network - functions are explicitly paired with different data types, but have no explicit organizational structure • Flow diagrams - These diagrams may have any form but have a clear direction or flow between nodes. ◦ Black box - flowchart that explicitly shows energy, material, and/or information flows ◦ Flowchart - shows time flow through blocks ◦ Flowchart, Branched - shows time flow, but also has branches that do not merge later 6
c 2015 by ASME Copyright
4
% of Total Diagrams
Tabulated, Mixed, 9 (22%)
From the results from the first study, it seems that in general, energy-flow and top-down approaches are identical in supporting concept generation. Energy-flow groups did have features in their final concept that weren’t derived from the function tree, but on average this was 1.3 per group, which does not seem practically significant. On the other hand, the enumeration approach yields the fewest functions and the least detailed concepts. On the basis of these results, we would recommend not using an enumeration approach for early design. The systematic methods seem to be more effective at supporting concept generation. In addition to this, we see that in general, the functions described in the diagrams persisted to the final concept. Because we did not examine earlier or later stages, we cannot be certain what this means. One interpretation could be that the functional decomposition task may define the design space [5], and the concept generation task only explores in this design space afterward. This would fit the description found in most design texts (Table 1) and affirm the idea that functions are independent of form [3]. We considered two alternate possibilities to this. One alternative is that the scope and general functionality of the design is decided even before the functional decomposition task, and the lack of change is a form of fixation. There have been studies to see if product dissection can reduce fixation in a later design task [39], but none have been done to see if functional decomposition for a new design reduces fixation or not. The persistence of functions may also indicate that the mental model of system functionality does not develop much between functional decomposition and concept generation. This result begs a different question: which design phase has the largest impact on the mental model of system functionality? This question also came up as a part of the second set of results, so this is discussed more below.
Flows, 6 (15%) No Org., 3 (7%) Networks, 5 (12%)
Hierarchy, 18 (44%)
FIGURE 1. ports
Percentages of various diagrams types found in the re-
TABLE 4. Significance of main effects on several response variables from the independent and covariate factors
# Reports w/ Function Diagrams
51.3%
# Reports w/o Function Diagrams
48.7%
# Low Quality
51.2%
# Med-Low
12.2%
# Medium
12.2%
# Med-High
14.6%
# High Quality
9.76%
Avg. # of Functions
14.4
Std. Dv. # of Functions
9.00
Avg. # Syntax Errors
5.88
Std. Dv. # Syntax Errors
6.00
DISCUSSION OF RESULTS • 1 - Which functional decomposition method is most effective for supporting concept generation?
• 2 - Does the use of functional decomposition in early design correlate with the final design quality, as measured by grade? The data shows that roughly half (51%) of our sample engineers used functional decomposition for this project. However, there was no correlation between any grade component and using functional decomposition, suggesting that it did not affect design outcome. A prior study also found no difference between the energy-flow method and no method at all [35], though the authors did not comment on this point in their conclusions. A weak correlation exists between the grade and those who used morphological matrices, reinforcing our result. One possible explanation is that the engineers did not use the method correctly [32]. We saw that the function trees were rather poor quality (51% of function diagrams). This seems to also be reflected in the correlation between syntax errors and the grade
this could indicate ease-of-use, or educational background (i.e. some methods are taught more often to undergraduates than others). In addition to the diagram types, a majority of functional decompositions (51%) were very low quality. The average number of functions was 14.4, with a standard deviation of 9. The average number of syntax errors was 5.88, with a standard deviation of 6. Other results can be seen in Table 4. 7
c 2015 by ASME Copyright
for identifying needs. Syntax errors indicate when an engineer uses a type of information that is not a function [9]. Together, these may indicate that many engineers are using decomposition for information other than functions. A related explanation is that functional decomposition may serve to define customer needs more than to define a potential problem space. Our survey data from the first part of this paper supports this idea. The Dym and Little book pairs functional decomposition with requirements trees [10]. It is possible that this method has been misclassified as a concept generation tool, and instead is a problem definition tool. Another explanation is that other methods have a greater impact on developing the final functions in the system. Other studies have found that prototyping has a large effect on the mental models of system function [40]. A review of design studies also found that novice engineers often do not develop an understanding of system behavior until the modeling phase [38]. The first set of data also could imply this. If this perspective is true, it would imply that functional decomposition primarily serves a team communication or idea organization purpose.
There are some limitations to this study. The sample size for the first portion of the study was smaller than desired. Additionally, the data was only focused on two design phases: decomposition and ideation. Our data did not include other design phases, and therefore cannot comment on the development of system functions over the design process. In light of this, we recommend deeper study into how mental model of function develops over the design process, and investigation into which design phases cause the most change. This information would be valuable in determining which phases should be emphasized in early design. It may also lead to insight on possible methods for mitigating fixation. ACKNOWLEDGMENT The authors would like to thank Dr. Dave Anderson, the instructors of ME 263, William Bernstein, and Senthil Chandrasegaran for their cooperation and help in obtaining data and feedback on the draft.
REFERENCES [1] Otto, K., and Wood, K., 2001. Product Design: Techniques in Reverse Engineering and New Product Development. Prentice Hall, Upper Saddle River, NJ. [2] Litchfield, R., Fan, J., and Brown, V., 2011. “Directing idea generation using brainstorming with specific novelty goals”. Motivation and Emotion, 35, pp. 135–143. [3] Eckert, C., Alink, T., Ruckpaul, A., and Albers, A., 2011. “Different notions of function: Results from an experiment on the analysis of an existing product”. J Eng Design, 22(11-12), pp. 811–837. [4] Vermaas, P. E., 2013. “The coexistence of engineering meanings of function: Four responses and their methodological implications”. AIEDAM, 27(8), pp. 191–202. [5] Jansson, D. G., and Smith, S. M., 1991. “Design fixation”. Des. Stud., 12(1), pp. 3 – 11. [6] Pahl, G., and Beitz, W., 1996. Engineering Design: A Systematic Approach. Springer, New York. [7] Sangelkar, S., and McAdams, D. A., 2010. “Adapting ada architectural design knowledge for universal product design using association rule mining: A function based approach”. In Proceedings of ASME IDETC. [8] Booth, J. W., Reid, T. N., Eckert, C., and Ramani, K., 2015. “Comparing functional analysis methods for product dissection tasks”. ASME J Mech Design, In Print. [9] Booth, J. W., Bhasin, A. K., Reid, T. N., and Ramani, K., 2014. “Evaluating the bottom-up method for functional decomposition in product dissection tasks”. In Proceedings of ASME IDETC, no. 35393. [10] Dym, C. L., and Little, P., 2000. Engineering Design: A Project-Based Introduction. John Wiley & Sons, USA.
5
CONCLUSIONS AND FUTURE WORK In conclusion, functional decomposition probably contributes more to team communication than design outcome. When individual, professional designers used it, it showed no direct correlation with design outcome. However, we observed that when student teams used it, they used it to discuss ideas and ensure that they had reached a consensus on the direction of the design. We also found that among student teams, those who used top-down or energy-flow approaches had more detailed function diagrams, indicating that systematic methods have a greater impact on the designer’s mental model of system functions. Based on these results, we recommend that if a design team chooses to use functional decomposition prior to concept generation, they use top-down or energy-flow methods instead of enumeration. We also hypothesize that the importance of functional decomposition increases with the complexity of a product or system. We also saw that the novice designers in the first study had a much lower syntax error rate than the professional designers. We were able to train the novice designers, but not the expert engineers. Our training program emphasized the difference between functions and other information types, such as features or user actions. Based on these results, we recommend adding to existing training programs [41] by increasing the emphasis on distinctions between information types. Our second set of data also indicates that function trees are more popular among engineers. While this could be due to what they were taught, it may also be that this type of diagram is more intuitive [36]. From a pedagogical point of view, this may also mean that function trees are a good starting point for teaching functional decomposition [1]. 8
c 2015 by ASME Copyright
[11] Cross, N., 2000. Engineering Design Methods. John Wiley & Sons, New York. [12] Cunniff, P. F., Herrmann, J. W., Schmidt, L. C., Zhang, G., and Dally, J. W., 1998. Product Engineering and Manufacturing. College House Enterprises, LLC, New York, ch. Chapter 5: Functional Decomposition, pp. 81–93. [13] Dieter, G. E., 2000. Engineering Design: A Materials and Processing Approach. McGraw-Hill, New York. [14] French, M., 1999. Conceptual Design for Engineers. Springer, New York. [15] Hyman, B., 2003. Fundamentals of Engineering Design. Prentice Hall. [16] Magrab, E. B., 1997. Integrated Product and Process Design and Development: The Product Realization process. CRC Press, New York. [17] Priest, J. W., and Snchez, J. M., 2001. Product Development and Design for Manufacturing: A Collaborative Approach to Productibility and Reliability, 2nd ed. Marcel Dekker, Inc., New York. [18] Schmekel, H., and Sohlenius, G., 1989. “Functional models and design solutions”. Annals of the CIRP, 38(1), pp. 129– 133. [19] Stoll, H. W., 1999. Product Design Methods and Practices. Marcel Dekker, Inc., New York. [20] Ullman, D. G., 2003. The Mechanical Design Process, 4 ed. McGraw-Hill, New York. [21] Ulrich, K. T., and Eppinger, S. D., 2000. Product Design and Development. McGraw-Hill, New York. [22] Dieter, G. E., and Schmidt, L. C., 2009. Engineering Design. McGraw-Hill, New York. [23] Chakrabarti, A., and Bligh, T. P., 1996. “An approach to functional synthesis of mechanical design concepts: Theory, applications, and emerging research issues”. AIEDAM, 10, pp. 313–331. [24] Umeda, Y., and Tomiyama, T., 1997. “Functional reasoning in design”. pp. 42–48. [25] Nagel, J. K. S., Nagel, R. L., Stone, R. B., and McAdams, D. A., 2010. “Function-based, biologically inspired concept generation”. AIEDAM, 24, pp. 521–535. [26] van Eck, D., 2011. “Supporting design knowledge exchange by converting models of functional decomposition”. J Eng Design, 22(11-12), Dec, pp. 839–858. [27] Aurisicchio, M., Bracewell, R., and Armstrong, G., 2013. “The function analysis diagram: Intended benefits and coexistence with other functional models”. AIEDAM, 27, 8, pp. 249–257. [28] Stone, and Wood, 2000. “Development of a functional basis for design”. ASME J Mech Design, 122, pp. 359–370. [29] Hirtz, J., Stone, R., McAdams, D., Szykman, S., and Wood, K., 2002. “A functional basis for engineering design: Reconciling and evolving previous efforts”. Res. Eng. Design, 13, pp. 65–82.
[30] Caldwell, B. W., Thomas, J. E., Sen, C., Mocko, G. M., and Summers, J. D., 2012. “The effects of language and pruning on function structure interpretability”. ASME J Mech Design, 134, pp. 1–11. [31] Bohm, M., Shirley, M., and Nagel, R., 2012. “A tablet based application for teaching function and exploring concept alternatives during early design”. In Proceedings of ASME IDETC. [32] Tomiyama, T., van Beek, T. J., Alvarez Cabrera, A. A., Komoto, H., and D’Amelio, V., 2013. “Making function modeling practically usable”. AIEDAM, 27, 8, pp. 301–309. [33] Eckert, C., 2013. “That which is not form: The practical challenges in using functional concepts in design”. AIEDAM, 27, Aug., pp. 217–231. [34] Chakrabarti, A., Srinivasan, V., Ranjan, B., and Lindemann, U., 2013. “A case for multiple views of function in design based on a common definition”. AIEDAM, 27, 8, pp. 271–279. [35] Caldwell, B. W., Ramachandran, R., and Mocko, G. M., 2012. “Assessing the use of function models and interaction models through concept sketching”. In Proceedings of ASME IDETC, no. 71374. [36] Eckert, C., Ruckpaul, A., Alink, T., and Albers, A., 2012. “Variations in functional decomposition for an exisiting product: Experimental results”. AIEDAM, 26, pp. 107–128. [37] Keselman, H. J., Huberty, C. J., Lix, L. M., Olejnik, S., Cribbie, R. A., Donahue, B., Kowalchuk, R. K., Lowman, L. L., Petoskey, M. D., Keselman, J. C., and Levin, J. R., 1998. “Statistical practices of educational researchers: An analysis of their ANOVA, MANOVA and ANCOVA analyses”. Review of Educational Research, 68(3), Fall, pp. 350– 386. [38] Crismond, D. P., and Adams, R. S., 2012. “The informed design teaching and learning matrix”. J Eng Edu, 101(4), pp. 738–797. [39] Toh, C., Miller, S., , and Kremer, G., 2012. “Mitigating design fixation effects in engineering design through product dissection activities”. In Proceedings of DCC. [40] Viswanathan, V. K., and Linsey, J. S., 2012. “Physical models and design thinking: A study of functionality, novelty and variety of ideas”. ASME J Mech Design, 134(9). [41] Nagel, R. L., Bohm, M., and Linsey, J., 2013. “An investigation into the effectiveness of an algorithmic approach to teaching functional modeling”. In Proceedings of ASME IDETC, no. 12658.
9
c 2015 by ASME Copyright