World Journal of Microbiology & Biotechnology 14, 571±578
Functional diversity and community structure of microorganisms in uncontaminated and creosote-contaminated soils as determined by sole-carbon-source-utilization A.M. Derry, W.J. Staddon and J.T. Trevors* Functional diversities of microorganisms from uncontaminated and creosote-contaminated soils were assessed using sole-carbon source-utilization patterns. The microorganisms were extracted from soil samples and inoculated into Gram-negative Biolog plates incubated at 23 °C. Measurement of Shannon diversity, richness, and evenness indices, principal component analysis (PCA), and colour development rank (CDR) plots were based upon substrate utilization. Calculations incorporated data from both the 95 regular Gram-negative Biolog microplate wells and a selection of 23 carbon substrates that are included on Biolog Ecoplates. There did not appear to be signi®cant differences in Shannon diversity and richness indices, PCA, or CDR plots between uncontaminated and creosotecontaminated soils. Signi®cant differences in Shannon diversity and evenness indices that were apparent with the use of the 23 ecologically relevant microplate wells were mostly absent based on calculations that incorporated the regular 95 Gram-negative Biolog microplate wells. Resolution of microbial communities by PCA, however, appeared to be reduced by the use of the 23 Biolog microplate wells compared to the regular 95 carbon sources. Key words: Biodiversity, community, contamination, creosote, microorganisms, soil. Biodiversity is thought to support life as we know it and currently has the attention of many scientists (Shulze & Mooney 1993; United Nations Environment Program 1995). Studies on biodiversity have often placed an emphasis on macroorganisms (Ricklef & Shluter 1993). However, there is an increasing recognition of essential ecosystem functions ful®lled by microorganisms (Hawksworth & Colwell 1992; Torsvik et al. 1989; Zak et al. 1994; Wunsche et al. 1995; Staddon et al. 1996; Borneman & Triplett 1997; Fuller et al. 1997). Microorganisms are involved with biogeochemical cycling, and with decomposition of plant and animal matter and pollutants in aquatic and soil environments (Atlas & Bartha 1993; Meyer 1993). Consequently, changes in the structure or function of microbial communities may have an impact on ecosystem activities (Beare et al. 1992; Couteaux et al. 1995).
The authors are with the Department of Environmental Biology, University of Guelph, Guelph, Ontario, N1G 2W1 Canada; Fax: (+1) 519 837 0442. J.T. Trevors is the supervisor of the Laboratory of Microbial Technology. E-mail:
[email protected] *Corresponding author.
Sole-carbon-source-utilization (SCSU) patterns of microbial samples have been produced using Gram-negative (GN) Biolog microplates (Biolog Inc., 3938 Trust Way, Hayward. CA 94545, USA) to estimate community structure using the Shannon diversity index (Zak et al. 1994; Fuller et al. 1997; Staddon et al. 1997, 1998), substrate utilization richness and evenness (Zak et al. 1994, Staddon et al. 1997, 1998), principal component analysis (PCA) (Garland & Mills 1991; Haack et al. 1995; Fuller et al. 1997; Staddon et al. 1997, 1998), and colour development rank (CDR) plots (Staddon et al. 1998). SCSU is an advantageous technique because it is rapid and inexpensive, and provides data to assess similarities and differences between microbial communities (Garland & Mills 1991; Zak et al. 1994; Staddon et al. 1996, 1997, 1998). For a comprehensive series of recent manuscripts, the reader is referred to a special issue of the Journal of Microbiological Methods, Vol. 30, No. 1 (1997) on substrate use for characterization of microbial communities in terrestrial ecosystems. It is possible that in cases of toxic environmental pollution there is a decline in the species diversity of
ã 1998 Rapid Science Publishers World Journal of Microbiology & Biotechnology, Vol 14, 1998
571
A.M. Derry et al. microorganisms (Atlas 1984). Prokaryotic organisms are known to behave differently from communities of higher organisms in terms of transfer of genetic material (e.g. by conjugation, transduction or transformation), rapid generation times, and adaptation to harsh environments (Brock et al. 1994). Few studies have examined the impact of toxic contaminants on functional soil microbial diversity (Fuller et al. 1997). This study was completed to determine if differences exist in microbial functional diversity and community structure between soils contaminated with creosote and uncontaminated soils. We also tested whether the use of a reduced set of ecologically relevant Biolog carbon substrates gave greater resolution power of microbial communities than the standard 95 carbon sources present in GN Biolog plates (Hitzl et al. 1997) in terms of Shannon diversity, richness, and evenness, PCA, and CDR plots.
Materials and Methods Soil Preparation and Analysis Five soils with no previous history of chemical contamination, from different locations in southern Ontario, Canada, were provided by Grace Bioremediation Technologies (Mississauga, Ontario, Canada). There were designated Guelph, Cambridge, Halton beach sand, Halton clay, and Mississauga soil. Each soil was passed through a 4.75 mm seive (No. 4 mesh, USA Standard Testing Sieve), mixed thoroughly, and stored in sealed containers at 4 °C in the dark. Analyses of soil texture, PAHs (Table 1), pH, and nutrient levels (P, N, K, Mg) (Table 2) were performed by Analytical Services (Land Resource Sciences, University of Guelph, Guelph, Ontario, N1G 2W1, Canada). Four historically contaminated soils, from different locations in Canada, were also provided by Grace Bioremediation Technologies. These soil samples were collected from the surface (top 10 cm), shipped to the University of Guelph, and stored at 4 °C in the dark. The contaminated soils were designated as NB, TI, QD, and AC.
Table 1. Uncontaminated and creosote-contaminated soils used for determination of functional microbial diversity: textures and PAH concentrations. Description
Soil texture (sand/silt/clay)
Uncontaminated soils Guelph Cambridge Halton beach sand Halton clay Mississauga Creosote-contaminated soils NB TI QD AC
39, 75, 98, 41, 25,
48, 13 18, 7 1, 1 42, 17 43, 32
75, 16, 9 76, 21, 3 99.5, 0.5, 0 61, 24, 15
Total PAHs (mg/kg)* ± ± 0.63 ± ± 174 1224 2305 852
* ±, Not present.
Extraction of Microbial Cells from Soil Samples Three 15 g subsamples of soil were removed from each individual soil. The samples were used for extraction of cells. Each 15 g sample was suspended in 25.0 ml sterile 0.1% (w/v) sodium pyrophosphate (adjusted to pH 7.0) with 4 g sterile glass beads (3 mm diameter) in a sterile 125 ml stoppered ¯ask. Flasks containing the soil solutions were shaken for 1 h at 140 rev/min on a rotary shaker at room temperature. The suspension from each ¯ask was decanted into a sterile 250 ml centrifuge bottle and centrifuged (680 ´ g for 10 min at 4 °C). Ten ml of supernatant were removed and placed into a sterile 40 ml centrifuge tube. Ten ml of sterile 0.1% (w/v) sodium pyrophosphate (pH 7.0) were pipetted into the 250 ml centrifuge bottle, which was shaken for 1 h at 140 rev/min. This was followed by centrifugation at 680 ´ g for 10 min at 4 °C. Removal of the supernatant containing the cells and centrifugation were repeated twice. The result was 30 ml of pooled supernatant containing the extracted microbial cells and contaminating extraneous carbon sources in the 40 ml centrifuge bottle, which was then centrifuged at 680 ´ g for 10 min at 4 °C. The pooled supernatant ¯uid was transferred to a second sterile 40 ml centrifuge tube that was
Table 2. Uncontaminated and creosote-contaminated soils used for determination of functional microbial diversity: total carbon, nitrogen, phosphorus, potassium, magnesium contents, and pH. Description Uncontaminated soils Guelph Cambridge Halton beach sand Halton clay Mississauga Creosote-contaminated soils NB TI QD AC
572
Total C (% w/w)
Total N (% w/w)
P (% w/w)
K (mg/kg)
Mg (mg/kg)
pH
2.71 1.42 1.57 1.99 2.92
0.23 0.05 < 0.01 0.02 0.16
28 6 6 9 7
99.2 60.6 64.8 61.3 150.5
459 81 36 232 384
7.5 7.8 8.3 7.8 7.9
6.04 8.44 2.63 7.31
0.13 < 0.01 < 0.01 0.12
7 4 2 6
89.9 25.8 14.6 129.8
64 47 8 335
6.5 8.1 6.6 7.5
World Journal of Microbiology & Biotechnology, Vol 14, 1998
Microbial diversity in contaminated soils centrifuged at 8000 ´ g for 10 min. The resulting pellet contained the extracted microorganisms. The supernatant was replaced with 30 ml of sterile, double-distilled water and the microbial cells were washed and centrifuged (8000 ´ g for 10 min at 4 °C). This latter step was performed twice. The pellet of microbial cells was resuspended in 30 ml of sterile 0.85% (w/v) NaCl, vortexed, and decanted into a sterile, capped test tube. Absorbances of supernatant samples were measured at 600 nm using a Spectronic 20 spectrophotometer and 0.85% (w/v) NaCl as the blank. Turbidities of extracts were adjusted to an equivalent inoculum density (87% transmittance). The contents of each tube were used to inoculate three Gram-negative Biolog plates via a multipipette with 100 ll per well. Each Biolog plate contains 96 wells, each with a different carbon source with the exception of the reference well. If the carbon source is metabolized, a purple colour is produced from reduction of tetrazolium violet dye which absorbs light at 595 nm (Garland & Mills 1991). The three Biolog plates were incubated at 23 °C for 10 days. Biolog plates were scanned every 24 h at 595 nm using an EL 312E Biokinetics Reader (Biotek Instruments, Mandel Scienti®c, Guelph, Ontario, Canada) for 10 days after inoculation. (Haack et al. 1995; Staddon et al. 1997a). Data Analysis Data from day 6 was used for analysis. Day 6 was selected at 23 °C in recognition of slower microbial metabolism based on results from other studies using the Biolog technique at 30 °C for environmental samples (Zak et al. 1994; Derry et al. 1997; Staddon et al. 1997a). Data analysis was based on both the 95 carbon substrates present in GN Biolog plates and the 23 carbon sources shared by both GN Biolog plates and Biolog Ecoplates. The carbon sources present on GN Biolog plates corresponding to substrates on Biolog Ecoplates are the following: a-cyclodextrin, glycogen, Tween 40, Tween 80, N-acetyl-D-glucosamine, 1-erythritol, D-mannitol, b-methyl-D-glucoside, D-galactonic acid lactone, D-galacturonic acid, D-glucosaminic acid, b-hydroxybutyric acid, itaconic acid, a-ketobutyric acid, L-asparagine, glycyl-Lglutamic acid, L-phenylalanine, L-serine, L-threonine, phenylethylamine, putrescine, D, L-a-glycerol phosphate, glucose-1phosphate. The latter step was performed in recognition of greater separation power of functional similarities and dissimilarities among microbial communities associated with particular
ecologically relevant carbon substrates (Hitzl et al. 1997). Information regarding these carbon sources was supplied by Biolog Inc. (3938 Trust Way, Hayward. CA 94545, USA). The Shannon index for diversity, richness (number of positive wells on Biolog plate), and evenness were calculated for each soil sample using the formulae provided in Table 3 (Staddon et al. 1997). PCA was performed on data divided by average well colour development (AWCD) as described by Garland & Mills (1991). Colour development rank (CDR) plots were constructed for each soil sample using the formula provided by Staddon (1998) (Table 3). Instat (Graphpad Software v. 2.059, 10855 Sorrento Valley Rd, San Diego, California 92121, USA) and Sigmastat (Sigmaplot, Jandel Scienti®c, San Rafael, C.A., 94912-7005, USA) were used to conduct statistical analyses. Diversity, richness, and evenness were compared by either ANOVA followed by Tukey's test or the Kruskal±Wallis one way analysis of variance on ranks followed by Dunn's multiple comparison test (Glantz 1992).
Results Based on 95 GN Biolog Microplate Carbon Substrates ± Shannon Diversity, Richness, and Evenness There was a signi®cant difference between Shannon indices of diversity for uncontaminated Halton beach sand and creosote-contaminated AC soil based on carbon substrate utilization in GN Biolog plates (P < 0.05; Dunn's test) (Table 4). Polluted AC soil also had a signi®cantly higher measure of carbon source utilization richness (95 0.00) than unpolluted Halton beach sand (67 6.429) (P < 0.05; Dunn's test) (Table 4). The Shannon evenness values ranged from 0.858 in Halton beach sand to 0.958 in TI soil (Table 4). This set of evenness data did not reveal signi®cant differences between any soils when tested using the nonparametric Dunn's multiple comparison test.
Table 3. Formulae for calculations. Index Shannon
De®nition 1;2
Measure of richness and evenness
Formulae P H0 ÿ pi ln pI H0 C/N
N ln N ÿ
De®nitions
P
ni ln ni
Shannon Evenness1
Evenness calculated from Shannon Index
E H0 =ln S
Colour Development Rank Plots3 (Figures 2,4)
To indicate whether functional microbial community distribution is geometric, log series or log normal according to Biolog substrate utilization patterns
% total colour development ni /sum of total colour development on Biolog plate plotted versus well rank (ranked in descending order)
pi proportional colour development of the ith well over total colour development of all wells of a plate N sum of optical densities of a Biolog plate ni optical density of a well on a Biolog plate C 2:3 H0 Shannon index of diversity S number of wells with colour development (substrate utilization richness) ni colour development within an individual Biolog microplate well
1. Staddon et al. 1997; 2. Zak et al. 1994; 3. Staddon et al. 1998.
World Journal of Microbiology & Biotechnology, Vol 14, 1998
573
A.M. Derry et al. Table 4. Means and standard deviations (n 3) for Shannon indices of functional diversity and measures of Shannon richness and evenness of carbon source utilization in uncontaminated and creosote-contaminated soils after 6 days incubation at 23 °C using both a set of 95 Biolog microplate wells and a set of 23 Biolog microplate wells that correspond to substrates on Biolog Ecoplates. (See Table 5 for Shannon evenness measures using the 23 ecologically relevant carbon sources). Soil samples
Uncontaminated soils Guelph soil Cambridge soil Halton beach sand Halton clay soil Mississauga soil Creosote-contaminated soils NB soil TI soil QD soil AC soil
Shannon diversity indices (95 Biolog microplate wells)
Carbon source utilization richness (95 Biolog microplate wells)
Shannon evenness (95 Biolog microplate wells)
Shannon diversity indices (23 Biolog microplate wells that correspond to substrates on Biolog ecoplates)
Carbon source utilization richness (23 Biolog microplate wells that correspond to substrates on Biolog ecoplates)
4.18 (0.001) 4.27 (0.036) 3.60 (0.086) a* 4.33 (0.009) 4.18 (0.001)
92 (3.464) 93 (1.732) 67 (6.429) a 94 (1.000) 89 (2.646)
0.925 (0.008) 0.940 (0.000) 0.858 (0.014) 0.953 (0.001) 0.933 (0.005)
2.79 (0.099) 2.83 (0.058) 2.21 (0.122) b 2.84 (0.038) 2.71 (0.033)
94.67 (0.577) 94.67 (0.577) 87.67 (2.309) 94.67 (0.577) 93.0 (0.000)
4.35 (0.027) 4.34 (0.000) 4.19 (0.018) 4.16 (0.362) b
94 (1.155) 93 (0.000) 95 (0.577) 95 (0.000) b
0.957 (0.005) 0.958 (0.000) 0.921 (0.003) 0.914 (0.080)
2.89 (0.031) 2.96 (0.000) a 2.64 (0.027) b, c 2.94 (0.007) a, c
94.67 (0.577) 95.0 (0.000) 94.67 (0.577) 95.0 (0.000)
* Different letters in each vertical column indicate signi®cant differences (P < 0.05) determined by the Kruskal-Wallis test followed by Dunn's multiple comparisons test. Otherwise, no signi®cant differences were determined by the Dunn's multiple comparisons test at 95% level of signi®cance.
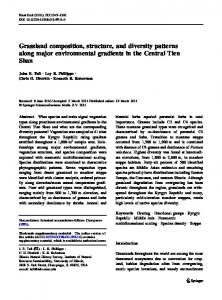
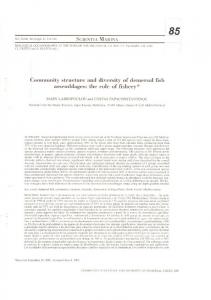
Principal Component Analysis Although soil types were clustered, there was no clear resolution of uncontaminated soil microbial communities from creosote-contaminated soil microbial communities (Figure 1). The cluster representing uncontaminated Halton beach sand, however, was differentiated from the other soils tested. Colour Development Rank (CDR) Plots CDR plots did not illustrate differences between uncontaminated and contaminated soils. Most of the soil samples followed log normal distributions. The exception was the unpolluted Halton beach sand (Figure 2, rank 3) which depicted a log series distribution. Colour development rank plots are the equivalent of species abundance plots because the optical density values are expressed as a percentage of total colour development and the wells are ranked in descending order (Magurran 1988, Staddon et al. 1998). Species abundance/rank plots have characteristic shapes. While the log series distribu-
574
World Journal of Microbiology & Biotechnology, Vol 14, 1998
tion has a steep gradient and an approximately linear curve, log normal distributions have a sigmoid curve (Magurran 1988). Based on 23 GN Biolog Microplate Wells that Correlate to Biolog Ecoplates ± Shannon Diversity, Richness, and Evenness Signi®cantly higher Shannon indices of diversity were observed in contaminated TI soil samples (P < 0.01, Dunn's test) and AC soil samples (P < 0.05, Dunn's test) compared with uncontaminated Halton beach sand (Table 4). The Shannon index for the TI soil was higher than that for QD samples (P < 0.05, Dunn's multiple comparisons test). No signi®cant differences between measures of carbon source utilization richness in uncontaminated and contaminated soils were indicated (Table 4). Unpolluted Halton beach sand had lower Shannon evenness measures of carbon substrate utilization compared to all other uncontaminated and contaminated
Microbial diversity in contaminated soils
Figure 1. Principal component analysis of SCSU results for uncontaminated and creosote-contaminated soil samples after 6 days incubation at 23 °C based on the regular 95 GN Biolog carbon substrates. (Where less than three points are present for each soil, this means that the replicates are clustered at the exact location).
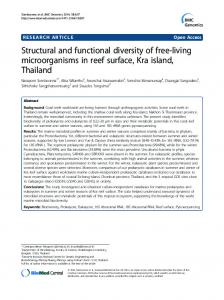
samples had signi®cantly lower Shannon evenness values than the other three contaminated soils tested (P < 0.01) and uncontaminated Halton clay soil (P < 0.05). Contaminated TI soil had a higher Shannon evenness index than unpolluted Guelph soil (P < 0.05, Tukey's test). Principal Component Analysis Soil types were not as tightly clustered as with the 95 Biolog microplate wells and there was no resolution of uncontaminated soil microbial communities from contaminated soil microbial communities (Figure 3). The unpolluted Halton beach sand was clustered away from the other soil types. Figure 2. Colour development rank plots for each uncontaminated and creosote-contaminated soil sample after 6 days incubation at 23 °C based on the regular 95 GN Biolog carbon substrates. Optical density values were expressed as a percentage of total colour development and ranked in descending order (Table 3). 1, uncontaminated Guelph soil; 2, uncontaminated Cambridge soil; 3, uncontaminated Halton beach sand; 4, uncontaminated Halton clay soil; 5, uncontaminated Mississauga soil; 6, contaminated NB soil; 7, contaminated TI soil; 8, contaminated QD soil; 9, contaminated AC soil.
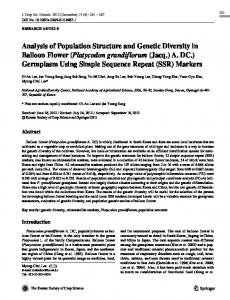
Colour Development Rank Plots Similar CDR plot results were generated using the 23 selected carbon sources as when the standard 95 carbon substrates on GN Biolog plates were used (Figure 4). While unpolluted Halton beach sand (rank 3) demonstrated a log series distribution, other soils depicted log normal distributions.
Discussion soils tested (P < 0.001, Tukey's test) (Table 5). According to Tukey's test, unpolluted Mississauga soil had a lower mean Shannon evenness measure than polluted TI (P < 0.01), AC (P < 0.001), and NB soils (P < 0.05). Tukey's test also indicated that the polluted QD soil
According to Shannon diversity indices, there were no signi®cant differences in functional microbial diversity between uncontaminated and creosote-contaminated soils based on Biolog carbon substrate utilization
World Journal of Microbiology & Biotechnology, Vol 14, 1998
575
A.M. Derry et al. Table 5. Means and standard deviations (n 3) for Shannon evenness measures of carbon source utilization in uncontaminated and creosote-contaminated soils after 6 days of incubation at 23 °C using 23 Biolog microplate wells corresponding to substrates on Biolog Ecoplates. Uncontaminated soils Guelph soil 0.613 (0.021) b, c, e, f *
Contaminated soils
Cambridge soil
Halton beach sand
Halton clay soil
Mississauga soil
NB
TI
QD
AC
0.622 (0.012) b, c, e, g
0.495 (0.025) d
0.625 (0.009) a, c
0.599 (0.007) c, e
0.635 (0.007) a, f, g
0.651 (0.000) a, g
0.581 (0.005) b, c
0.645 (0.002) a, f, g
* Different letters indicate signi®cant differences between soils, (P < 0.05) determined by Tukey's test.
patterns. Other variables that can affect microbial diversity, such as different soil textures may have contributed to the lower functional microbial diversity in unpolluted Halton beach sand compared with contaminated TI and AC soils when only 23 Biolog microplate wells were considered. According to a study by Fuller et al. (1997), however, functional diversity parameters (Shannon diversity, richness, and evenness) were shown to decrease when soil was exposed to different concentrations of trichloroethylene and toluene as determined by SCSU patterns of the soil microbial community. Although Wunsche et al. (1995) did not measure diversity indices, altered Biolog substrate utilization patterns were reported in association with differing levels of hydrocar-
bon pollution that corresponded to changes in the abundance of hydrocarbon-utilizing bacteria. Atlas et al. (1991) found that microorganisms within disturbed environments demonstrated enhanced physiological tolerances and substrate utilization capabilities. While other studies used soils that were examined shortly after contamination. The soils utilized in this study have been contaminated for more than 3 years. The lack of signi®cant differences in functional microbial diversity between the tested uncontaminated and contaminated soils in our study may re¯ect processes of microbial adaptation to creosote contamination. To gain a better understanding of factors that determine functional diversity of soil microorganisms based
Figure 3. Principal component analysis of SCSU results for uncontaminated and creosote-contaminated soil samples after 6 days incubation at 23 °C based on 23 GN Biolog microplate wells corresponding to substrates on Biolog Ecoplates. (Where less than three points are present for each soil, this means that the replicates are clustered at the exact location).
576
World Journal of Microbiology & Biotechnology, Vol 14, 1998
Microbial diversity in contaminated soils
Figure 4. Colour development rank plots for each uncontaminated and creosote-contaminated soil sample after 6 days incubation at 23 °C based on 23 GN Biolog microplate wells corresponding to substrates on Biolog Ecoplates. Optical density values were expressed as a percentage of total colour development and ranked in descending order (Table 3). 1, uncontaminated Guelph soil; 2, uncontaminated Cambridge soil; 3, uncontaminated Halton beach sand; 4, uncontaminated Halton clay soil; 5, uncontaminated Mississauga soil; 6, contaminated NB soil; 7, contaminated TI soil; 8, contaminated QD soil; 9, contaminated AC soil.
on the Shannon index, Biolog substrate utilization richness and evenness were measured. Richness is generally de®ned as the number of different groups of microorganisms found occurring together and evenness is the expected distribution of microbial groups within the community (Atlas 1984). We described richness as the total number of carbon substrates utilized and evenness by the equability of substrate utilization between all utilized substrates (Fuller et al. 1997). Biolog carbon substrate richness did not vary between uncontaminated and contaminated soils tested, with the exception of signi®cantly higher Shannon richness measured for contaminated AC soil samples compared with the Halton beach sand. The greatest variation between soil types was demonstrated by Shannon evenness measures when the 23 Ecoplate carbon substrates only were considered. Where differences occurred, uncontaminated soil samples had lower measures of evenness than creosote-contaminated soil samples. The exception was the polluted QD soil which had a lower measure of evenness than unpolluted Halton clay soil. Uncontaminated Halton beach sand exhibited the lowest measure of Shannon evenness out of all soils tested. The level of PAH contamination did not appear to correlate with any trends of functional microbial diversity, richness, or evenness based on Biolog carbon substrate utilization patterns. PCA indicated that the community structure between the uncontaminated and creosote-contaminated soils was similar in terms of carbon substrate utilization patterns
on the Biolog plates since there was no clear resolution of unpolluted soil microbial community clusters from those of polluted soil. The cluster representing Halton beach sand, however, was differentiated from the other soils tested and this was probably a function of texture and nutrient status. The results of PCA in the study by Fuller et al. (1997) indicated that the resolution of functional microbial communities in unpolluted soils from contaminated soils increased with higher concentrations of TCE and toluene contamination. CDR plots were used to examine the logarithmic patterns of functional microbial communities. This analysis has not been widely used to examine Biolog data (Staddon et al. 1998). Many factors in¯uence species composition of communities as suggested by logarithmic patterns (May 1976). Log normal distributions, demonstrated by most soil samples in this study, are indicative of mature and diverse communities (Magurran 1988). A log series distribution, depicted by unpolluted Halton beach sand is associated with environments of intermediate harshness and communities characterized by lower species diversity as well as by a smaller number of factors that affect community composition than those described by log normal distributions (Magurran 1988). The use of the 23 carbon substates found on the Ecoplates as opposed to 95 carbon substrates found on regular GN Biolog plates appeared to yield greater differentiation power between soil types in terms of Shannon diversity and evenness indices. Resolution between different microbial communities, however, appeared to be reduced when using PCA. Our research is different from the study by Hitzl et al. (1997) who used ratios of between soil variation to within soil variation of each GN Biolog carbon substrate to demonstrate that greater discrimination of soil communities could be acheived using a reduced set of ecologically relevant Biolog carbon sources. The application of the Shannon index for determination of functional microbial diversity (Torsvik et al. 1989, Watve & Gangal 1996) and the use of logarithmic patterns to describe microbial community structure (Staddon et al. 1998) may be questionable. The Shannon index was developed from information theory (Krebs 1994), and both the Shannon index (Magurran 1988; Krebs 1994) and logarithmic patterns (Whittaker 1970) are used most extensively by ecologists for the measurement of plant and animal taxonomic diversity and community structure. There are a lack of better alternatives, however, for characterizing functional microbial diversity (Atlas 1984; Watve & Gangal 1996). It is important to consider the impact of pollutants on the functional diversity of soil microorganisms when assessing potential adverse environmental effects (Fuller et al. 1997) and the possibility for bioremediation
World Journal of Microbiology & Biotechnology, Vol 14, 1998
577
A.M. Derry et al. (Wunsche et al. 1995). Further research is required to learn about the relationship of functional soil microbial diversity to ecosystem function (Beare et al. 1992; Couteaux et al. 1995).
Acknowledgements This research was supported by a Natural Science and Engineering Research Council of Canada operating grant to J.T.T. and the Summer Experience Program sponsored by Ontario Ministry of Agriculture, Food, and Rural Affairs.
References Atlas R.M. 1984 Diversity of microbial communities. In Advances in Microbial Ecology, 7th edn, ed Marshall, K.C. pp. 1±47. New York: Plenum Press. Atlas R.M. & Bartha R. 1993 Microbial Ecology: Fundamentals and Applications, 3rd edn. Don Mills: Benjamin/Cummings Publishing Co. Atlas R.M., Horowitz A., Krichevsky M. & Bej A.K. 1991 Response of microbial populations to environmental disturbance. Microbial Ecology 22, 249±256. Beare M.H., Parmalee R.W., Hendrix P.F. & Cheng W. 1992 Microbial and faunal interactions and effects on litter nitrogen and decomposition in agroecosystems. Ecological Monographs 62, 569±591. Borneman J. & Triplett E.W. 1997 Molecular microbial diversity in soils from Eastern Amazonia: evidence for unusual microorganisms and microbial population shifts associated with deforestation. Applied and Environmental Microbiology 63, 2647±2653. Brock T.D, Madigan M.T., Martinko J.M. & Parker J. 1994 Biology of Microorganisms, 7th edn. pp. 238, 240, 241, 323, 695. New Jersey: Prentice-Hall, Inc. Couteaux M.-M, Bottner P. & Berg B. 1995 Litter decomposition, climate, and litter quality. TREE 10(2), 63±66. Fuller M.E., Scow K.M., Lau S. & H. Ferris H. 1997 Trichloroethylene (TCE) and toluene effects on the structure and function of the soil community. Soil Biology and Biochemistry 29(1): 75±89. Garland J.L. & Mills A.L. 1991 Classi®cation and characterization of heterotrophic microbial communities on the basis of patterns of community-level sole-carbon-sourceutilization. Applied and Environmental Microbiology 57, 2351± 2359. Glantz S.A. 1992 Primer of Biostatistics, 3rd edn. New York: McGraw Hill Inc. Haack S.K., Garchow H., Klug M.J. & Forney L.J. 1995 Analysis of factors affecting the accuracy, reproducibility, and interpretation of microbial community carbon source utilization patterns. Applied and Environmental Microbiology 61, 1458± 1468.
578
World Journal of Microbiology & Biotechnology, Vol 14, 1998
Hawksworth, D.L. & Coleman R.R. 1992 Microbial diversity 21: biodiversity amongst microorganisms and its relevance. Biodiversity and Conservation 1, 221±226. Hitzl W., Rangger A., Sharma S. & Insam H. 1997 Separation power of the 95 substrates of the BIOLOG system determined in various soils. FEMS Microbiology Ecology 22, 167± 174. Krebs C.J. 1994 Ecology: The Experimental Analysis of Distribution and Abundance, 4th edn. pp. 514±541. New York: Harper Collins College Publishers. Magurran A.E. 1988 Ecological Diversity and its Measurement. pp. 11±29, 35±39. New Jersey: Princeton University Press. May R.M. 1976 Patterns in multi-species communities. In Theoretical Ecology: Principles and Applications, ed. May, R.M. pp. 142±162. Toronto: W.B. Saunders Co. Meyer O. 1993 Functional groups of microorganisms. In Biodiversity and Ecosystem Function. Ecological Studies 99, eds Schulze E.D. & Mooney H.A. pp. 67±96, Berlin: Springer. Ricklefs R.E. & Shluter D.S. 1993 Species Diversity in Ecological Communities: Historical and Geographical Perspectives. Chicago: The University of Chicago Press. Schulze E.D. & Mooney H.A. 1993 Biodiversity and Ecosystem Function. New York: Springer-Verlag. Staddon W.J., Duchesne L.C. & Trevors J.T. 1996 Conservation of forest soil microbial diversity: the impact of ®re and research needs. Environmental Reviews 4, 267±275. Staddon W.J., Duchesne L.C. & Trevors J.T. 1997 Microbial diversity and community structure of post-disturbance forest soils as determined by sole-carbon-source-utilization patterns. Microbial Ecology 34, 125±130. Staddon W.J., Duchesne L.C., Trevors J.T. & Colombo C.A. 1998 Soil microbial diversity and community structure across a climatic gradient in Western Canada. Biodiversity and Conservation (in press). Torsvik V., Salte K., Sorheim R. & Goksoyr J. 1989 Comparison of phenotypic diversity and DNA heterogeneity in a population of soil bacteria. Applied and Environmental Microbiology 56, 776±781. United Nations Environment Program. 1995 Global Biodiversity Assessment. pp. 1075±1103. Cambridge: Cambridge University Press. Watve M.G & Gangal R.M. 1996 Problems in measuring bacterial diversity and a possible solution. Applied and Environmental Microbiology 62, 4299±4301. Whittaker R.H. 1970. Communities and Ecosystems. pp. 25±29. Toronto: Collier-Macmillan Canada Ltd. Wunsche L., Bruggemann L. & Babel W. 1995 Determination of substrate utilization patterns of soil microbial communities: an approach to assess population changes after hydrocarbon pollution. FEMS Microbiology Ecology 17, 295±306. Zak J.C., Willig M.R., Moorhead D.L. & Wildman H.G. 1994 Functional diversity of microbial communities: a quantitative approach. Soil Biology and Biochemistry 26, 1101±1108.
(Received in revised form 20 October 1997; accepted 27 October 1997)