December 2001
Chem. Pharm. Bull. 49(12) 1547—1554 (2001)
1547
Functional Modification of Cytochrome c by Peroxynitrite in an Electron Transfer Reaction Hidehiko NAKAGAWA,a Yukiko OHSHIMA,a Mitsuko TAKUSAGAWA,a Nobuo IKOTA,a Yutaka TAKAHASHI,b Shigeomi SHIMIZU,c and Toshihiko OZAWA*, a Bioregulation Research Group, National Institute of Radiological Sciences,a 9–1, Anagawa-4, Inage-ku, Chiba 263–8555, Japan, Analytical Instruments Division, JEOL Ltd.,b Tokyo 196–8558, Japan, and Biomedical Research Center, Osaka University School of Medicine,c Osaka 565–0871, Japan. Received June 26, 2001; accepted September 18, 2001 The redox reaction of cytochrome c after modification with peroxynitrite under physiological conditions was investigated. Cytochrome c was treated with a bolus of synthetic peroxynitrite at a sub-millimolar concentration, and then subjected to reduction by superoxide and oxidation by hydrogen peroxide. The ability for the membrane potential formation in the mitochondrial respiratory chain was also evaluated. After the treatment with peroxynitrite, the cytochrome c molecule was mono-nitrated mainly at a tyrosine residue, using liquid chromatography–electrospray ionizing mass spectrometry (LC-ESI-MS) and HPLC. Although the redox capacity of cytochrome c was not affected by the peroxynitrite treatment, the oxidation of ferrocytochrome c to ferricytochrome c by hydrogen peroxide was accelerated. When cytochrome c was treated with peroxynitrite in the presence of 5-methoxytryptamine, an inhibitor for the tyrosine nitration by peroxynitrite, the acceleration of hydrogen peroxide-mediated oxidation was suppressed. It was also found that the formation of membrane potential in the rat liver mitochondria was suppressed when peroxynitrite-treated cytochrome c was used instead of the intact cytochrome c in vitro. From these results, we concluded that the peroxynitrite-treated cytochrome c was nitrated at a tyrosine residue and became more susceptible to oxidation by hydrogen peroxide, concomitantly losing the ability to transfer electrons in the mitochondrial respiratory chain. It is suggested that the peroxynitriteinduced modification of cytochrome c increases the susceptibility to non-physiological oxidants, and may cause dysfunction of mitochondria by suppressing of membrane potential. Key words cytochrome c; peroxynitrite; tyrosine nitration; functional modification; mitochondria; membrane potential
Reactive oxygen species (ROS) such as superoxide and reactive nitrogen species (RNS) such as nitric oxide are considered to be involved in the pathogenesis of various diseases. Although nitric oxide and superoxide are both endogenous compounds and important for physiological reactions including vasodilatation, signal transduction, and protection from infection, they have toxic effects on various biological components when overproduced. Peroxynitrite is produced after the diffusion rate-limiting reaction between nitric oxide and superoxide, and is a strong oxidant for various biological components as well as a nitrating reagent for free tyrosine and protein tyrosine residues. Since peroxynitrite is formed from superoxide and nitric oxide under physiological conditions in vitro, it is also considered to be produced in vivo when sufficient amounts of superoxide and nitric oxide are produced to react directly with one another. Because of its high reactivity, peroxynitrite can cause oxidative damage to important biological components, such as low density lipoprotein (LDL) oxidation, lipid peroxidation, and DNA strand breakage,1—3) as well as the nitration of tyrosine residues to produce nitrotyrosine.4) The presence of nitrotyrosine in tissues and cell cultures is often used as a marker for peroxynitrite production although nitrotyrosine is not the sole product of peroxynitrite. With reports that nitrotyrosine is upregulated in tissue in several kinds of diseases, peroxynitrite is assumed to be produced not only in inflammation,2,3) but also in neurodegenerative diseases such as Alzheimer’s disease, Parkinson’s disease, and amyotropic lateral sclerosis.1,5—10) Additionally, the tyrosine nitration in the substrate proteins of tyrosine kinases is assumed to prevent the tyrosine phosphorylation by the kinases. Tyrosine phosphorylation is very important to the sig∗ To whom correspondence should be addressed.
e-mail:
[email protected]
nal transduction in cells.11,12) Furthermore, the oxidation and nitration activities of peroxynitrite are considered to play important roles in the functional damage to enzymes and receptors. It has been reported that the activity of the respiratory chain in mitochondria is inhibited by peroxynitrite treatment due to the oxidative destruction of iron–sulfur containing proteins,13) the inhibition of the redox cycling of cytochrome c by the oxidation of ferrocytochrome c,14) and the inhibition of cytochrome c oxidase.15) It has also been shown that cytochrome c is released from mitochondria and involved in the activation of caspases during the apoptotic process.16—18) Although cytochrome c is an important component of the electron transfer system in mitochondria, few studies have been conducted on the effect of peroxynitrite on the redox activity of cytochrome c. Very recently, Radi and colleagues, reported nitration of cytochrome c by peroxynitrite in vitro,19,20) and demonstrated that a low concentration of peroxynitrite caused mono-nitration of the tyrosine residue at position 67. Since cytochrome c is a water-soluble protein in the intermembranous spaces of mitochondria, there is a possibility that peroxynitrite, an ionic type of ROS, interacts with cytochrome c when peroxynitrite is produced from nitric oxide and superoxide around or in the intermembranous space of mitochondria. In this study, we report the modification of the redox activity of peroxynitrite-treated cytochrome c, and its electron transport function in the mitochondrial respiratory chain.21,22) Results We have investigated the effect of peroxynitrite treatment on cytochrome c using mass spectra, circular dichroic (CD) spectra and absorption spectra. In the mass spectroscopic analysis, peroxynitrite-treated cytochrome c in phosphate© 2001 Pharmaceutical Society of Japan
1548
Fig. 1.
Vol. 49, No. 12
ESI Mass Spectra of Peroxynitrite-Treated and Control Cytochrome c
Cytochrome c (25 m M) treated with 62.5 m M peroxynitrite was subjected to short-column reversed-phase HPLC with a system directly connected to an ESI mass spectrometer. A, peroxynitrite-treated cytochrome c, m/z: 12239.2 (base peak), 12260.8, 12283.5, 12352.1, and 12398.5. B, control (0.01 N NaOH-treated) cytochrome c, m/z: 12239.2 (base peak), 12262.5, and 12352.2. Peaks indicated by arrows are detected only in peroxynitrite-treated cytochrome c.
buffered saline (PBS) solution was separated from buffer salts by reversed-phase HPLC. The eluent was directly introduced into the ionizing chamber of a mass spectrometer. Thus, the cytochrome c separated by HPLC was ionized by an electrospray ionizing (ESI) method into multiple-charged ions without fragmentation, and measured by a magnetic field–electric field (MF-EF) double-focusing mass spectrometer. Single-charged molecular mass spectra were constructed from the multiple-charged ion mass spectral data using a computer. The spectrum obtained from intact cytochrome c showed molecular mass peaks at m/z 12239.2 (base peak), 12262.5, and 12352.2. Peroxynitrite-treated cytochrome c showed peaks at m/z 12239.2 (base peak), 12260.8, 12283.5, 12352.1, and 12398.5 (Fig. 1). The two additional peaks observed in peroxynitrite-treated cytochrome c, m/z 12283.5 and 12398.5, were assigned as mono-nitrated molecules for m/z 12239.2 and 12352.1, respectively. The mass spectrum for intact cytochrome c showed three molecular peaks instead of one. The two peaks other than the base peak were assigned as sodium ion-associated cytochrome c. Peroxynitrite-treated cytochrome c (62.5 m M peroxynitrite for 25 m M cytochrome c) was hydrolyzed with proteinase treatment after the removal of residual nitrate/nitrite ions through dialysis. Aromatic amino acids in the lysate were analyzed by reversed-phase HPLC using a UV detector, with monitoring at 274 nm. 3-Nitrotyrosine was observed in the lysate from peroxynitrite-treated cytochrome c (Fig. 2), while no nitrotyrosine was observed in the control cytochrome c lysate. Analysis of aromatic amino acid content indicated the molar ratio between L-tyrosine and 3-nitrotyrosine to be 12 : 1 in cytochrome c (25 m M) treated with 62.5 m M peroxynitrite. Because the cytochrome c used in this study has four tyrosine residues, it was found that about one third of the molecules were nitrated at one tyrosine residue. CD spectra of cytochrome c treated with peroxynitrite were recorded to evaluate the change in alpha-helix content.
Fig. 2. Detection of Aromatic Amino Acids in Peroxynitrite-Treated Cytochrome c after Enzymatic Hydrolysis Cytochrome c treated with peroxynitrite was hydrolyzed with Pronase (Boeringer– Manheim). The hydrolysate was analyzed by reversed-phase HPLC monitoring the absorbance at 274 nm. Peak A, B, and C were assigned as L-tyrosine, 3-nitro-L-tyrosine, and L-tryptophan, respectively, by comparing with authentic compounds.
Table 1.
Alpha-Helix Content of Peroxynitrite-Treated Cytochrome c Alpha-helix (%)
Cytochrome c (m M)
25 25
Peroxynitrite (m M)
62.5 62.5 (decomposeda))
Treated
Vehicle
24.96 31.31
27.03 30.04
a) Decomposed peroxynitrite was prepared by the addition of the peroxynitrite solution into PBS for 5 min.
Vehicle-treated cytochrome c was used as a control for each treatment. The molar ellipsity and the alpha-helix content were calculated from the q value observed at 222 nm for each spectrum. No differences were observed between the treated samples and corresponding controls (vehicle) (Table 1). There were no marked differences between the absorption spectra of 62.5 m M peroxynitrite-treated cytochrome c and vehicle-treated control cytochrome c, but a slight decrease in
December 2001
Fig. 3.
1549
Absorption Spectra of Cytochrome c Treated with Peroxynitrite
The absorption spectra of the oxidized form of cytochrome c (25 m M) treated with 62.5 m M peroxynitrite (A, C) or 0.01 N NaOH as a control (B, C) were measured. The scale of the absorbance in panel C (600 nm to 800 nm) was extended 4-fold.
the absorbance at around 700 nm was observed (Fig. 3), suggesting a small change in the coordination status of the sulfur atom of the methionine residue relative to the iron atom of the heme. The oxidized form of cytochrome c was reduced in a superoxide-generating system using hypoxanthine (HX) and xanthine oxidase (XO) and the redox status of cytochrome c was monitored through absorption spectra from 450 to 600 nm or the absorbance at 550 nm at 1-min intervals. From the spectral change, peroxynitrite-treated cytochrome c was shown to be reduced from ferricytochrome c (Fe31) to ferrocytochrome c (Fe21). The absorbance at 550 nm, a characteristic band for reduced cytochrome c, reached the same maximum intensity in peroxynitrite-treated cytochrome c as in intact cytochrome c, indicating that peroxynitrite-treated cytochrome c fully retained reduction reactivity. The oxidation reaction of the reduced form of cytochrome c was examined using hydrogen peroxide. The oxidized form of peroxynitrite-treated cytochrome c was first reduced using the HX/XO superoxide generating system in the presence of catalase. After the reduction reaction, allopurinol and 3amino-1,2,4-triazole were added to the reaction mixture to inhibit the activities of XO and catalase, respectively. The reaction was monitored by recording the absorption spectra or the absorbance at 550 nm at 1-min intervals. After the addition of these inhibitors, the absorbance at 550 nm decreased slightly due to the increase in the total volume of the reaction mixture. However, the redox status of cytochrome c was not affected by the addition of these inhibitors. The oxidation of the reduced form of cytochrome c was initiated by the addition of hydrogen peroxide. The oxidation rate of peroxynitrite-treated cytochrome c increased with the concentration of peroxynitrite used for the pretreatment (Figs. 4, 5). The rate of oxidation of cytochrome c treated with tetranitromethane (TNM), a specific nitrating reagent for protein tyrosine residue, increased with the TNM concentration (Fig. 5B). When cytochrome c was treated with peroxynitrite in the presence of 5-methoxytryptamine (5MT), a selective inhibitor for tyrosine nitration by peroxynitrite,23,24) the accel-
Fig. 4. Change of Absorption Spectra of Cytochrome c in the HX/XO System The oxidized form of cytochrome c pretreated with peroxynitrite was mixed with HX and XO in the presence of catalase. Cytochrome c was reduced by superoxide, then oxidized with hydrogen peroxide after addition of allopurinol and 3-amino-1,2,4-triazole. The absorption spectra were recorded. A, spectral change of cytochrome c treated with 62.5 m M peroxynitrite by the reduction and oxidation. B, the time course of the absorbance change at 550 nm. Cytochrome c was pretreated with 0 (closed circles), 12.5 m M (open triangles), 62.5 m M (closed squares) and 125 m M (asterisks) peroxynitrite. Red: reduced form, Ox: oxidized form.
1550
Vol. 49, No. 12
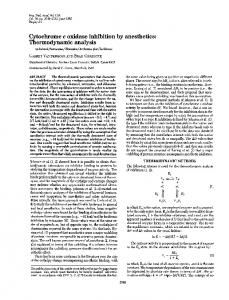
Fig. 7. Formation of Mitochondrial Membrane Potential Using Peroxynitrite-Treated Cytochrome c
Fig. 5. Oxidation Rate of Peroxynitrite-Treated and TNM-Treated Cytochrome c Cytochrome c treated with peroxynitrite or TNM was reduced and oxidized as described in the Experimental section. The time course of the absorbance change at 550 nm was measured at 1-min intervals. The oxidation rate of cytochrome c, expressed as the slope of the absorbance change during the oxidizing process, is represented as the concentration of peroxynitrite (panel A) and TNM (panel B) treated. Values are the mean6S.D. for n53.
Fig. 6. Inhibitory Effect of 5MT on the Peroxynitrite-Induced Acceleration of the Oxidation of Cytochrome c In the presence of 5MT, 25 m M cytochrome c was treated with 62.5 m M peroxynitrite. Then, it was reduced and oxidized as described in the Experimental section. The absorbance at 550 nm was monitored. The oxidation rate of cytochrome c, expressed as the slope of the absorbance change during the oxidizing process, is represented as the concentration of 5MT treated. The open circle represents the oxidation rate of intact cytochrome c without 5MT as the lot-matched control. Values are the mean6S.D. for n53.
eration of cytochrome c oxidation was prevented in a dosedependent manner (Fig. 6). The formation of mitochondrial membrane potential with peroxynitrite-treated cytochrome c was examined. The isolated rat mitochondria were treated with a low osmotic solution to break down the outer-membrane, and then the endogenous cytochrome c in mitochondria was washed out with an isotonic buffer solution. Cytochrome c-free mitochondria were suspended in the buffer solution containing succinate and rhodamine 123, as a substrate and an indicator, respectively. The membrane potential was monitored as the
The mitochondrial fraction without endogenous cytochrome c was prepared by treatment with the low-osmotic buffer solution as described in the Experimental section. A bold trace represents the time course of the fluorescence intensity in the case of peroxynitrite-treated cytochrome c. The bold arrows indicate the time point, at which peroxynitrite-treated cytochrome c was added to the mitochondrial suspension containing the succinate and rhodamine 123. The narrow trace and arrows show the case of the control, that is vehicle-treated cytochrome c.
fluorescence intensity at 523 nm from rhodamine 123 (excited at 505 nm). The membrane potential promotes accumulation of rhodamine 123 on the surface of the mitochondria due to its positive charge, thus the fluorescence intensity is decreased by the quenching effect. Without the addition of exogenous cytochrome c, there was no membrane potential formation. Peroxynitrite-treated or control cytochrome c was added and the fluorescence intensity at 523 nm was monitored continuously. Peroxynitrite-treated or control cytochrome c was added to the mitochondrial suspension after the membrane potential leveled off (Fig. 7). Peroxynitritetreated cytochrome c was less potent in forming mitochondrial membrane potential than control cytochrome c (Fig. 7). Discussion The modification of cytochrome c after peroxynitrite treatment was investigated using mass spectrometry, CD, and HPLC. Previous studies4,23) have shown that tyrosine can be nitrated by peroxynitrite under physiological conditions, therefore we examined whether the tyrosine residues in cytochrome c were nitrated using mass spectrometry and HPLC. In this study, cytochrome c treated with a 2.5-fold molar excess of peroxynitrite was used. Mass spectroscopic analysis of peroxynitrite-treated cytochrome c indicated that one third of cytochrome c molecules were modified by peroxynitrite, and a tyrosine residue in the cytochrome c molecule was converted to 3-nitrotyrosine. In the study by Radi and colleagues,20) a single bolus or repetitive treatment of 3 mM peroxynitrite was used to modify cytochrome c (15-fold excess or more over cytochrome c), but only a fraction of the cytochrome c was nitrated. In the present study, we used a very low concentration of peroxynitrite such as 62.5 m M (2.5-fold excess over cytochrome c) to treat cytochrome c, which is considered to be closer to the physiological concentration of peroxynitrite. Even on single treatment with such a low concentration of peroxynitrite, cytochrome c was sufficiently nitrated at a tyrosine residue. The extent of nitration by this low concentration of peroxynitrite appears comparable with that at higher concentrations based on the molecular mass spectrum.
December 2001
Tryptophan residues might be modified by peroxynitrite.25) A few very small peaks were detected in the hydrolysate of peroxynitrite-treated cytochrome c on HPLC of aromatic amino acids. These peaks were found in the products of the treatment of tryptophan with peroxynitrite. The characterization of these minor modifications of tryptophan after the peroxynitrite treatment remains to be performed. To examine whether peroxynitrite affects the secondary structure of the cytochrome c molecule, CD spectra were measured and the change in the alpha-helix structure was evaluated. In the CD spectrum from peroxynitrite-treated cytochrome c, no obvious changes were observed in comparison with vehicle-treated samples (Table 1). The percentage of the alpha-helix structure in the cytochrome c molecule treated with decomposed peroxynitrite was also unchanged compared with the vehicle-treated sample. The alpha-helix structure is the only characteristic secondary structure in the cytochrome c molecule. Therefore, the CD spectra suggested that peroxynitrite treatment did not affect secondary structures in cytochrome c, but a change to other structures such as random coils or the orientation of the alpha-helix could not be excluded. The absorption spectrum for peroxynitritetreated cytochrome c showed a band pattern typical of the oxidized form of cytochrome c, suggesting that the electronic structure does not change with peroxynitrite treatment. Compared with control cytochrome c, however, a weak band at around 700 nm was slightly decreased in peroxynitritetreated cytochrome c, suggesting that the coordination status of methionine relative to the iron ion of the heme may be partly changed by peroxynitrite treatment. To evaluate the effect of the modification in cytochrome c caused by peroxynitrite treatment on the function of cytochrome c, two experiments were performed: 1) a redox reaction of peroxynitrite-treated cytochrome c driven by superoxide and hydrogen peroxide; 2) membrane potential formation of mitochondria with peroxynitrite-treated cytochrome c. The rate of reduction of the oxidized form of cytochrome c was not affected by the pretreatment with peroxynitrite. The production of superoxide is the rate-limiting process in the reduction reaction by HX and XO system, so the change in the rate of reduction of peroxynitrite-treated cytochrome c could not be evaluated in this system. At least, it was not shown that the reduction rate of peroxynitrite-treated cytochrome c became slower than the production rate of superoxide. This does not mean that changes in the rate of reduction of cytochrome c reflect to the observed rate of reduction of cytochrome c in this system, no longer the rate-limiting reaction. To evaluate the rate of oxidation of cytochrome c by hydrogen peroxide, the peroxynitrite-treated cytochrome c was reduced with the superoxide generation system in the presence of catalase, which was added to scavenge the hydrogen peroxide produced by the disproportionation reaction of superoxide. The absorbance at 550 nm increased and then peaked at 3 min after the reduction started. The absorption spectra showed that the reduction of cytochrome c was complete at this time point. Then, allopurinol was added to the reaction mixture to abolish the XO activity and to stop the production of superoxide. The absorbance at 550 nm remained at a plateau after the addition of allopurinol, although it decreased slightly immediately after the addition
1551
due to dilution of the reaction mixture by the increase in total volume. Hydrogen peroxide was not detected in the system at this time point by the titanium oxide method. These results suggested that the cytochrome c in the solution was completely reduced to ferrocytochrome c by superoxide, and the reduced status was maintained under the hydrogen peroxide-free conditions after the superoxide production was inhibited. It was not suggested that the reduced form of cytochrome c was reoxidized under normoxic conditions without hydrogen peroxide. The reduced form of cytochrome c was then oxidized to ferricytochrome c by addition of exogenous hydrogen peroxide to the reaction mixture. The oxidation rate of ferrocytochrome c increased depending on the peroxynitrite concentration used in the pretreatment up to 62.5 m M peroxynitrite for 25 m M cytochrome c (a 2.5-fold excess) (Fig. 4B). When the cytochrome c was treated with decomposed peroxynitrite instead of active peroxynitrite, the rate of hydrogen peroxide-induced oxidation did not change. These results suggested that the treatment with only a 2.5fold excess of peroxynitrite made cytochrome c more susceptible to the oxidation by hydrogen peroxide. Mass spectrometry and HPLC revealed that one third of the cytochrome c molecules are nitrated at a single tyrosine residue at this concentration of peroxynitrite and that the nitration was the only modification. CD spectra and UV–visible absorption spectra indicated that the main structure and electronic structure of the cytochrome c were not markedly changed by the treatment. The redox capacity of the peroxynitrite-treated cytochrome c was unaffected at this concentration range. From these results, it was suggested that the nitration of cytochrome c induced the acceleration of the oxidation of cytochrome c. According to a report by Radi and colleagues,20) peroxynitrite can partially modify the tyrosine residue at position 67 through nitration. This suggests that the tyrosine residue at this position is a likely target of the low concentration of peroxynitrite. The tyrosine residue at this position is a participant of the electron transfer reaction of cytochrome c and relatively close to the iron center of the heme,26) so that the modification of this residue is probably closely related to the functional alteration of cytochrome c. Actually, using cytochrome c pretreated with TNM, a reagent for nitration of protein tyrosine residues,27,28) the oxidation of cytochrome c was accelerated in a dose-dependent manner (Fig. 5B). In the case of TNM-treated cytochrome c, the nitrotyrosine formation was confirmed by the HPLC, and the alpha-helix content did not change after the treatment. Furthermore, when cytochrome c was pretreated with peroxynitrite in the presence of 5MT, which is the inhibitor we found for the peroxynitriteinduced tyrosine nitration,23,24) the increase in the oxidation rate was inhibited in a dose-dependent manner. At 62.5 m M 5MT, the rate of oxidation was the same as with intact cytochrome c. This result suggested that inhibition of the nitration of tyrosine residues suppressed the acceleration of the oxidation of cytochrome c in this system. This is the first evidence that the nitration of a tyrosine residue in the cytochrome c molecule was responsible for a change of redox property and increase in the sensitivity to oxidation by hydrogen peroxide. In the absorption spectrum, a very slight decrease in the intensity of the 700 nm band was found, indicating a slight change in the coordination status of a methionine residue relative to the iron atom in the heme. It is possi-
1552
ble that the tyrosine nitration causes a slight change in the coordination around the iron atom of the heme20) making hydrogen peroxide more accessible to the ferrous iron of cytochrome c, and accounting for the increased susceptibility of the peroxynitrite-treated cytochrome c to the hydrogen peroxide-induced oxidation. The fluorescence intensity of rhodamine 123, an indicator of the mitchondrial membrane potential, decreased on addition of the control cytochrome c, and the change in fluorescence intensity was dependent on the concentration of cytochrome c added. This result confirms that the membrane potential was dependent on cytochrome c in this experiment. In the case of peroxynitrite-treated cytochrome c, the membrane potential also depended on the concentration added. However, the change in membrane potential was smaller than that in the case of the control (Fig. 7). This result suggested that peroxynitrite-treated cytochrome c was less active than the control in the electron transfer reaction of mitochondria, and that the function of cytochrome c was modified by peroxynitrite treatment. As shown in the redox reaction using the superoxide generating system, peroxynitrite-treated cytochrome c could be fully reduced and oxidized. This means that the electron transfer capacity of cytochrome c remains even after the peroxynitrite treatment (62.5 m M). Based on these results, it was suggested that the efficiency of electron transport in the mitochondria was modified by the cytochrome c treated with peroxynitrite, actually resulting in a loss of membrane potential, one of the most important features of mitochondria, even at very low concentrations of peroxynitrite. The sites susceptible to peroxynitrite in the electron transfer system of mitochondria include complex I, II,13) and IV.15) The oxidative damage to these sites is assumed to cause dysfunction of the respiratory chain. The present result suggested that an alternative site in the respiratory chain was attacked by peroxynitrite. Previously, one of the superoxideproducing sites in the respiratory chain was shown to be the co-enzyme Q and cytochrome bc1 complex.29,30) The production of superoxide at this site results in the leakage of electrons from the respiratory chain, but the superoxide produced from here is also able to reduce cytochrome c, and then transfer an electron to cytochrome c oxidase. However, when modified by peroxynitrite, even if reduced by superoxide, the cytochrome c could be readily oxidized by hydrogen peroxide formed from residual superoxide. The oxidation by molecules other than cytochrome c oxidase results in an actual electron leakage and the consumption of substrate in vain without the formation of membrane potential. In conclusion, we showed that cytochrome c was partly mono-nitrated by peroxynitrite at a tyrosine residue, and became more sensitive to oxidation by hydrogen peroxide, but this modification did not change its redox capacity. The formation of mitochondrial membrane potential was also partly suppressed by peroxynitrite-treated cytochrome c. These results suggest that the peroxynitrite-induced irreversible modification of cytochrome c can cause the loss of mitochondrial membrane potential, and this could be a new mechanism of the dysfunction of energy formation. Experimental Materials Cytochrome c (bovine heart), catalase, allopurinol, 3-amino1,2,4-triazole, XO, and HX were purchased from Sigma (St. Louis, MO,
Vol. 49, No. 12 U.S.A.). Pronase was from Boeringer-Mannheim (Mannheim, Germany). 3-Nitro-L-tyrosine, 5MT and TNM were from Aldrich (Milwaukee, WI, U.S.A.). All other reagents used were purchased from Wako Pure Chemical Industry (Osaka, Japan). All the reagents were of analytical or biochemical grade. Peroxynitrite Preparation Peroxynitrite was synthesized as an alkaline solution based on the method of Pryor et al.31) Briefly, NaN3 (138 mg) was dissolved in 10 ml of H2O, and then the solution was adjusted to pH 12 with 1.5 N NaOH. The solution was bubbled with an oxygen stream containing ozone (generated at 1 g/h by an ozone generator) for 15 min while kept in an ice bath. After bubbling, the solution was frozen in a dry-ice/acetone bath and stored at 220 °C until used. The concentration of the peroxynitrite solution was determined photometrically by measuring the absorbance at 302 nm (e 51670 M21 · cm21). Using this method, up to a 65 mM solution of peroxynitrite was obtained. The concentration of the stock solution was determined again before use, and then the stock solution was diluted to the desired concentration with 0.01 N NaOH. Preparation of Peroxynitrite-Treated and TNM-Treated Cytochrome c To PBS, 80 m l of 1 mM cytochrome c in PBS and an amount (20— 200 m l) of 2 mM peroxynitrite in 0.01 N NaOH were added in this order to make a total volume of 3200 m l. The mixture was left at room temperature for 5 min. A solution of cytochrome c containing decomposed peroxynitrite was also prepared by mixing peroxynitrite with PBS 5 min prior to addition of cytochrome c. Because peroxynitrite is unstable at neutral pH, it is practically fully decomposed after a 5-min treatment with PBS. At the volume range of 2 mM peroxynitrite used in this study, the pH values of the prepared peroxynitrite-treated and control cytochrome c solutions were neutral (pH 7 to 8). A solution of 25 m M cytochrome c treated with peroxynitrite in the presence of 5MT was also prepared for the experiment on the inhibitory effect of 5MT against peroxynitrite. For preparing TNM-treated cytochrome c, 250 m l of 1 mM cytochrome c in 100 mM sodium phosphate buffer (pH 9.0) was mixed with 5 m l of various concentrations of TNM solution in dioxane. After the mixture had been stirred for 1 h at room temperature, 80 m l of it was added to 3120 m l of PBS. To prepare the control for TNM-treated cytochrome c, 5 m l of dioxane was added to 250 m l of 1 mM cytochrome c instead of a TNM solution. To wash out residual NaN3 and dioxane in the solution of peroxynitritetreated and TNM-treated cytochrome c, respectively, 2 ml of the cytochrome c solution was centrifuged 3 times using Centricon rM-3 at 2 °C for 90 min (50003g). The volume of each solution was finally brought to 2 ml with PBS after centrifugation, so that the absorbance at 530 nm of the solutions was always between 0.21—0.22. Reduction and Oxidation of Peroxynitrite-Treated Cytochrome c with HX and XO A solution of cytochrome c (1.6 ml) prepared as described above was mixed with 0.2 ml of 2 mM hypoxanthine (HX) and 20 m l of catalase (1000 units/ml) in PBS. The redox reaction was initiated by addition of 0.2 ml of XO (0.4 unit/ml). Absorption spectra of the reaction mixture (450—600 nm) were recorded, or the absorbance at 550 nm was monitored for 30 min. The absorbance at 550 nm increased rapidly, with maximum absorption attained within 3 min due to the reduction of cytochrome c by superoxide from the HX/XO system. Eight minutes after the addition of XO, 270 m l of 6 mM allopurinol was added to suppress the generation of superoxide, followed by 300 m l of 300 mM 3-amino-1,2,4-triazole, a specific inhibitor for catalase, 5 min later. Then, 6 m l of 100 mM hydrogen peroxide (final concentration, 230 m M) was added at 15 min after the addition of XO to initiate the oxidation of ferrocytochrome c. The absorbance at 550 nm gradually decreased with the oxidation by hydrogen peroxide. The slope for the change in absorbance at 550 nm during the oxidation process was calculated as the oxidation rate of cytochrome c in this system. The absence of residual hydrogen peroxide in the reaction mixture just before the addition of exogenous hydrogen peroxide was confirmed by the titanium method32) using a separately prepared reaction mixture without cytochrome c. Briefly, 100 m l of 2 mM peroxynitrite was added to 3100 m l of PBS in the absence of cytochrome c, and the solution was treated with Centricon rM-3 as described above. After centrifugation, HX, catalase, XO, and allopurinol were added to 1.6 ml of the solution as described above. For the assay of hydrogen peroxide, 306 m l of PBS, 1 ml of Titanium–sulfuric acid solution, and 2.4 ml of 50% sulfuric acid solution were added to the solution.32) After the mixture was heated at 60 °C for 10 min, the absorbance of this solution at 407 nm was measured and the concentration of hydrogen peroxide was calculated according to a standard curve (23 to 230 m M hydrogen peroxide in PBS). Without addition of exogenous hydrogen peroxide, hydrogen peroxide was not detected by this method. After addition of 300 m l of 3-amino-1,2,4-triazole and 6 m l of 100 mM hydrogen peroxide, supposed to give a final hydro-
December 2001
1553
gen peroxide concentration of 0.23 mM, it was confirmed that the actual final concentration was 0.22 mM by the titanium method. CD Spectra and ESI Mass Spectra of Peroxynitrite-Treated Cytochrome c The solutions of 25 m M cytochrome c treated with 62.5 m M peroxynitrite were diluted with PBS to give 10 m M peroxynitrite-treated cytochrome c. CD spectra of peroxynitrite-treated cytochrome c were measured from 200 nm to 250 nm with a CD spectrometer (J-20, JASCO Corp., Tokyo, Japan). CD spectra of cytochrome c in the presence of decomposed peroxynitrite were also measured. Cytochrome c treated with the same volume of 0.01 N NaOH as that of peroxynitrite was used as a control. From the q value at 222 nm obtained from the CD spectrum, the molecular ellipsity at 222 nm ([q ]222) and the content of a -helix ([fH]) were calculated using Eqs. 1 and 2. [q ]22251003q 222/n · l · c
(1)
fH51003([q ]2222q 222)/(a 222)
(2)
(b 222522340, a 2225230300) In Eq. 1, q 222 represents the q value measured at 222 nm, l: the length of the cuvette, c: the concentration of the sample, and n: the number of amino acids in the sample protein. In Eq. 2, b 222 (522340) and a 222 (5230300) represent the [q ]222 values of the virtual proteins, in which all the secondary conformations are alpha-helixes and beta-sheets, respectively. In this study, n5104 (bovine cytochrome c), l50.2 cm, and c51031026 M. For ESI mass spectra, peroxynitrite-treated cytochrome c was separated from buffer salts with a reversed-phase HPLC (10Advp, Shimadzu, Kyoto, Japan) using H2O/acetonitrile (10—90% gradient, containing 0.1% trifluoroacetic acid) as a mobile phase. The separated cytochrome c was successively introduced into an ESI mass spectrometer (JMS-700, JEOL Co., Ltd., Tokyo, Japan). Measurement conditions for ESI mass spectra were as follows: desolvation chamber5250 °C, ring-lens voltage5100 V, acceleration voltage55 kV. The spectral data were converted to a molecular (11 charged ion) spectrum using a work station. Hydrolysis of Peroxynitrite-Treated Cytochrome c33) After treatment of cytochrome c (25 m M) with peroxynitrite (62.5 m M), 3.2 ml of the solution was mixed with acetonitrile (HPLC grade), vortexed for 3 s, and centrifuged at 7003g for 10 min. The precipitated cytochrome c was washed with 0.1 ml of 0.1 M sodium acetate (NaOAc) buffer (pH 7.2), reprecipitated with 0.16 ml of acetonitrile, vortexed, and centrifuged. The supernatant was discarded as described above, and washed once again. The sample was resuspended with 0.1 ml of 0.1 M NaOAc buffer, sonicated for 6 s, precipitated with 0.16 ml of acetonitrile once again, resuspended in 0.1 ml of 0.1 M NaOAc buffer, and sonicated once again. This procedure was carried out to remove residual nitrite/nitrate and other contaminants in the sample solution of peroxynitrite-treated cytochrome c. The sample solution was incubated at 50 °C for 15 h with 0.5 m l of 50 mg/ml dialyzed Pronase. Pronase was prepared by dialysis as follows. A solution of 50 mg/ml Pronase (1 ml) in 0.1 M NaOAc buffer (pH 7.2) was poured into a 15 kDa cut-off dialyzing tube (Spectra/Por7, Spectrum Laboratories, Houston, TX), and then dialyzed at 4 °C against three changes of 0.1 M NaOAc (pH 7.2) for 48 h (900 volume excess). The dialyzed Pronase was stored at 220 °C until used. Pronase was assumed to contribute less than 2% to the tyrosine recovered.33) The Detection of Nitrotyrosine in the Hydrolysate of PeroxynitriteTreated Cytochrome c The hydrolysate of peroxynitrite-treated cytochrome c obtained with Pronase was centrifuged at 1753g for 2 min, and the supernatant was analyzed by reversed-phase HPLC (JASCO Co., Ltd., Tokyo, Japan) with an octadecylsilyl (ODS) column (TSK-GEL ODS-80Ts, 4.63150 mm, Tosoh, Tokyo, Japan). As a mobile phase, 0.1 M potassium phosphate buffer (pH 3.5) containing 5 v/v% methanol was used. The eluent was monitored at 274 nm and collected when peaks were detected. The absorption spectra of the collected fractions were measured with a UV–visible spectrometer (Hitachi, Tokyo, Japan). For evaluating the molar ratio of 3nitro-L-tyrosine and L-tyrosine in the hydrolysate of peroxynitrite-treated cytochrome c, mixtures of various molar ratios of authentic 3-nitro-L-tyrosine and L-tyrosine were also analyzed by HPLC. Preparation of Mitochondrial Fraction34) Livers of rats (Wistar, male, ca. 200 g) were homogenized with a glass-Teflon Potter homogenizer in a solution containing 0.3 M mannitol, 10 mM potassium Hepes (pH 7.4), 0.2 mM EDTA (pH 7.2), and 0.1% fatty acid-free bovine serum albumin (BSA) in an ice bath. The supernatant (20003g) was collected, and mitochondria were isolated by centrifugation at 80003g for 5 min as a pellet. The isolated mitochondria were washed with the homogenizing buffer without EDTA, and suspended in the same buffer. To break down the outer-membrane of the isolated mitochondria, they were suspended in 2 mM potassium
Hepes buffer containing 10 mM KCl (as a 1.5 mg protein/ml suspension) at 0 °C for 20 min, and then washed with a potassium Hepes buffer containing 150 mM KCl for washing out the endogenous cytochrome c. The removal of endogenous cytochrome c was confirmed by the loss of potential without adding cytochrome c in the presence of a substrate. Membrane Potential Formation of Rat Mitochondria in the Presence of Peroxynitrite-Treated Cytochrome c34) To the suspension of mitochondria without endogenous cytochrome c prepared as described above (0.12 mg protein/ml) were added 4.2 mM succinate and 10 m M rhodamine 123. After the fluorescence intensity at 534 nm (excited at 505 nm) stabilized, 2 m l of 5 m M peroxynitrite-treated cytochrome c was added to the reaction mixture to initiate the electron transfer reaction. The decreasing fluorescence intensity at 534 nm was monitored. After the fluorescence intensity stabilized again, an additional aliquot of peroxynitrite-treated cytochrome c was added to the reaction mixture, and the fluorescence intensity was monitored again. The cumulative addition of peroxynitrite-treated cytochrome c was repeated until no change in the fluorescence intensity was observed even after addition of cytochrome c. The volumes added were 2, 2, and 6 m l of 5 m M peroxynitrite-treated cytochrome c, and then 9 and 10 m l of 50 m M peroxynitrite-treated cytochrome c in this order. The cumulative concentrations of peroxynitrite-treated cytochrome c were 10, 20, 50, 500, and 1000 nM after each addition. Using a cytochrome c solution containing decomposed peroxynitrite, the formation of mitochondrial membrane potential was achieved in the same way. Acknowledgments We thank Dr. Yoshihide Tsujimoto (Osaka University School of Medicine) and Dr. Shigeru Ohta (Hiroshima University School of Medicine) for suggestions and discussions about the measurement of mitochondrial membrane potential. This work was supported in part by Grants-in-Aid for Scientific Research (No. 10357021, 11672222, and 11771475) from the Ministry of Education, Science, Sports, and Culture, Japan, by a grant from the Cosmetology Research Foundation, and through Special Coordination Funds of the Science and Technology Agency of the Japanese Government. References 1) Bruijn L. I., Beal M. F., Becher M. W., Schulz J. B., Wong P. C., Price D. L., Cleveland D. W., Proc. Natl. Acad. Sci. U.S.A., 94, 7606—7611 (1997). 2) Kooy N. W., Lewis S. J., Royall J. A., Ye Y. Z., Kelly D. R., Beckman J. S., Critical Care Med., 25, 812—819 (1997). 3) Kaur H., Halliwell B., FEBS Lett., 350, 9—12 (1994). 4) Van der Vliet A. O., Neill C. A., Halliwell B., Cross C. E., Kaur H., FEBS Lett., 339, 89—92 (1994). 5) Galpern W. R., Matthews R. T., Beal M. F., Isacson O., Neuroreport, 7, 2639—2642 (1996). 6) Good P. F., Werner P., Hsu A., Olanow C. W., Perl D. P., Am. J. Physiol., 149, 21—28 (1996). 7) Good P. F., Hsu A., Werner P., Perl D. P., Olanow C. W., J. Neuropathol. Exp. Neurol., 57, 338—342 (1998). 8) Oleszak E. L., Zaczynska E., Bhattacharjee M., Butunoi C., Legido A., Katsetos C. D., Clin. Diagnostic Lab. Immunol., 5, 438—445 (1998). 9) Smith M. A., Richey Harris P. L., Sayre L. M., Beckman J. S., Perry G., J. Neurosci., 17, 2653—2657 (1997). 10) Su J. H., Deng G., Cotman C. W., Am. J. Physiol., 774, 193—199 (1997). 11) Kong S. K., Yim M. B., Stadtman E. R., Chock P. B., Proc. Natl. Acad. Sci. U.S.A., 93, 3377—3382 (1996). 12) Gow A. J., Duran D., Malcolm S., Ischiropoulos H., FEBS Lett., 385, 63—66 (1996). 13) Lizasoain I., Moro M. A., Knowles R. G., Darley-Usmar V., Moncada S., Biochem. J., 314, 877—880 (1996). 14) Thomson L., Trujillo M., Telleri R., Radi R., Arch. Biochem. Biophys., 319, 491—497 (1995). 15) Sharpe M. A., Cooper C. E., J. Biol. Chem., 273, 30961—30972 (1998). 16) Liu X., Kim C. N., Yang J., Jemmerson R., Wang X., Cell, 86, 147— 157 (1996). 17) Yang J., Liu X., Bhalla K., Kim C. N., Ibrado A. M., Cai J., Peng T. I., Jones D. P., Wang X., Science, 275, 1129—1132 (1997). 18) Kluck R. M., Bossy-Wetzel E., Green D. R., Newmeyer D. D., Science, 275, 1132—1136 (1997). 19) Cassina A., Thomson L., Alvarez M. N., Cayota A., Radi R., “The Annual Meeting of The Oxygen Society,” San Francisco, U.S.A., Nov.
1554
20)
21)
22)
23) 24) 25) 26)
Vol. 49, No. 12 1997, Abstract papers, 77, 2-33. Cassina A. M., Hodara R., Souza J. M., Thomson L., Castro L., Ischiropoulos H., Freeman B. A., Radi R., J. Biol. Chem., 275, 21409— 21415 (2000). Nakagawa H., Ohishima Y., Ikota N., Majima H., Ozawa T., “The 9th Biennial Meeting International Society for Free Radical Research,” Sao Paulo, Brasil, Sep. 1998, Abstracts of papers, 109 (PS 04-34). Nakagawa H., Ohshima Y., Ikota N., Shimizu S., Tsujimoto Y., Ozawa T., “The 5th Annual Meeting of the Oxygen Society,” Washington, D.C., U.S.A., Nov. 1998, Free Radic. Biol. Med., 25, S1 s63-171. Nakagawa H., Sumiki E., Ikota N., Matsushima Y., Ozawa T., Antiox. Redox Signaling, 1, 239—244 (1999). Nakagawa H., Sumiki E., Takusagawa M., Ikota N., Matsushima Y., Ozawa T., Chem. Pharm. Bull., 48, 261—265 (2000). Alvarez B., Rubbo H., Kirk M., Barnes S., Freeman B. A., Radi R., Chem. Res. Toxicol., 9, 390—396 (1996). Takano T., Kallai O. B., Swanson R., Dickerson R. E., J. Biol. Chem., 248, 5234—5255 (1973).
27) 28) 29) 30) 31)
32) 33)
34)
Bruice T. C., Gregory M. J., Walters S. L., J. Am. Chem. Soc., 90, 1612—1619 (1968). Cuatrecasas P., Fuchs S., Anfinsen C. B., J. Biol. Chem., 242, 4759— 4767 (1967). Zhang L., Yu L., Yu C. A., J. Biol. Chem., 273, 33972—33976 (1998). Demin O. V., Kholodenko B. N., Skulachev V. P., Mol. Cell Biochem., 184, 21—33 (1998). Pryor W. A., Cueto R., Jin X., Koppenol W. H., Ngu-Schwemlein M., Squadrito G. L., Uppu P. L., Uppu R. M., Free Radic. Biol. Med., 18, 75—83 (1995). Pobner H., Anal. Chem., 33, 1423—1426 (1961). Shigenaga M. K., Lee H. H., Blount B. C., Christen S., Shigeno E. T., Yip H., Ames B. N., Proc. Natl. Acad. Sci. U.S.A., 94, 3211—3216 (1997). Shimizu S., Eguchi Y., Kamiike W., Funahashi Y., Mignon A., Lacronique V., Matsuda H., Tsujimoto Y., Proc. Natl. Acad. Sci. U.S.A., 95, 1455—1459 (1998).