Cerebral Cortex Advance Access published August 22, 2016 Cerebral Cortex, 2016; 1–12 doi: 10.1093/cercor/bhw238 Original Article
ORIGINAL ARTICLE
Functional Network Dynamics of the Language System
1
Department of Bioengineering, University of Pennsylvania, Philadelphia, PA 19104, USA, 2Department of Psychology, University of Pennsylvania, Philadelphia, PA 19104, USA, 3Department of Brain and Cognitive Sciences, Massachusetts Institute of Technology, Cambridge, MA 02139, USA, 4Department of Psychiatry, Harvard Medical School, Boston, MA, 02115, USA, 5Department of Psychiatry, Massachusetts General Hospital, Charlestown, MA 02129, USA, and 6Department of Electrical & Systems Engineering, University of Pennsylvania, Philadelphia, PA 19104, USA Address correspondence to Email:
[email protected]
Abstract During linguistic processing, a set of brain regions on the lateral surfaces of the left frontal, temporal, and parietal cortices exhibit robust responses. These areas display highly correlated activity while a subject rests or performs a naturalistic language comprehension task, suggesting that they form an integrated functional system. Evidence suggests that this system is spatially and functionally distinct from other systems that support high-level cognition in humans. Yet, how different regions within this system might be recruited dynamically during task performance is not well understood. Here we use network methods, applied to fMRI data collected from 22 human subjects performing a language comprehension task, to reveal the dynamic nature of the language system. We observe the presence of a stable core of brain regions, predominantly located in the left hemisphere, that consistently coactivate with one another. We also observe the presence of a more flexible periphery of brain regions, predominantly located in the right hemisphere, that coactivate with different regions at different times. However, the language functional ROIs in the angular gyrus and the anterior temporal lobe were notable exceptions to this trend. By highlighting the temporal dimension of language processing, these results suggest a trade-off between a region’s specialization and its capacity for flexible network reconfiguration. Key words: angular gyrus, dynamic networks, flexibility, language, language comprehension, lateralization, modularity, networks
Introduction High-level language processing recruits an extended set of cortical regions in the human brain (Blank et al. 2014; Tie et al. 2014) that are distinct from those recruited for other cognitive functions (Fedorenko et al. 2011; Blank et al. 2014). In the earliest reports of brain damaged patients with language deficits, only a few of those regions were initially identified (Dax 1865; Broca 1861; Wernicke 1874). More recent work in functional
neuroimaging has extended these findings by revealing the breadth of the language system’s spatial distribution, which is now thought to span the frontal, temporal, and parietal cortices (Binder et al. 1997; Fedorenko and Thompson-Schill 2014) (see Luria (1965); Mesulam (1990) for early discussions). Furthermore, the distributed nature of brain regions that support language processing has been observed not only in task-based studies (Binney et al. 2010; Fedorenko et al. 2010; Binney and Ralph 2015),
© The Author 2016. Published by Oxford University Press. This is an Open Access article distributed under the terms of the Creative Commons Attribution Non-Commercial License (http://creativecommons.org/ licenses/by-nc/4.0/), which permits non-commercial re-use, distribution, and reproduction in any medium, provided the original work is properly cited. For commercial re-use, please contact
[email protected]
Downloaded from http://cercor.oxfordjournals.org/ at Goteborgs Universitet on September 9, 2016
Lucy R. Chai1, Marcelo G. Mattar1,2, Idan Asher Blank3,4, Evelina Fedorenko3,4,5, and Danielle S. Bassett1,6
2
|
Cerebral Cortex
A
tools from the field of network science (Porter et al. 2009). These tools can be used to investigate how the functional architecture of a brain network changes during task performance (Bassett et al. 2011, 2013b, 2015; Doron et al. 2012; Ekman et al. 2012; Mantzaris et al. 2013), evolves during development (Gu et al. 2015), or is altered in disease (Weiss et al. 2011; Siebenhuhner et al. 2013; Calhoun et al. 2014). These applications have suggested that certain brain regions show relatively constant patterns of interaction (core) plausibly necessary for task performance, while others display relatively variable patterns of interaction (periphery) plausibly only supportive of task performance (Bassett et al. 2013b). These network-science tools thus provide a nuanced, time-dependent description of brain network dynamics that could provide important insight into the functional architecture of the language network. We use these tools to test the hypothesis that the language network consists of stable core regions and flexible periphery regions (Fedorenko and Thompson-Schill 2014), and that the core is located within the LH. To do so, we acquired fMRI data on two language tasks: (i) a semantic relatedness judgment task (Binney et al. 2010), and (ii) a naturalistic story comprehension task. We computed correlations between BOLD signals for pairs of language regions in the two hemispheres in overlapping time windows (Fig. 1). We observed a clear difference between hemispheres across datasets, with core regions concentrated in the LH and periphery regions concentrated in the RH. Notable exceptions were the language functional ROIs in the angular gyrus and the anterior temporal lobe, which exhibited higher flexibility within the network. These dynamic patterns of functional interactions place important architectural constraints on the language network, and imply critical functional distinctions among regions both within the LH and between hemispheres.
B
w2 BOLD Magnitude
w1
50 w1
w2
100
150
200
Time (s)
D w1
Regions
C
w2
1
Pearson‘sr
0.8
Re
gio
ns
0.6 0.4 0.2 0
Community 1
Community 2
Community 3
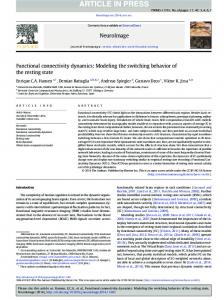
Figure 1. Schematic overview of the approach. (A) Sixteen parcels were used to constrain the definition of functional regions of interest (fROIs). fROIs were defined individually within each subject by intersecting each parcel (pictured) with an individual’s activation map for the language localizer contrast (sentences > nonwords (Fedorenko et al. 2010)) and selecting the top 10% of voxels within each parcel. (B) BOLD fMRI signal time-courses during the tasks (semantic relatedness judgment and story comprehension) were extracted for each subject from each of the sixteen fROIs (averaging across the voxels within each fROI) and divided into a series of time windows (w1, w2, etc.). (C) Functional correlations between each pair of fROIs in each time window were estimated using a Pearson correlation coefficient between regional activity signal time-courses. (D) Subject-specific functional brain networks were constructed from the functional correlation matrices by using timeresolved clustering methods that group the fROIs into modules that behave similarly over time. See also Fig. S1 and S2 for supporting information related to the optimal selection of parameters for the time-resolved clustering methods, and the reliability of results across different parameters. Also see Fig. S3 for reliability of results across time window length and time window placement.
Downloaded from http://cercor.oxfordjournals.org/ at Goteborgs Universitet on September 9, 2016
but also during naturalistic cognition paradigms (Tomasi and Volkow 2012; Muller and Meyer 2014; Zhu et al. 2014). This distributed system displays some degree of hemispheric lateralization. Indeed, evidence from dichotic listening paradigms (Kimura 1961), the Wada test (Woermann et al. 2003; Janecek et al. 2013), aphasia (Dax 1865), and split-brain patients (Gazzaniga 2005) point to a left-hemisphere (LH) dominance of language processing that is supported by neuroimaging studies (Springer et al. 1999; Woermann et al. 2003; Janecek et al. 2013). Yet, imaging studies have also reported activations in the right-hemisphere (RH) homologs of the left-hemisphere language regions for a variety of language tasks, suggesting that the right hemisphere also plays some role in language processing (Binder et al. 1997; Fedorenko et al. 2010; Price 2012). Despite the evidence for bilateral involvement, our understanding of the relative contributions of left vs. right hemisphere brain regions, and the dynamics of their within vs. between-hemisphere interactions, remains limited. One recent and potentially useful theoretical framework focuses on the fact that functional interactions between brain regions plausibly change over time, and suggests that patterns of inter-regional communication may determine the degree of any given region’s functional specialization. In particular, regions that are only transiently engaged during linguistic processing may support domain-general processes (Bassett et al. 2013b), whereas regions that are stably engaged may support processes that are specific to the language domain (Fedorenko and Thompson-Schill 2014). We build on this general notion to posit that lateralization may reflect differences between left and right hemisphere regions in the flexibility of their involvement in language processing, which may in turn reflect differing degrees of functional specialization. We test this hypothesis by directly examining the dynamic reconfigurations of the language system using computational
Functional Network Dynamics of the Language System Chai et al.
Methods Participants Twenty-two individuals participated in the study: 12 participants were scanned while performing a semantic relatedness judgment task, and 10 were scanned while performing a story comprehension task. All participants were right-handed native speakers of English from MIT and the surrounding Cambridge/Boston community. The average age of the sample was 25.4, with a range of 20 to 43, and the sample included 10 females. All participants gave informed consent in accordance with the requirements of MIT’s Committee on the Use of Humans as Experimental Subjects (COUHES) and were paid for their participation.
Design, Materials, and Procedure
Critical Tasks The semantic relatedness judgment task was adapted from Binney et al. (2010). Participants saw a target word (in the upper half of the screen; e.g., ROGUE) and three other words (in the bottom half of the screen; e.g., POLKA, SCOUNDREL and GASKET). They were asked to choose a word among the three words on the bottom that was closest in meaning to the target word by pressing one of three buttons on a button box. In the control condition, participants saw a target number (in the upper half of the screen) and three other numbers (in the bottom half of the screen) and were asked to choose a number among the three on the bottom
3
that was closest in value to the target number. Each trial began with a fixation cross presented for 1000 ms, followed by the presentation of the stimuli (for 4000 ms). Experimental blocks lasted 20 s (with 4 trials per block) and fixation blocks lasted 16 s. Each run consisted of 16 experimental blocks (8 per condition) and 5 fixation blocks and lasted 400 s (6 min, 40 s). Condition order was counterbalanced across runs. Participants completed 2 runs. In the story comprehension task, participants listened to 4 to 6 stories over MR compatible headphones. Stories each lasted between 4.5 and 6 min and were constructed from existing, publicly available texts such as Wikipedia articles or fairy tales. Stories were recorded by one male and one female native English speaker. After each story, participants answered six difficult comprehension questions in an alternative, forcedchoice format. These questions were included to assess the level of the participants’ engagement with the stories. Participants produced accurate responses on 83.09% of questions. Each scan began and ended with 16 seconds of fixation, which were removed from all following analyses. In the main text, we focus on the second story in the set, which was a story that all subjects heard; analyses of other stories are described in the Supplementary Material.
fMRI Methods Data Acquisition Structural and functional data were collected on a whole-body 3 Tesla Siemens Trio scanner with a 32-channel head coil at the Athinoula A. Martinos Imaging Center at the McGovern Institute for Brain Research at MIT. T1-weighted structural images were collected in 176 sagittal slices with 1 mm isotropic voxels (TR = 2530 ms, TE = 3.48 ms). Functional, blood oxygenation level dependent (BOLD) data were acquired using an echo planar imaging sequence (with a 90° flip angle and using generalized auto-calibrating partially parallel acquisition with an acceleration factor of 2), with the following acquisition parameters: thirty-one 4 mm thick near-axial slices acquired in interleaved order (with 10% distance factor), 2.1 mm × 2.1 mm in-plane resolution, FoV in the phase encoding (A » P) direction 200 mm and matrix size 96 mm × 96 mm, TR = 2000 ms and TE = 30 ms. The first 10 s of each run were excluded to allow for steady state magnetization. Data Preprocessing and Modeling MRI data were spatially preprocessed using SPM5 (Statistical Parametric Mapping; www.fil.ion.ucl.ac.uk/spm). Each subject’s functional data were motion corrected and smoothed with a 4 mm full width at half-maximum Gaussian filter. Prior to smoothing, the semantic relatedness judgment task data set was normalized into a common brain space (the Montreal Neurological Institute (MNI) template) and resampled into 2 mm isotropic voxels. The story comprehension data set was analyzed in native, functional space as reported in Blank et al. (2014). The anatomical image of each subject was segmented into three probability maps, denoting areas of gray matter, white matter, and cerebrospinal fluid, and these maps were then coregistered to the native functional space. Data for the language localizer task and the semantic relatedness judgment task were modeled using a general linear model with a boxcar regressor convolved with a canonical hemodynamic response function. Data for the story comprehension runs were analyzed using the CONN toolbox (Whitfield-Gabrieli and Nieto-Castanon 2012) with default
Downloaded from http://cercor.oxfordjournals.org/ at Goteborgs Universitet on September 9, 2016
Language Localizer Task Every participant performed a language localizer task (Fedorenko et al. 2010), which enabled us to define a set of regions of interest sensitive to high-level linguistic processing. Participants read sentences (e.g., IN THE EVENING THE BOY-SCOUTS MADE A FIRE AND BAKED SOME POTATOES) and lists of unconnected pronounceable nonwords (e.g., TROP PRELL ALGOWED CRE LEATED GOR SULRIST VIMENED OG LIPE GOR CRE) in a blocked design. Each stimulus consisted of 12 words or nonwords. Language materials can be found at http://web.mit.edu/evelina9/www/ funcloc/funcloc_localizers.html and details on how they were constructed can be found at Fedorenko et al. (2010). Stimuli were presented in the center of the screen, one word or nonword at a time, and at the rate of 350 ms per word or nonword. Each stimulus was followed by a 300 ms blank screen, a memory probe (presented for 1000 ms), and again a blank screen for 500 ms, for a total trial duration of 6 s. Participants were asked to decide whether the probe appeared in the preceding stimulus by pressing one of two buttons on a button box. The contrast of sentences > nonwords broadly targets high-level language processes, including processing of individual word meanings and combinatorial semantic and syntactic processing (Fedorenko et al. 2010, 2012). In previous work, we established that this localizer contrast is robust to changes in materials, task, and modality of presentation (Fedorenko et al. 2010; Fedorenko 2014). Experimental blocks lasted 18 s (with 3 trials per block) and fixation blocks also lasted 18 s. Each run consisted of 16 experimental (8 per condition) and 5 fixation blocks and lasted 378 s (6 min, 18 s). Condition order was counterbalanced across runs. Participants completed 2 runs. Five of the participants completed a slightly different version of the language localizer, where – in addition to the sentences and nonword blocks – a third condition (lists of unconnected words) was included. Trial and block timing was identical, but each run consisted of 18 experimental (6 per condition) and 4 fixation blocks and lasted 396 s (6 min, 36 s). Participants completed 3 runs.
|
4
|
Cerebral Cortex
parameters, unless otherwise specified. Signal fluctuations due to nonneuronal (e.g., respiratory and cardiac) activity were removed by estimating the first five temporal principal components of the BOLD signal time-courses extracted from the white matter and from the CSF, and then regressing these signals out of each voxel’s time-course. The first of six principal components of the six motion parameters estimated during offline motion correction were also regressed out of the time series, as well as their first temporal derivative. All following analyses were performed on the residual BOLD time series.
Dynamic Network Methods Network Construction We began by constructing a dynamic functional brain network that represents the time-dependent functional interactions among N = 16 brain regions. For each participant and each run of either experiment, the preprocessed BOLD signal was parsed into 40 s time windows that overlapped with contiguous windows by 50% (Shirer et al. 2012; Leonardi and Van De Ville 2015). We computed the absolute value of the Pearson correlation coefficient between the BOLD signals from each pair of fROIs, resulting in an N × N adjacency matrix for each time window. For each participant and each run, we coupled the individual adjacency matrices at all T time windows in a multilayer network (Mucha et al. 2010; Bassett et al. 2011, 2013b), where each layer represents a different time window and where each fROI is connected to itself in neighboring time windows by so-called identity links. In the semantic relatedness judgment task, we used T = 19 overlapping time windows. In the story comprehension task, we used T = 12 overlapping time windows (we truncated some of the longer stories to make all the story runs identical in length). Dynamic Community Detection We used dynamic community detection techniques (Mucha et al. 2010) to extract groups of brain regions that are functionally connected with one another, and to characterize how they reconfigure over time (Bassett et al. 2011, 2013b, 2015). Intuitively, community detection techniques aim to categorize network nodes—in our case language fROIs—into densely interconnected groups known as communities or modules. In this context, community detection algorithms partition the language network into modules that reveal similar BOLD activity over time (Bassett et al. 2015) and are more strongly correlated among themselves than they are to fROIs in other communities (Bassett et al. 2015). Specifically, we maximize a quality function called the multilayer modularity Q, with the associated maximum of Q called the maximum modularity. High values of Q indicate that the nodes of the network can be partitioned sensibly into modules with similar BOLD activity (see Supplement for additional mathematical details). Dynamic Network Statistics We used three different network statistics to quantitatively characterize the functional interactions among brain regions over time: (i) module allegiance which provides a summary of the consistency with which fROIs are assigned to communities (Bassett et al. 2015), (ii) flexibility which provides a summary of the rate at which brain regions change their allegiance to communities (Bassett et al. 2011), and (iii) laterality which provides a summary of how lateralized communities are (Doron et al. 2012). See below for mathematical details. Module Allegiance In the module allegiance matrix, P, each element Pij gives the relative frequency (across participants, time-windows, optimizations, and runs) that regions i and j were assigned to the same community (Bassett et al. 2015). The module allegiance of two nodes will be 1 if they are always in the same community
Downloaded from http://cercor.oxfordjournals.org/ at Goteborgs Universitet on September 9, 2016
Defining Group-Constrained, Subject-Specific Functional Regions of Interest (fROIs) The putative language network was defined for each participant individually. Specifically, each participant’s activation map for the localizer contrast (sentences > nonwords) was combined with group-based masks that served as spatial constraints on the individual’s activations. These masks, which we call parcels (see Fig. 1A), represented regions within which all or most individuals in earlier studies showed activation for the localizer contrast (Fedorenko et al. 2010). For the story comprehension data set, the parcels were projected onto each participant’s native functional space. The eight left-hemisphere parcels cover extended portions of the frontal, temporal, and parietal cortices. The intersection of individualized maps with a group-level map allows one to determine which regions correspond across individuals (Fedorenko et al. 2010). In each participant, eight language-related functional regions of interest (fROIs) were created by combining the participant’s unthresholded t-map for the sentences > nonwords contrast with the parcels. These included three parcels in the frontal lobe (the LIFG and LIFGorb parcels located within the inferior frontal gyrus, and the LMFG parcel located within the posterior portion of the middle frontal gyrus), and five parcels spanning the lateral surfaces of the temporal and parietal cortices from the anterior part of the temporal lobe (the LAntTemp parcel), to the middle (the LMidAntTemp and LMidPostTemp parcels) and posterior parts (the LPostTemp parcels), and extending into the angular gyrus (the LAngG parcel). We note that these 8 fROIs—a subset of the original 13 parcels—are canonically implicated in language processing, and have been used extensively in prior work (Fedorenko et al. 2012; Blank et al. 2014, 2016). The subject data were intersected with each parcel, and the 10% of voxels with the highest contrast t-values falling within the parcel were defined as a functional region of interest (fROI). To investigate bilateral processing, we reflected the parcels across the x-axis to capture the right hemisphere homologues of left-lateralized language regions. To define the righthemisphere fROIs, we again use the fixed-percentage approach (taking the 10% of voxels with the highest contrast t-values falling within the parcel), which ensures that a fROI can be defined in every subject for all the parcels, and that fROIs are constant in size across subjects and across hemispheres. The reliability of the language localizer effect in the current data sets was assessed using across-runs cross-validation (Nieto-Castañón and Fedorenko 2012). The sentences >nonwords effect was highly reliable for all fROIs in both the semantic relatedness judgment dataset (left hemisphere fROIs: t-statistics between 4.65 and 11.00, p-values less than 0.004; right hemisphere fROIs: t-statistics between 2.25 and 7.99, p-values less than 0.05) and in the story comprehension dataset (left hemisphere fROIs: t-statistics between 4.27 and 12.1, p-values less than 0.005; right hemisphere fROIs: t-statistics between 2.11 and
7.42, p-values less than 0.05). These results validate the use of these fROIs—both in left and right hemispheres—as language processing areas.
Functional Network Dynamics of the Language System Chai et al.
and therefore tend to be functionally coherent with one another, and will be 0 if they are never in the same community. We computed the module allegiance separately for the semantic relatedness judgment task and for the story comprehension task.
Laterality We used the notion of community laterality to quantify the extent to which the communities identified by the multilayer community detection algorithm are largely interhemispheric vs. largely localized within one hemisphere. The laterality of a single community c within a network is defined as (Doron et al. 2012; Lohse et al. 2013):
Λc =
|Nr − Nl| , Nc
(1)
where Nr and Nl are the number of nodes located in the left and right hemispheres respectively, and Nc is the total number of nodes in c. The value of laterality, Λc, ranges between (i) zero, which indicates that the number of nodes in the community are evenly distributed between the two hemispheres, and (ii) unity, which indicates that all nodes in the community are located within a single hemisphere. Statistical Null Models When examining the dynamics of functional brain networks, it is important to compare extracted statistics (such as the module allegiance, flexibility, or laterality) to those expected in a random network null model (Bassett et al. 2013a). We considered three different null models (temporal, nodal, and static), separately for the semantic relatedness judgment task and the story comprehension task, to test several distinct hypotheses. Temporal Null Model We constructed a dynamic null model network that enables us to contrast the results we obtained directly from the task-based neuroimaging data against the null hypothesis that there is no smooth network reconfiguration between consecutive time windows (Bassett et al. 2013a). This temporal null model was constructed by shuffling the layers in the multilayer network uniformly at random across time (Bassett et al. 2011). Therefore, the temporal null model preserves connectivity within a network layer, but destroys dependencies between network layers over time. To determine if there were significant temporal changes in the community structure, we computed 100 temporal null models for each subject’s multilayer network
5
constructed from fMRI data and then performed dynamic community detection 100 times on each temporal null model. We used these temporal null networks to determine whether a brain region had more or less flexibility than expected. To examine the statistical significance of brain region flexibility, we computed the average flexibility of brain regions in the partitions extracted from the optimizations of the multilayer modularity quality function on the temporal null model networks. We then compared the network flexibility values of the temporal null model networks across all optimizations and participants to create an expected distribution of flexibility values. We define the temporal core as those nodes that have flexibility values more than one standard deviation below the average flexibility of the temporal null model networks, and we define the temporal periphery as those nodes that have flexibility values more than one standard deviation above the average flexibility of the temporal null model networks (Bassett et al. 2013b). Nodal Null Model We constructed a null model network that enables us to contrast the results we obtained directly from neuroimaging data against the null hypothesis that the roles of all regions in the network are indistinguishable (Bassett et al. 2011). We shuffled the interlayer edges connecting nodes in one layer uniformly at random to the nodes in the next layer (Bassett et al. 2013a): rather than connecting node i in layer l to node i in layer l + 1, we connected node i in layer l to node j in layer l + 1. We computed 100 null models per subject to create the nodal null model networks for each multilayer network constructed from fMRI data. We used the nodal null model to determine whether the module allegiance values were higher or lower than expected. To examine the statistical significance of the module allegiance matrix, we performed 100 optimizations of dynamic community detection on each nodal null model network. Then, we constructed a module allegiance matrix based on the optimal partitions of the nodal null model networks into communities, and we compared those values to the values observed in the module allegiance matrix constructed from the neuroimaging data. We computed the nodal null model module allegiance matrix for each subject, averaged over all optimizations, scans, and model instances, and measured the mean of module allegiance in the left hemisphere, right hemisphere, and between hemispheres. We then compared these three metrics for each subject to corresponding metrics in the real data. This comparison allowed us to verify that the hemisphere that each fROI belonged to played a significant role in determining its interactions with other fROIs. Static Null Model Finally, we contrasted our results against the null hypothesis that functional brain network architecture is stable across time. To that end, we constructed a static null model to investigate how the actual network dynamics compared to those of a null network that is dynamically invariant. We selected an adjacency matrix at random and replicated it a number of times to match the number of time windows in the dynamic (multilayer) network. We performed this matrix selection and matrix replication procedure 100 times separately for each subject. Then, we performed dynamic community detection 100 times for each static null model, and then examined the resulting module allegiance matrix. We hypothesize that a timeinvariant network would yield module allegiance values of
Downloaded from http://cercor.oxfordjournals.org/ at Goteborgs Universitet on September 9, 2016
Flexibility The flexibility of a node is defined as the probability that a node changes its community assignment across consecutive time windows (Bassett et al. 2011). The total number of possible changes corresponds to the number of adjacent partition pairs in the multilayer network (i.e., one less than the number of time windows), or 18 adjacent pairs for the semantic relatedness judgment task and 11 adjacent pairs for the story comprehension task. High values of flexibility indicate greater network reconfiguration. Consistent with Bassett et al. (2011, 2013b), we define the flexibility of the network as a whole (i.e., of the language network in this context) as the mean flexibility over all nodes in the network (here, N = 16). We then averaged flexibility across all participants, runs, and optimizations, to obtain a representative statistic for the entire group (Bassett et al. 2013b).
|
Cerebral Cortex
A
1
10 15 5
B
We first asked whether there were sets of brain regions that consistently displayed coherent activity with one another during language processing, forming network communities. To quantify the consistency with which communities were expressed during task performance, we calculated the module allegiance between any two brain regions, which is a summary of the between-region interactions (see Methods; Fig. 2A) (Bassett et al. 2015). During the semantic relatedness judgment task, we observed a salient and non-trivial feature in the module allegiance matrix: a clear division between the left hemisphere regions and the right hemisphere regions. The separation between these two hemispheres indicates that regions in opposite hemispheres are less likely to display coherent BOLD activity with one another during task performance than regions within the same hemisphere (Bassett et al. 2015). We performed a similar set of calculations for the story comprehension task and similarly observed a separation between the two hemispheres using the module allegiance calculation (see Supplementary Material, Fig. S4). It is important to ask whether the observed separation between the two hemispheres in terms of their dynamics could simply have been driven by stochastic variations in algorithmic output. In particular, the time-resolved clustering approach that we utilize to estimate the module allegiance matrix attempts to solve an NP-complete problem with a clever heuristic. If the dynamics we observed were neurophysiological in nature, rather than algorithmic, then we would expect that the assignment of brain regions to modules over time would vary more than the assignment of brain regions to modules over multiple implementations of the heuristic (which we refer to as optimizations; see Methods). Using the Rand z-score (Traud et al. 2011), we observed that the partition similarity in different optimizations was significantly higher than that in different time windows (two-sample t-test: t22 = 9.12, p < 0.001, Hedges’ g measure for effect size: g = 3.59, see Supplementary Material for similar analysis with story comprehension task) (Fig. 2A). These results support the conclusion that variation across time impacts the structure of the module allegiance matrix more than differences between optimizations.
5
10
10 Regions
10 15 10 Regions
15
Different Time Windows
Static Null Model Real Data Null Model
1.0 0.5 0
0
1
0.4 0.2 0
0
0.5
Nodal Null Model
0.6
1
5
x 10
1.5
0
15
Nodal Null Model
5
2.0
Count
5
15
Regions
Consistent Functional Modules within a Dynamically Reconfiguring Network Landscape
Different Optimizations 1
5
4 3
Static Null Model
C
Results
15
Module Allegiance
IFGorb IFG MFG AntTemp MidAntTemp MidPostTemp PostTemp AngG
10 Regions
5
0
Module Allegiance
Inferior Frontal Gyrus Orbital Inferior Frontal Gyrus Middle Frontal Gyrus Anterior Temporal Middle Anterior Temporal Middle Posterior Temporal Posterior Temporal Angular Gyrus
Regions
Abbreviation
6
Real Null Real Null Left Right
Real Null Between
Figure 2. Salient modular architecture of the language network during the semantic relatedness judgment task. (A) We use network partitions, obtained from time-resolved clustering algorithms which assign each fROI to a community for each time interval, to calculate a module allegiance matrix that reveals a distinct hemispheric division (left). We find that partitions from different time windows are less similar than partitions from different optimizations, suggesting that the variation across time impacts the module allegiance structure more than the variation across optimizations (right). Boxplots illustrate variation between subjects. (B) The module allegiance matrix of a representative static null model, created from a single multilayer network and averaged over 100 optimizations, primarily consists of 1’s and 0’s; intermediate values are due to the non-deterministic nature of the optimizations (left). For mathematical details regarding null model construction, see Methods. We compared the distributions of module allegiance values for the real data and a static null model, for module allegiance matrices of all subjects, optimizations, and runs (right). (C) The module allegiance matrix of a representative nodal null model, created from a single multilayer network and averaged over 100 optimizations, contains no hemispheric division (left). The average value of module allegiance in the left hemisphere and right hemisphere is significantly different between the null model and real module allegiance matrices for each subject (right). We observed consistent results in data acquired during the story comprehension task; see Fig. S4 in the Supplementary Material.
It is also important to ask whether the dynamics that we observe in the true language network is more than would be expected in an appropriate null model. To address this question, we create a static null model network that represents the null hypothesis that there is no difference between the functional connectivity pattern in one time window and that in the next time window (see Methods). We observed significant differences in the distributions of module allegiance values between the real data and the null model (two-sample ks-test p = 0, k = 0.440, Fig. 2B). See Supplementary Material and Fig. S4 for similar analysis with the story comprehension task. These results suggest that the language network is indeed dynamically varying; the associations between ROIs in the network are constantly changing throughout the duration of the scan.
Downloaded from http://cercor.oxfordjournals.org/ at Goteborgs Universitet on September 9, 2016
Brain Region
7 Rand z-score
5
Average
either 1 or 0 (i.e., two fROIs are either always in the same community or never in the same community). In contrast, we hypothesized that a time-variant network would yield module allegiance values in between the two extremes. Thus, we expected that a comparison between module allegiance matrices from real data and from null data would yield significantly different distributions.
Module Allegiance
|
Regions
6
Functional Network Dynamics of the Language System Chai et al.
In both the semantic relatedness judgment task and the story comprehension task, we observed a comparable modular structure, with an apparent separation between the left and right hemispheres, reflecting a functional division inherent to the language network (see Fig. 3A). We next asked whether the left and right hemispheres played different roles within the wider network. For both the semantic relatedness judgment and story comprehension tasks, we calculated the average module allegiance for each hemisphere and between the hemispheres (diagonal and offdiagonal quadrants in Fig. 3A). We found that values derived from connections between hemispheres were significantly lower than those calculated within each hemisphere (two-sample t-test semantic relatedness judgment task: left, between t22 = 7.30, p < 0.001; right, between t22 = 7.44, p < 0.001; story comprehension task left, between t18 = 5.44, p < 0.001; right, between t18 = 4.41, p < 0.001; see Fig. 3, also see Fig. S5 for similar analysis with additional stories). The left hemisphere tends to have higher average values of module allegiance compared to the right hemisphere, although the effect is significant only in the story comprehension task (two-sample t-test for left - right, semantic relatedness judgment task t22 = 1.14, p = 0.27; story comprehension task t18 = 2.31, p = 0.03). These results indicate that the ROIs in the left hemisphere tend to associate with the same regions more consistently during language processing than ROIs in the right hemisphere. To further assess this apparent asymmetry in functional connectivity, we use a statistical approach that estimates the laterality of functional communities in the language network (see Methods). The community laterality index (Λc) measures the degree to which a community is confined to one hemisphere (laterality close to 1) or spreads across both hemispheres (laterality close to 0) (Doron et al. 2012; Lohse et al. 2013). We observed consistently high values of laterality in the language network (see Fig. 3C-D). Specifically in the left hemisphere, for the semantic relatedness judgment task, the inferior frontal gyrus, middle frontal gyrus, inferior frontal gyrus orbital, middle anterior temporal, middle posterior temporal,
Word/Number
0.6 0.4
1 Module Allegiance
0.8 Regions
Module Allegiance
Regions
Story
1
0.2 0
Regions
0.8 0.6 0.4 0.2 0
Regions
Average Module Allegiance
B 0.6 0.5 0.4 0.3 0.2 0.1 0 LH C
RH BTW Word/Number
LH
RH Story
BTW
1 0.8
Laterality
Laterality of the Language Network across Different Tasks
A
7
Community 1 Community 2
0.6
Community 3 Community 4
0.4
Average 0.2 0 Word/Number
Story
D
Word/Number
Story
Figure 3. Language network laterality. (A) A comparison of module allegiance between the semantic relatedness judgment task and a story comprehension task revealed a similar lateralized structure of the language network. (B) Module allegiance values within each hemisphere and between hemispheres for both tasks, with task conditions shown in blue and resting state shown in gray. Boxplots illustrate distribution of average module allegiance values across subjects. (C) Laterality index of detected communities in the language network. A value close to 1 indicates a highly lateralized system. (D) Anatomical distribution of the observed communities. Each community is colored by cluster, corresponding to the laterality index of the community in panel (C).
and posterior temporal regions consistently display similar BOLD activity with a laterality of Λc = 1. Similarly in the story comprehension task, the community containing the inferior frontal gyrus, middle frontal gyrus, inferior frontal gyrus orbital, middle posterior temporal, and posterior temporal regions consistently display similar BOLD activity with a laterality of Λc = 1. Meanwhile, regions in the right hemisphere predominately associate with other ROIs in the right hemisphere. In the semantic relatedness judgment task, the right inferior frontal gyrus orbital, right inferior frontal gyrus, right anterior temporal, right middle anterior temporal, and right middle posterior temporal regions form a community with Λc = 1. In the story comprehension task, the right inferior frontal gyrus, right inferior frontal gyrus orbital, and the right middle posterior temporal regions form a community with Λc = 1.
Downloaded from http://cercor.oxfordjournals.org/ at Goteborgs Universitet on September 9, 2016
Next we asked whether the anatomical specificity of regional roles within this dynamic network were significant. To address this question, we constructed 100 nodal null models that permute the identity of individual regions within the network, consistent with the null hypothesis that all brain regions play similar network roles (Bassett et al. 2013a), regardless of hemisphere (see Methods). In the semantic relatedness judgment task, we observed that the mean module allegiance was significantly smaller in the null model than in the real data for the left and right hemispheres (paired t-test left: t11 = 8.40, p < 0.001, right: t11 = 9.92, p < 0.001, Hedges’ g left: g = 3.15, right: g = 3.41). However, the difference was not significant between hemispheres (paired t-test t11 = −0.32, p = 0.75, Hedges’ g: g = −0.12, Fig. 2C), suggesting that the interactions among brain regions in different hemispheres may not be significantly different from random interactions. These results suggest that the division between hemispheres in the real module allegiance matrix depends on the hemispherical roles of brain regions in the network; permuting the identity of the brain regions across hemispheres significantly changes the structure of module allegiance. See Supplementary Material and Fig. S4 for similar analysis with the story comprehension task.
|
Cerebral Cortex
Resting State Network Dynamics To what extent is the dynamic structure of the language network affected by its engagement with language processing? To address this question, we additionally computed module allegiance and flexibility metrics during a resting-state condition when participants (same set of 22 participants) did not receive any external stimuli and instead engaged in free mind wandering. We observed a number of salient differences between the task and rest conditions. The module allegiance of the left and
Word/Number
0.2
0.15
0.15
B
Story
0.1
0.1
0.05
0.05
Word/Number
Story
Figure 4. Temporal core-periphery model of the language network. (A) Flexibility of each fROI during tasks (in color), and during resting state (in gray) plotted against the expected flexibility in a temporal null model (see Methods). Regions in the temporal core and periphery were determined by taking the average flexibility of each temporal null model network over optimizations and subjects, and computing the limits of one standard deviation below (core) and above (periphery) the mean. (B) Anatomical distribution of a temporal core (blue), bulk (green), and periphery (red), comprised of brain regions whose flexibility is respectively less than, equal to, and greater than that expected in the temporal null model. The core consists primarily of fROIs in the left hemisphere, while the periphery consists primarily of fROIs in the right hemisphere.
right hemispheres were significantly lower at rest than during the semantic relatedness judgment task (paired t-test, left: t11 = 5.25, p < 0.001, right: t11 = 6.73, p < 0.001); see Fig. 3B. However, the average module allegiance between hemispheres was not significantly different (paired t-test t11 = 0.33, p = 0.75). Furthermore, we observed similar trends in the resting state data acquired from the individuals who performed the story comprehension task (paired t-test, left: t9 = 3.04, p = 0.014, right: t9 = 3.08, p = 0.013, between hemispheres: t9 = −0.52, p = 0.62). Secondly, we observed that flexibility of the fROIs in the resting state tended to be higher than their corresponding flexibility during the task conditions, with the majority of the fROIs in the resting state belonging to the bulk and periphery of the coreperiphery model; see Fig. 4A. These results suggest that these 16 language fROIs form a less stable and coherent network at rest than during task conditions, tending to change in their community associations more frequently during the resting state.
Discussion In this study, we have demonstrated a distinct separation between brain regions in the language network, consisting of 16 functional regions of interest spanning both hemispheres. Combining the individual subject functional localization approach and network methods, we observed that the language network is dominated by two salient and highly lateralized modules—or communities—generally separated by hemisphere, indicating that the two hemispheres show distinct patterns of neural activity (Bassett et al. 2015). Furthermore, using dynamic network analyses, we observed that the nodes in the left hemisphere tended to be more stably associated with other nodes in
Downloaded from http://cercor.oxfordjournals.org/ at Goteborgs Universitet on September 9, 2016
Following the hemispheric-based analysis of laterality, we next asked whether the two hemispheres displayed similar or different degrees of network reconfiguration over time. Specifically, we sought to determine if one hemisphere was more likely to change community assignments more frequently than the other. Following Bassett et al. (2011), we defined the flexibility of region i to be the number of times that that region changed its allegiance to network communities during task performance (see Methods). A high flexibility indicates that a region changes its community assignment frequently. To determine the significance of regional variation in flexibility, we defined a temporal null model in which network layers (time windows) were permuted uniformly at random (see Methods) (Bassett et al. 2011). We defined a temporal core, bulk, and periphery by comparing the flexibility of the ROIs to that of the null model (Bassett et al. 2013b): the ROIs in the core are less flexible than expected from the null model, the ROIs in the periphery are more flexible than expected, and the ROIs in the bulk display similar flexibility to that expected in the null model. We observed that the core consisted largely of language-processing ROIs from the left hemisphere, while the periphery consisted largely of language-processing ROIs from the right hemisphere. We observed similarities in the distribution of core and periphery in both the data acquired during the semantic relatedness judgment task and the story comprehension task (see Fig. 4A–B). The bulk consisted of regions from both hemispheres. Furthermore, we found that the left angular gyrus and the left posterior temporal region followed the trends of the right hemisphere ROIs in both tasks. These results indicate that the ROIs in the left hemisphere are more stably connected than their counterparts in the right hemisphere, and support the hypothesis that the left hemisphere is more consistently configured in language processing (see Discussion) (Muller and Meyer 2014).
0.2
RMFG RIFG LPostTemp LAngG RMidAntTemp RAngG LAntTemp RPostTemp LMFG RIFGorb RAntTemp LMidAntTemp RMidPostTemp LIFGorb LMidPostTemp LIFG
Flexibility and a Core-Periphery Model of the Language System
A
LAngG RIFG RIFGorb RAntTemp LPostTemp RMFG RAngG RPostTemp RMidPostTemp LAntTemp RMidAntTemp LMidAntTemp LMFG LIGForb LIFG LMidPostTemp
In summary, we observed a highly lateralized organization of dynamic functional connectivity in the language network—connections within each community were stronger and more temporally consistent than those formed between communities. One striking exception to this overall pattern was the left angular gyrus, which displayed more similar BOLD activity to regions in the right hemisphere, having a tendency to be assigned to the same community as the right middle frontal gyrus, right angular gyrus, and right posterior temporal regions. The laterality index for the community containing the left angular gyrus was Λc = 0.5 in the semantic relatedness judgment task and Λc = 0.6 in the story comprehension task. In the story comprehension task, the right anterior temporal region displayed associations with regions in the middle anterior temporal and anterior temporal regions in the left hemisphere (Λc = 0.33).
Flexibility
|
Flexibility
8
Functional Network Dynamics of the Language System Chai et al.
that same hemisphere, while nodes in the right hemisphere—as well as the left angular gyrus and left posterior temporal region— tended to change their functional associations more frequently. These results enable us to consider regions in the language network that comprise a stable core that is consistently functionally coherent during language processing, as well as a flexible periphery that is only transiently functionally coherent (Bassett et al. 2013b), and therefore might have a lower degree of functional specialization (Fedorenko and Thompson-Schill 2014).
Laterality of Functional Network Dynamics
Network Flexibility in Language The question of how the brain maintains both (i) functional flexibility to meet evolving task demands and (ii) functional stability to enable ongoing task performance is critically important to understanding human cognition. Studies have demonstrated that fMRI functional connectivity patterns vary on the order of seconds to minutes (Whitlow et al. 2011; Bassett et al. 2013b), and that these variations map to changes in cognitive function (Bassett et al. 2011) indicating their relevance for human behavior. However, not all brain regions are equally dynamic in their behavior. For example, in a recent study where subjects performed a visuo-motor learning task, the modular organization of brain networks varied smoothly over time (Bassett et al. 2011 2015) with some regions maintaining their allegiance to modules throughout the experiment, and other regions constantly shifting allegiances (Bassett et al. 2013b). These regional network dynamics are consistent with a temporal core-periphery model of functional brain organization in which the brain simultaneously utilizes stable functional modules and more transient functional interactions to facilitate task performance (Bassett et al. 2013b). Applying the temporal core-periphery model to language processing (Fedorenko and Thompson-Schill 2014), we observe a stable core composed predominantly of left hemisphere regions and a flexible periphery composed predominantly of right hemisphere regions. This structure is similar across two language tasks (a visually presented task with a semantic relatedness judgment condition and a numerical judgment condition, and an auditorily presented story comprehension task), as well as during a resting state condition, suggesting that a left-hemisphere dominated core and a right-hemisphere dominated periphery may be inherent to the language network.
9
However, it is important to note that two left-hemisphere regions (the LAngG fROI, and the LAntTemp fROI) do not fit neatly into the language core-periphery model. In particular, both of these regions exhibit higher flexibility, which may suggest broader involvement in functions beyond language processing.
The LAngG fROI An intriguing result of our experiments was that the left angular gyrus language fROI differed from the rest of the left hemisphere language regions in its activity profile. The angular gyrus is a structurally and functionally heterogeneous piece of cortex that has been implicated in a broad range of cognitive functions in the prior literature, from linguistic/semantic processing, to numerical cognition, to some aspects of executive functions, to social cognition (Seghier 2013). It is worth keeping in mind, however, that we have here focused on a small language-responsive portion of the angular gyrus, which we have found in prior work to be selective for language processing (Fedorenko et al. 2011; Deen et al. 2015). Even so, this part of the language network has already shown itself to be distinct from other language regions. For example, in analyses of interregional synchronization during rest and story comprehension, Blank et al. (2014) found that the LAngG language fROI does not strongly couple with the rest of the left hemisphere language fROIs. Instead, it couples with posterior temporal and parietal language regions in the right hemisphere. Similarly, Mahowald and Fedorenko (2016) found that the LAngG fROI showed the lowest correlations with the other language regions in various functional measures of language activity (like the effect sizes or the degree of lateralization). In terms of functional responses, Blank et al. (2016) have demonstrated that this region is the only one that does not appear to be modulated by syntactic complexity. Further, in the semantic vs. numerical judgment task used in the current experiments, the LAngG fROI is the only one that did not show a reliable semantic > numerical effect (t < 1; cf. all other fROIs with t-statistics between 2.67 and 13.4, p-values less than