DiFrancesco et al. Arthritis Research & Therapy 2013, 15:R40 http://arthritis-research.com/content/15/2/R40
RESEARCH ARTICLE
Open Access
Functional neuronal network activity differs with cognitive dysfunction in childhood-onset systemic lupus erythematosus Mark W DiFrancesco1*, Darren R Gitelman2,3, Marisa S Klein-Gitelman4, Anna Carmela P Sagcal-Gironella5, Frank Zelko6, Dean Beebe7, Todd Parrish3, Jessica Hummel5, Jun Ying8 and Hermine I Brunner5
Abstract Introduction: Neuropsychiatric manifestations are common in childhood-onset systemic lupus erythematosus (cSLE) and often include neurocognitive dysfunction (NCD). Functional magnetic resonance imaging (fMRI) can measure brain activation during tasks that invoke domains of cognitive function impaired by cSLE. This study investigates specific changes in brain function attributable to NCD in cSLE that have potential to serve as imaging biomarkers. Methods: Formal neuropsychological testing was done to measure cognitive ability and to identify NCD. Participants performed fMRI tasks probing three cognitive domains impacted by cSLE: visuoconstructional ability (VCA), working memory, and attention. Imaging data, collected on 3-Tesla scanners, included a high-resolution T1weighted anatomic reference image followed by a T2*-weighted whole-brain echo planar image series for each fMRI task. Brain activation using blood oxygenation level-dependent contrast was compared between cSLE patients with NCD (NCD-group, n = 7) vs. without NCD (noNCD-group, n = 14) using voxel-wise and region of interestbased analyses. The relationship of brain activation during fMRI tasks and performance in formal neuropsychological testing was assessed. Results: Greater brain activation was observed in the noNCD-group vs. NCD-group during VCA and working memory fMRI tasks. Conversely, compared to the noNCD-group, the NCD-group showed more brain activation during the attention fMRI task. In region of interest analysis, brain activity during VCA and working memory fMRI tasks was positively associated with the participants’ neuropsychological test performance. In contrast, brain activation during the attention fMRI task was negatively correlated with neuropsychological test performance. While the NCD group performed worse than the noNCD group during VCA and working memory tasks, the attention task was performed equally well by both groups. Conclusions: NCD in patients with cSLE is characterized by differential activation of functional neuronal networks during fMRI tasks probing working memory, VCA, and attention. Results suggest a compensatory mechanism allows maintenance of attentional performance under NCD. This mechanism appears to break down for the VCA and working memory challenges presented in this study. The observation that neuronal network activation is related to the formal neuropsychological testing performance makes fMRI a candidate imaging biomarker for cSLEassociated NCD.
* Correspondence:
[email protected] 1 Pediatric Neuroimaging Research Consortium, Cincinnati Children’s Hospital Medical Center (CCHMC), 3333 Burnet Ave., Cincinnati, OH 45229, USA Full list of author information is available at the end of the article © 2013 DiFrancesco et al.; licensee BioMed Central Ltd. This is an open access article distributed under the terms of the Creative Commons Attribution License (http://creativecommons.org/licenses/by/2.0), which permits unrestricted use, distribution, and reproduction in any medium, provided the original work is properly cited.
DiFrancesco et al. Arthritis Research & Therapy 2013, 15:R40 http://arthritis-research.com/content/15/2/R40
Introduction Studies suggest that neuropsychiatric systemic lupus erythematosus (NPSLE) is present in as many as 80% of adults with SLE [1-3] and may be even more common in childhood-onset SLE (cSLE) [3,4]. The etiology of NPSLE in both children and adults remains the focus of intense research. Neurocognitive dysfunction (NCD) is one of the many manifestations of NPSLE and is encountered in up to 59% of all children with cSLE, often impairing attention, visuoconstructional ability (VCA), and working memory [3], although conventional structural brain imaging often fails to identify matching pathology. Brain function can now be mapped using blood oxygenation level-dependent (BOLD) functional magnetic resonance imaging (fMRI) that utilizes deoxyhemoglobin as an endogenous contrast agent to identify areas of altered perfusion. The coupling of neuronal activity to hemodynamics allows the identification of neuronal networks whose activity changes during the performance of cognitive tasks [5]. Our own pilot study suggested differences in neuronal network activation in patients with cSLE when compared to healthy controls [6]. However, the association between neuronal network changes and the degree and types of cognitive impairment encountered in cSLE has not been well examined. Thus, the objective of this study was to use fMRI to characterize differences in neuronal network activation that distinguish patients with cSLE-associated NCD from cSLE patients with normal cognition. Methods For this cross-sectional study, participants were recruited from two study sites (Cincinnati and Chicago). The study was approved by the institutional review boards of Cincinnati Children’s Hospital Medical Center, Ann and Robert H. Lurie Children’s Hospital of Chicago, and Northwestern
Page 2 of 12
University. Assent and written parental consent were obtained prior to any study procedure. Patients
All participants fulfilled the American College of Rheumatology classification criteria for SLE prior to age 16 years [7] and were between the ages of 9 and 18 years at the time of the study. Excluded from participation were cSLE patients with a history, prior to the diagnosis of cSLE, of comorbid conditions affecting neurocognitive function, the presence of known structural brain abnormalities, neuropathies, movement disorders, or seizures. Sociodemographic status was assessed for each participant and medical histories were reviewed for information relevant to cSLE. Disease activity and damage were measured by the SLE Disease Activity Index and the Systemic Lupus International Collaborating Clinics/American College of Rheumatology Damage Index [8], respectively. Measurement of cognitive ability and definition of NCD
Formal neuropsychological testing was performed by a trained psychometrician, using a standardized neuropsychological battery for cSLE [9]. Under consideration of age, race and gender, published norms were used to score the participants’ performance on each of the formal neuropsychological tests, with results expressed as z-scores; these have a mean of 0 and standard deviation of 1 for a normative healthy population. Performance in each of the four cognitive domains assessed (working memory, psychomotor speed, attention, and visuoconstructional ability (VCA)) was quantified by averaging the z-scores of the standardized tests for each cognitive domain. Table 1 provides additional details about the standardized tests administered. Participants with at least one domain z-score ≤ -2 or at least two domain z-scores ≤ -1 were categorized as
Table 1 Tests used to define neurocognitive dysfunction Domain
Measure
Source
Description
Working memory
Digit span
Age-appropriate Wechsler intelligence scale [32,33] Age-appropriate Wechsler intelligence scale [32,33] Age-appropriate Wechsler intelligence scale [32,33] Age-appropriate Wechsler intelligence scale [32,33] Conners’ continuous performance test II [34]
Ability to repeat back in order, or in a re-sequenced order, increasingly difficult strings of numbers Ability to mentally re-sequence a series of letters and numbers before repeating them back Test-takers decode and transcribe a series of symbols as quickly as possible Score reflects speed and accuracy of test-takers’ visual searches for matches in rows of symbols On a 15-minute-long boring task, the variability in reaction time to specific letters flashing on screen
Letter-number sequencing Psychomotor speed Coding Symbol search Attention
Visuoconstructional abilities
Hit reaction time standard error
Inhibition vs. color Delis-Kaplan executive naming score functioning system [35]
Relative ability to focus on the color of the ink in which a conflicting color word is printed (for example, ‘blue’ written in red ink).
Block design
Wechsler abbreviated scales of intelligence [36]
Ability to efficiently reproduce colored line drawings using blocks with sides that have varying patterns
Block counting
Kaufman assessment battery for children [37,38]
Ability to mentally represent the volume of a three-dimensional block construction printed in two-dimensional space
DiFrancesco et al. Arthritis Research & Therapy 2013, 15:R40 http://arthritis-research.com/content/15/2/R40
members of the NCD-group. Otherwise, participants were considered members of the noNCD-group [10]. Functional magnetic resonance imaging paradigms
During a single imaging session, each participant completed three fMRI paradigms probing attention, working memory, and VCA. Each of the fMRI paradigms used a block periodic design, with active task intervals interleaved with control task intervals. Visual stimuli were projected onto a screen 50 cm behind the subject’s head and viewed by a mirror attached to the head coil. Presentation ® software (Neurobehavioral Systems, Inc.; Albany, CA, USA) running on a dedicated computer was used for stimulus display and response collection. Subjects responded using a handheld response box (Current Designs, Inc.; Philadelphia, PA, USA) that was connected by optical fiber to the computer. Each response was recorded and subsequently analyzed for correctness and response time. Attention paradigm
Attention allows concentration on a specific target stimulus over a span of time, while avoiding distraction from extraneous stimuli. An identical pairs continuous performance task (CPT-IP), consisting of identifying the repetition of any item in a sequence, was utilized in this study to measure attention [11]. The active attentional task consisted of viewing a random single digit between 0 and 9 at the center of a screen every 0.75 seconds during a 30-second block. Participants were instructed to press a button whenever consecutive numbers were identical. During the control task intervals, also lasting 30 seconds, the number 1 was shown repeatedly with the same 0.75second period. The participant was asked to press the response button five times at the beginning of this interval, with no further response required. The CPT-IP session was comprised of five interleaved blocks of each task type. The contrast between the attention and control tasks in this paradigm minimizes motor response from pressing buttons as well as visual stimulation associated with watching the numbers, allowing for the delineation of the attention needed to detect sequential pairs of numbers as they appear on the screen. Working memory paradigm
Working memory allows for information to be maintained and available for use for a brief period of time. An N-back paradigm was used in this study to invoke working memory [11]. Participants performed a 2-back working memory task controlled for attention, visual stimulation, and motor response by a 0-back task. In both tasks, the integers from 1 to 4 were presented randomly, one at a time, on a screen with each number appearing consistently in a specific quadrant of a diamond shape. Patients responded by pressing buttons on a response box on which buttons had been arranged in a diamond pattern, corresponding spatially with the numbers appearing on the screen. During
Page 3 of 12
30-second blocks, 17 numbers were presented at a steady rate. For the 2-back working memory task, subjects were instructed to press the button corresponding to the number that preceded the current number by two trials. The 0-back control task required the subject to merely press the button corresponding to the number currently showing on the screen. Since both tasks have the same sensorimotor and attentional elements, the contrast between them isolates the working memory component exclusive to the 2-back task. Visuoconstruction paradigm
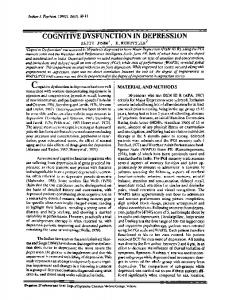
Visuoconstruction involves the ability to organize and manually manipulate spatial information to make a design. We adapted a previously developed fMRI paradigm to probe VCA in children [12,13]. This paradigm employed visual stimuli, each comprised of a pair of black geometric shapes on a white background, presented at regular time intervals. Stimuli were shown in blocks of 21 seconds duration, each introduced by 3 seconds of instructional text. Each block had the subject perform under one of three conditions: motor, matching, and square completion. Employing two buttons on the response box (corresponding to yes/no), the motor condition simply required pressing the yes-button after each presentation of the same pair of identical shapes (Figure 1). During the matching condition, the subject responded ‘yes’ if the shapes were identical, or ‘no’ if one of the shapes was flipped relative to the other (Figure 1). For the square completion condition participants were asked to judge if the two shapes could be fitted together to form a complete square, again without flipping either shape, although shapes might have to be rotated. One run of the VCA paradigm consisted of eighteen blocks; six motor, six matching, and six square completion conditions, with the block order pseudo-randomized and balanced. The motor condition provides control for motor, attention, and primary visual elements of the matching and square completion conditions. While the contrasts of matching vs. motor conditions and square completion vs. motor conditions both delineate brain activation involving visuoconstruction, the contrast between the square completion vs. matching conditions further controls for purely perceptual function to focus on constructional ability [12]. Magnetic resonance imaging
Imaging was performed at two separate sites with matching protocols using a Philips Achieva 3 Tesla (3T) and a Siemens Trio 3T scanner, respectively. The same T2*weighted gradient-echo echo-planar imaging sequence was used for all fMRI paradigms, with the following parameters: repetition time (TR) 3,000 ms (milliseconds), echo time (TE) 30 ms, field of view (FOV) 256 × 256 mm, matrix 64 × 64 pixels, 44 axial slices, slice thickness 3 mm. In addition, a high-resolution, T1-weighted,
DiFrancesco et al. Arthritis Research & Therapy 2013, 15:R40 http://arthritis-research.com/content/15/2/R40
Page 4 of 12
Motor Task: Same shapes are shown each time Matching Task: Do shapes match without flipping? Square completion Task: Do shapes form a square without flipping? Response:
YES
NO
Figure 1 The visuoconstruction paradigm consisted of three tasks for each of which the subject responded ‘yes’ or ‘no’ after each viewing of a pair of black shapes. Example stimuli are shown for: the motor task (top row), for which the subject responded ‘yes’ to the same pair of matching shapes shown repeatedly; the matching task (middle row), for which ‘yes’ means the shapes match without flipping and ‘no’ means one is flipped, and the square completion task, for which subjects respond ‘yes’ for shapes that fit together to form a square without flipping and ‘no’ otherwise.
inversion-prepared three-dimensional magnetization-prepared rapid gradient echo (MPRAGE) whole brain scan was acquired for each study participant. Parameters for this scan were as follows at site 1: TR 6.8 ms, TE 2.9 ms, inversion recovery time 904 ms, FOV 176 × 256 × 256 mm, matrix 176 × 256 × 256 pixels (total time 6 minutes, 42 seconds). At site 2, the parameters were identical except for a TE of 3.1 ms and an inversion recovery time of 900 ms to account for differences in scanners. These scans served as the anatomic reference for co-registration and overlay of functional data. During each session, the MPRAGE volume was acquired first, followed by the functional imaging. A series of 148 images (total time 7 minutes, 24 seconds) was acquired for the VCA paradigm, while the CPT-IP and N-back tasks required 114 images each (total time 5 minutes, 42 seconds). Data from the initial four time points were discarded from the imaging series of each paradigm to allow for attainment of T1 relaxation equilibrium. In order to compare signal characteristics between sites and to monitor stability, a phantom was scanned each day a subject was imaged, as recommended for multisite studies by the Function Biomedical Informatics Research Network (FBIRN) [14]. Matching phantoms, obtained
from an FBIRN source, were used at each site, comprised of a 17.5 cm-diameter spherical plastic shell filled with a solution of nickel chloride and sodium chloride in agar. The solution is proportioned to load the MR coil like a human head and to have relaxation characteristics similar to human gray matter at 3 Tesla. Phantom series included 200 images using parameters identical to those employed for fMRI sessions. In total, fifteen phantom series were completed on the Philips scanner and five were completed on the Siemens scanner. Image processing
Processing of three-dimensional anatomic and fMRI data was done using Statistical Parametric Mapping (SPM) software [15] in the Matlab computing environment (The Mathworks, Inc., Natick, MA, USA). Prior to statistical analysis, several preprocessing steps were completed: 1) rigid-body realignment of each image to the first image of each session, using three translational and three rotational adjustments; 2) co-registration of the session mean functional image to the corresponding anatomical image; 3) normalization to Montreal Neurological Institute (MNI) template space, and 4) smoothing with an 8-mm full width at half maximum (FWHM) Gaussian kernel. Transformation parameters for normalization resulted
DiFrancesco et al. Arthritis Research & Therapy 2013, 15:R40 http://arthritis-research.com/content/15/2/R40
from anatomical segmentation in SPM8 based on gray matter, white matter, and cerebral spinal fluid templates. Application of the same transformation to the corresponding preprocessed functional images permitted overlay of statistical parametric maps onto the anatomic reference and allowed the voxel-by-voxel combination of data from multiple subjects into a group activation map for each fMRI task. Phantom data were analyzed via dedicated software obtained from FBIRN [16]. Site comparison for this study focused on calculations of signal-to-noise ratio (SNR) and signal-to-fluctuation noise ratio (SFNR). Statistical analysis
Continuous measures of sociodemographic and cSLE relevant information as well as numbers of correct responses during each of the fMRI tasks were summarized by means and SDs and compared using 2 sample t-tests between groups. For categorical variables, frequencies (in %) of correct responses per fMRI task were compared using Fisher’s exact test. The functional imaging data were analyzed using both voxel-wise- and region of interest (ROI)-based approaches. Voxel-based analyses are able to examine activations across the entire brain, but are limited by the need for more stringent correction for multiple comparisons, and thus, are less sensitive. ROI-based analyses examine neuronal activation only in pre-specified regions of the brain linked to a given fMRI task. ROI-based analyses sacrifice examining the entire brain for enhanced sensitivity to capture group differences at the selected brain areas using aggregate measures. Voxel-wise analysis
Voxel-wise brain activation was compared between the NCD and noNCD-groups using the following two-level analytic approach. At the first level, brain activation was estimated for each fMRI task at each voxel under the general linear model framework. The design matrix included the block periodic time series for each condition of the task. The time series was adjusted for the known delay of BOLD responses using the canonical hemodynamic response function in SPM8. Motion parameters were included as nuisance covariates in the design. Contrasts of interest between task conditions were assessed as differences in corresponding estimated model parameters. In the second level, a random- (or mixed-) effect model was used to compare means between groups at each voxel, after accounting for within-person (or between-voxel) relationships using a random effect. Phantom data suggested differences between scanners used in this study. While SFNR was markedly similar between scanners (Philips = 271 ± 5 vs. Siemens = 263 ± 17, P = 0.37), SNR differed significantly (Philips = 314 ± 31 vs. Siemens = 272 ± 33, P = 0.05). In light of this, the analysis was adjusted for a site effect by adding a site
Page 5 of 12
covariate to the model. Differences in mean activation between groups were assessed for each task contrast separately using the two-sample t-test. The resulting T-score maps were thresholded at a nominal voxel P-value of 0.005, uncorrected for multiple comparisons, with resulting clusters of voxels assessed in SPM8 for significance at a corrected P-value < 0.05. Region of interest analysis
All ROIs were chosen prior to analysis based on previously published reports of activation of fMRI tasks for working memory [17], attention [18], and VCA [19] similar to those employed in this study. In addition, a collection of regions that commonly deactivate during task performance, known as the default mode network, were identified using previous reports [20]. ROIs were extracted from the automated anatomical labeling (AAL) atlas stored in the Wake Forest University Pick-Atlas toolbox in SPM8. A list of the ROIs considered in this analysis for each task is provided in Table 2. For each ROI, its activation (or deactivation) level was measured by aggregating T-scores [21,22] from activated (or deactivated) voxels that fit the following two criteria: (1) those T-scores were all above (or below) a threshold of t ≥ 1.64, corresponding to a one-sided significance level of 0.05, and (2) the voxels had to be part of a cluster of at least 10 activated (or deactivated) adjacent voxels. This threshold and cluster size within a given ROI was chosen to help reduce noise, hence avoid the detection of spurious activations in isolated voxels. Use of aggregate T-scores provides a measure that reflects a combination of activation and variance. For each task-specific ROI, the association between brain activation and NCD status was determined using an analysis of variance (ANOVA) model, after controlling for imaging site. Post hoc means of activation were compared between the NCD-group and the no-NCD-group under the ANOVA model framework. The relationship of each domain z-score from formal neuropsychological testing and the ROI activation level was determined by calculation of a partial correlation coefficient, after controlling for imaging site. All analyses were repeated after adding more controlling covariates, such as family income levels and the current dose of systemic steroids to the models. Because the results of models with these additional covariates were found no different from those adjusting only for imaging site, they are not reported. All ROI analyses were performed using SAS 9.3 software (SAS, Cary, NC, USA). P-values < 0.05 were considered statistically significant.
Results Patients
Among the twenty-two study participants, fourteen had normal cognition (noNCD-group) and eight were found to have NCD (NCD-group) based on their performance
DiFrancesco et al. Arthritis Research & Therapy 2013, 15:R40 http://arthritis-research.com/content/15/2/R40
Page 6 of 12
Table 2 Regions of interest considered per functional magnetic resonance imaging task Domain: Task
Regions of interest
Working memory: N-back
Frontal, middle + inferior Anterior cingulate Precuneus Parietal, inferior Anterior default mode (medial prefrontal cortex) Precuneus + posterior cingulate1
1
Angular gyrus1 Hippocampus + parahippocampus1 Temporal, superior1 Attention: CTP-IP
level as measured by the highest maternal educational level in families of children with normal cognition. At the time of the study the NCD-group was treated with significantly higher doses of prednisone than in the noNCDgroup, and the annual income of the NCD-group was significantly lower. Formal neuropsychiatric testing revealed that the domain z-scores for psychomotor speed, working memory, and VCA were significantly lower in the NCDgroup than the noNCD-group. Conversely, groups only showed small and statistically insignificant differences in the domain z-scores for attention during formal neuropsychological testing. Performance on fMRI tasks in the scanner
Frontal, inferior Frontal, middle Insula + temporal, superior SMA + cingulate, middle Parietal, inferior + supramarginal gyrus Fusiform gyrus + occipital, inferior Frontal mid, inferior + precentral gyrus Default, anterior (medial prefrontal cortex) Precuneus + posterior cingulate1
1
Angular gyrus1 Hippocampus + parahippocampus1 Visuo-construction: Frontal, inferior VCA Frontal, middle Parietal, Inferior + supramarginal gyrus Fusiform gyrus + occipital, inferior Precuneus, bilateral Parietal, superior Frontal, superior Frontal, superior medial bilateral Default, anterior (medial prefrontal cortex)1 Precuneus + posterior cingulate1 Angular gyrus1 1
Hippocampus + parahippocampus
All regions chosen prior to analyses and derived from previously published reports (references [15-18]). 1Regions hypothesized to deactivate under the task; otherwise, the region is hypothesized to activate. Unless otherwise indicated, right and left hemisphere portions of each region are considered separately in analyses. CPT-IP, continuous performance task-identical pairs; VCA: visuoconstructive ability; SMA, supplementary motor area.
during formal neuropsychological testing. One participant with NCD failed to complete the fMRI session and was excluded, leaving a total of twenty-one participants, including seven with NCD, with complete data. Key demographic and cSLE-related data from the study population are summarized in Table 3. As expected, children with NCD has significantly lower intelligence quotient (IQ) scores and were exposed to higher daily doses of corticosteroids compared to children with normal cognition. There was a trend towards a higher socioeconomic
The correct response rates and response times required for correct responses during the CPT-IP attention, 2-back working memory, and VCA fMRI tasks were compared between groups. The mean response times for all three fMRI tasks were not significantly different between groups. Conversely, compared to the noNCD-group, the NCDgroup had a significantly lower correct response rate for the 2-back working memory fMRI task (25% ± 15% for the NCD-group vs. 64% ± 22% for the noNCD-group; P < 0.0003) and the square completion condition that is part of the VCA fMRI task (47% ± 12% for the NCD-group vs. 63% ± 19% for the noNCD-group; P < 0.03). The correct response rate for the CPT-IP attention fMRI task, however, did not differ significantly between groups (71% ± 29% for the NCD-group vs. 85% ± 21% for the noNCDgroup; P < 0.29). Control tasks for both N-back and VCA showed improved performance with insignificant group differences: 0-back (82% ± 21% for the NCD-group vs. 90% ± 21% for the noNCD-group; P < 0.42), VCA matching condition (63% ± 18% for the NCD-group vs. 74% ± 23% for the noNCD-group; P < 0.22). Neuronal network activation Voxel-wise analysis
T-maps of differences in activation between the NCDgroup and the noNCD-group for the three paradigms are displayed in Figure 2 at nominal thresholds of P < 0.005, uncorrected for multiple comparisons, and a voxel cluster size > 40. The working-memory task produced differences in a cluster of voxels located in the precuneus, extending into the inferior parietal regions, for which the noNCD-group had significantly more brain activation than the NCD-group (P < 0.05 for the entire cluster, after correction for multiple comparisons between groups). The VCA paradigm also produced stronger activation in the noNCD-group compared to the NCD-group, with significant clusters (corrected cluster P-value < 0.05) in the precuneus and right occipital regions for the matching vs. motor contrast of the VCA paradigm. There were also trends in differential brain activation in the basal
DiFrancesco et al. Arthritis Research & Therapy 2013, 15:R40 http://arthritis-research.com/content/15/2/R40
Page 7 of 12
Table 3 Demographics of study participants
Age, years
cSLE without NCD (n = 14)
cSLE with NCD (n = 7)
P-value1
14.7 ± 2.1
15.1 ± 1.9
NS
Female Race/ethnicity
Number, % White/black/hispanic/other
11 (78.6%) 6/4/2/2
6 (85.7%) 1/6/0/0
NS NS
Highest maternal educational level
Postgraduate degree/Bachelor’s degree/partial college or associate degree/High School degree/unknown
2/4/4/4/0
0/0/3/3/1
NS
WASI full scale IQ score
104.4 ± 10.5
89.0 ± 7.4
0.005
Annual family income (in “tabcaption”,000)
84.4 ± 48.9
34.4 ± 17.3
0.003
2.5 ± 2.2
1.6 ± 1.6
NS
11.7 ± 7.4 5 (35.7%)
16.9 ± 11.8 5 (71.4%)
NS NS
4.1 ± 3.0
7.1 ± 6.2
NS
0.4 ± 0.8
0.7 ± 1.1
NS
Site 1/site 2 Average z-scores
10/4
6/1
NS
Working memory
-0.15 ± 0.52
-1.03 ± 0.59
0.0038
Psychomotor speed
0.23 ± 0.69
-1.22 ± 0.38
0.0001
Attention
0.13 ± 0.57
-0.39 ± 1.08
NS
Visuoconstructional ability
0.30 ± 0.46
-1.22 ± 0.91
< 0.0001
Disease duration, years Medications
Prednisone (mg/kg/day)
Disease activity and damage
Treatment with immunosuppressant2 SLEDAI score SDI score
Imaging sites Neurocognitive dysfunction
Values are means and SD unless indicated otherwise. 1P-values are based on t-tests or Fisher’s exact test, when appropriate. 2Number of patients (without/with) neurocognitive dysfunction (NCD) treated with: mycophenolate mofetil (4/2); azathioprine (2/1); methotrexate (1/0); mycophenolate mofetil plus cyclophosphamide (0/1); cyclophosphamide (0/1). cSLE, childhood-onset systemic lupus erythematosus; WASI, Wechsler abbreviated scales of intelligence; NS, not significant; SLEDAI, Systemic Lupus Erythematosus Disease Activity Index (2-k version; range 0 to 105; 0 = inactive disease); SDI: Systemic Lupus International Collaborating Clinics/American College of Rheumatology Damage Index (range 0 to 46; 0 = no damage).
ganglia between groups for the square completion vs. motor contrast. The square completion vs. matching contrast failed to show activation at the uncorrected P < 0.005 threshold for individual voxels. While the NCDgroup exhibited lower brain activation during the working memory and VCA fMRI tasks than the noNCDgroup in relevant brain regions, there was a trend toward greater brain activity in the frontal lobe regions in the NCD-group than in the noNCD-group during the CPTIP attention task. ROI-based analysis
In line with the voxel-wise analysis, ROI-based analysis suggested significant differences between groups in neuronal network activation in select ROIs that are considered relevant for the N-back, VCA and CPT-IP fMRI tasks (Table 4). The noNCD-group consistently activated several ROIs relevant for the N-back and VCA fMRI tasks more strongly than the NCD-group. Conversely, during the CPT-IP attention fMRI task, brain activation in the left insular/superior temporal region was more pronounced in the NCD-group than the noNCDgroup. There were no significant differences between groups in any of the ROIs expected to deactivate during task execution of the N-back working memory, CTP-IP attention and VCA fMRI tasks. Details of group activation comparisons for all ROIs are available as supplementary material (Additional file 1).
We then assessed the relationship between participant performance during formal neuropsychological testing and neuronal network activation patterns. Table 5 presents statistically significant partial correlation coefficients (after adjusting for imaging site) between brain activation and neuropsychological domain scores (attention, working memory, VCA, and processing speed). It is worth noting that although each standardized test primarily challenged a particular cognitive domain, successful performance also relied on an array of other cognitive skills. Therefore, a complex pattern of relationships was observed between brain activation during a given fMRI task and the cognitive performance measured on neuropsychological tests. As might be expected, brain activation of the ROIs stimulated by the attention (CPT-IP) and VCA fMRI tasks were correlated with the attention and VCA domain z-scores. Unexpectedly, working memory performance during neuropsychological testing was not associated with activation in any of the ROIs for the N-back working memory fMRI task. Instead, it was found to be negatively correlated with CPT-IP activation in several ROIs.
Discussion We found differential neuronal activation in several brain regions during fMRI tasks exercising VCA, working memory, and attention in children with cSLE who
DiFrancesco et al. Arthritis Research & Therapy 2013, 15:R40 http://arthritis-research.com/content/15/2/R40
A B
C
D
Page 8 of 12
Working Memory / NBack No-NCD-group > NCD-group
Attention / CPT-IP NCD-group > No-NCD-group
VCA / SC–Motor contrast No-NCD-group > NCD-group
VCA / Match-Motor contrast No-NCD-group > NCD-group
Figure 2 Voxel-wise differences in functional neural network activations during functional magnetic resonance imaging. Differences in neuronal network activation between participants with neurocognitive dysfunction (NCD) (NCD-group; n = 7) and participants without NCD (noNCD-group; n = 14) are depicted. The clusters shown reflect differences between groups of participants at an uncorrected P-value < 0.005 and cluster size threshold of 40 voxels. Neurological convention of image orientation is used. (A) Clusters in which the noNCD-group activated more strongly than the NCD-group for the N-Back working memory paradigm. (B) Continuous performance task-identical pairs (CPT-IP) (attention) displays clusters with the NCD-group activating more strongly than the no-NCD-group. Visuoconstructional ability (VCA) task differential activations with the noNCD-group showing more activation than the NCD-group for (C) the square completion (SC) vs. motor and (D) the matching vs. motor contrasts.
have NCD, compared to those with normal cognition based on formal neuropsychological testing. Furthermore, we newly report details about the relationship between the level of cognitive performance and task-driven regional brain activation in cSLE. Previous investigations have reported various cognitive deficits in both adult SLE and cSLE, most commonly including impairment of attention, working memory, and VCA [23-25]. Earlier work applying fMRI in adults and children explored changes in neuronal networks associated with SLE in comparison to healthy controls [11,26-30]. These studies suggest that individuals with SLE activate brain regions associated with specific cognitive tasks more strongly than their healthy counterparts. The recruitment of the additional brain regions was hypothesized to help maintain normal levels of performance by patients with cSLE or adults with SLE during a given fMRI task.
The results of our study support the use of a similar compensatory mechanism for NCD for the attention task CPT-IP. We demonstrated greater activation in an insular/superior temporal ROI in the presence of clinically overt NCD compared to no NCD while CPT-IP performance remained unaffected. Notably, a negative relationship between CPT-IP brain activation in several ROI and patients’ working memory abilities, as measured by formal neuropsychological testing, was observed. A possible explanation for this finding is that CPT-IP is, in effect, a 1-back working memory task. It represents a simpler version of the N-back (2-back) task. Lack of negative association of CPT-IP activation with attention domain scores suggests that attention deficits may not be the principal drivers of compensatory activation for this task. The current study in young patients with cSLE directly supports the notion that there is a
DiFrancesco et al. Arthritis Research & Therapy 2013, 15:R40 http://arthritis-research.com/content/15/2/R40
Page 9 of 12
Table 4 Regions of interest with significant differences in activation between cSLE patients with versus without neurocognitive dysfunction Anatomical region of interest Working memory/N-back
Attention/CPT-IP VCA/match-motor contrast
VCA/square-motor contrast
no-NCD group
NCD group
p-value
Precuneus
1.05 ± 0.17
0.13 ± 0.25
0.004
Parietal inf L
2.32 ± 0.32
1.10 ± 0.47
0.030
Parietal inf R Insula + temporal sup L
3.22 ± 0.41 0.45 ± 0.19
1.77 ± 0.59 1.06 ± 0.27
0.041 0.050 0.032
Frontal inf L
0.71 ± 0.12
0.25 ± 0.17
Frontal mid L
0.72 ± 0.12
0.26 ± 0.18
0.029
Frontal sup L
0.50 ± 0.10
0.15 ± 0.14
0.037
Parietal inf +supramarginal L
1.19 ± 0.16
0.66 ± 0.23
0.050
Parietal sup L
1.62 ± 0.23
0.81 ± 0.34
0.045
Fusiform+occipital inf L
1.58 ± 0.27
0.59 ± 0.40
0.038
Fusiform+occipital inf R Frontal sup R
1.49 ± 0.26 0.54 ± 0.09
0.52 ± 0.39 0.21 ± 0.13
0.036 0.033
Precuneus bilateral
0.85 ± 0.14
0.34 ± 0.20
0.036
Fusiform+occipital inf L
1.95 ± 0.24
1.06 ± 0.35
0.033
Fusiform+occipital inf R
1.54 ± 0.22
0.77 ± 0.33
0.048
Region of interest (ROI) activation is defined as the (sum of T-scores within the ROI among voxels with T-scores > 1.66 that are part of clusters of at least 10 voxels)/total voxels in the ROI. cSLE, childhood-onset systemic lupus erythematosus; NCD, neurocognitive dysfunction; CPT-IP: continuous performance taskidentical pairs; VCA, visuoconstructive ability; L, left; R, right; inf, inferior; mid, middle.
Table 5 Summary of association between region of interest activity and cognitive domain z-scores under formal neuropsychological testing fMRI paradigm
Region of interest
Attention domain
Working memory: N-back
Frontal mid inf R
0.51
Precuneus
0.47
Parietal inf R Attention: CTP-IP
VCA domain 0.54 0.45
Frontal mid L
-0.45
Insula + temporal sup L
-0.46
SMA + cingulate mid bilateral Fusiform +occipital inf L VCA: match vs. motor contrast
-0.47 0.52
Frontal sup L
0.45
Parietal sup L
0.48
Fusiform + occipital inf R
0.45
Angular R VCA: SC vs. motor contrast
Working memory domain
0.51
Frontal mid L
0.45
Frontal sup L
0.64
Frontal sup R
0.49
0.65
Precuneus bilateral Parietal sup L
0.54 0.50
0.62 0.56
Parietal sup R
0.48
Fusiform + occipital inf L
0.52
Fusiform + occipital inf R
0.48
Values are partial correlation coefficients (r-values). Only r- values > 0.45 are shown, corresponding to P < 0.05. fMRI, functional magnetic resonance imaging; CPT-IP: continuous performance task-identical pairs; VCA, visuoconstructive ability; SC, square completion; L, left; R, right; inf, inferior; sup, superior; mid, middle; SMA, supplementary motor area.
relationship between the presence of NCD and alterations in brain activation. Mackay et al. reported that longer SLE disease durations are associated with diminished neuronal activation during an fMRI task of working memory among adults with SLE
[28]. The patients included in that study [28] with longer disease durations also had more disease damage and poorer working memory, making it difficult to dissect causal relationships. Conversely, in our study the NCD and noNCD groups had similar disease duration, suggesting that the
DiFrancesco et al. Arthritis Research & Therapy 2013, 15:R40 http://arthritis-research.com/content/15/2/R40
duration of SLE may not be as important for brain activation differences in SLE as previously thought. Alternatively, the differences in findings between our study and Mackay’s might be due to differences in how developing brains of children with cSLE and mature brains of adults with SLE respond to the underlying inflammatory processes. Nonetheless, the observations by Mackay et al. suggest that compensatory augmentation of task activation can break down with sufficient levels of disease damage. It is plausible that the threshold for breakdown also depends on task difficulty. Unlike the CPT-IP task, we observed diminished activation in select brain regions pertaining to the N-back and VCA tasks in cSLE patients with NCD compared to those with no NCD. Thus, some neuronal activity changes we observed in children with cSLE-related NCD parallel those in adults with SLE of extended duration. Intriguingly, this decrease of activation associated with NCD occurred in the precuneus and inferior parietal areas, which are regions where cSLE patients have previously showed more brain activation than healthy controls under a working memory fMRI task [11]. In aggregate, our results are consistent with a model in which intact cognitive performance can be maintained in children and adults with SLE via compensatory increased neuronal activation. However, under sufficient disease burden or cognitive challenge, that compensatory pattern breaks down, resulting in diminished activation and clinically apparent cognitive dysfunction. As a group, the children with NCD in this study had a significantly lower correct response rate than the noNCDgroup during fMRI tasks probing working memory and VCA, while performance on the CPT-IP attention fMRI task showed no significant group differences. Correspondingly, while activation decreased for working memory and VCA in those with NCD, the attention task (CPT-IP) elicited stronger activations for the NCD-group on both voxel-based and ROI-based analyses. It is possible that the CPT-IP task did not challenge the study participants as much as the other fMRI tasks, allowing the NCD-group to maintain performance by means of the compensatory strategy of greater activation described above. Alternatively, the lack of CPT-IP performance differences between the NCD-group and the noNCD-group may be due to relatively well-matched attention domain z-scores in formal neuropsychological testing, or to a more robust mechanism for maintaining attentional ability compared to working memory function or VCA. For all three fMRI tasks, there is a common thread of positive correlation between activation and attention domain formal neuropsychological testing z-scores. Thus attention deficits in the NCD-group may play a role in diminishing performance during fMRI tasks that probe working memory and VCA, and the corresponding decrease in brain activation in patients with NCD.
Page 10 of 12
This study offers a framework for viewing NPSLE as a burden on brain function that elicits compensatory mechanisms, relying on neuronal plasticity to maintain cognitive performance. Plasticity has limits which, when exceeded result in clinical manifestations of cognitive deficit. In the context of brain plasticity, the course of NPSLE may have a more profound impact on children with cSLE, given their dramatic, ongoing, brain development. While children possess a greater capacity for brain plasticity in response to an assault such as NPSLE [31], there remains the potential for the disease not only to disrupt existing neuronal networks, as demonstrated in this study, but also to alter the development of emerging brain networks. Our cross-sectional study does not allow us to delineate whether brain development is impaired by cSLE, or whether ongoing brain maturation serves as a means to help compensate for earlier brain insults by active NPSLE. Such a critical unknown will require longitudinal studies, which will also help determine whether the observed alterations in brain activation are permanent or reversible with treatment. A distinct strength of our study is that its participants were well-phenotyped with respect to their clinical cSLE status, and their cognitive abilities were accurately assessed using the cSLE Cognitive Battery of Standardized Tests [9]. However, this study also suffered from some limitations. While twenty-one subjects were imaged for this study, only seven tested as having NCD by our criteria. This low number limited the statistical power for finding differences attributable to the development of NCD. Nonetheless, significant differences between groups of children with different levels of cognitive ability were detected, and one might speculate that at least some of the trends in associations would have reached statistical significance had the sample size been larger. Performance on both 2-back and VCA square completion fMRI tasks was particularly poor for the NCD group raising concern about motivation. This is dispelled to some degree by good performance by the NCD group on the CPT-IP task and the control tasks for N-back and VCA. Recruitment for this study included children in the age range of 9 to 18 years, a period of ongoing brain development. Including this span of development may have introduced age-related variability in the fMRI findings. Note, however, that the NCD and noNCD groups are well matched in age, reducing the impact of developmental stage on group difference assessments. The subject groups were not matched, however, in socioeconomic status (SES) and IQ, with the NCD group lower in both measures. The influence of these differences on our results cannot be ruled out.
Conclusions In summary, we found differences in brain activation patterns that are related to distinct cognitive deficits in
DiFrancesco et al. Arthritis Research & Therapy 2013, 15:R40 http://arthritis-research.com/content/15/2/R40
cSLE. Building on the results of our previous study [6], we postulate that cSLE leads to changes in brain function, which are initially compensated by increased activation in certain brain areas; once compensatory mechanisms fail, clinically overt NCD occurs. Further research is required to delineate brain activation correlates associated with the resolution of clinically overt NCD and those with persistent cognitive deficits in SLE.
Additional material Additional file 1: Summary of brain activity vs. NCD status for all regions of interest examined. A table listing mean region of interest (ROI) activation, defined as (sum of T-scores within the ROI among voxels with T-scores > 1.66 that are part of clusters of at least 10 voxels)/total voxels in the ROI, for systemic lupus erythematosus (SLE) patients with and without neurocognitive dysfunction (NCD).
Abbreviations AAL: automated anatomical labeling; ANOVA: analysis of variance; BOLD: blood oxygenation level-dependent; CPT-IP: continuous performance taskidentical pairs; cSLE: childhood-onset SLE; FBIRN: Function Biomedical Informatics Research Network; fMRI: functional magnetic resonance imaging; FOV: field of view; FWHM: full width at half maximum; IQ: intelligence quotient; MNI: Montreal Neurological Institute; MPRAGE: magnetizationprepared rapid gradient echo; NCD: neurocognitive dysfunction; NPSLE: neuropsychiatric systemic lupus erythematosus; ROI: region of interest; SES: socioeconomic status; SFNR: signal-to-fluctuation noise ratio; SLE: systemic lupus erythematosus; SNR: signal-to-noise ratio; SPM: Statistical Parametric Mapping;TE: echo time; TR: repetition time; VCA: visuoconstructional ability. Authors’ contributions HB, MD, and DG participated in study design. MD, DG, TP, and AS-G took part in imaging data acquisition. MK-G, FZ, DB, HB, and AS-G carried out neuropsychological data acquisition. MD and JY performed data analysis. MD, DG, JY, and HB participated in interpretation of results. MD, HB, and JY prepared the manuscript. All authors participated in review and approval of the final manuscript. Competing interests The authors declare that they have no competing interests. Acknowledgements This study is supported by the NIAMS Clinical Research Center P60AR047884. This publication was also supported by an Institutional Clinical and Translational Science Award, NIH/NCRR Grant Number 5UL1RR02631403. Its contents are solely the responsibility of the authors and do not necessarily represent the official views of the NIH. This study would not have been possible without the dedicated clinical research personnel, namely Aimee Baker, Blair Dina, Adlin Cedeno, Jessica Sage, Shannen Nelson, Erin Thomas, and Aisha Ali. We thank Drs Megan Curran, Jennifer Huggins, Esi Morgan-DeWitt, Dan Lovell, Alexei Grom, Tracy Ting, Michael Henrickson, and PNP Janalee Taylor for providing us with access to their patients with cSLE. We would also like to thank Meredith Amaya, April German, Allison Clarke, Kate Dahl, Antoinette Dezzutti, Lev Gottlieb, Jennifer Heil, Jennifer Keller, Andrew Phillips, Michal Rischall, Rebecca Wasserman Lieb, Lisa Welcome, Donna Diedenhofer, Cindy Scharf and Mariah Wells for their assistance with neuropsychological testing. We are indebted to the children and adolescents with cSLE and their parents for participating in this study. The assistance of Azmi Banibaker for scanning the subjects at the Northwester site is greatly appreciated. Author details Pediatric Neuroimaging Research Consortium, Cincinnati Children’s Hospital Medical Center (CCHMC), 3333 Burnet Ave., Cincinnati, OH 45229, USA.
1
Page 11 of 12
2 Department of Neurology, Feinberg School of Medicine, Northwestern University, 420 East Superior St., Chicago, IL 60611, USA. 3Department of Radiology, Feinberg School of Medicine, Northwestern University, 420 East Superior St., Chicago, IL 60611, USA. 4Division of Rheumatology, Ann & Robert Lurie Children’s Hospital, Feinberg School of Medicine, Northwestern University, 420 East Superior St., Chicago, IL 60611, USA. 5Division of Rheumatology, Cincinnati Children’s Hospital Medical Center (CCHMC), 3333 Burnet Ave., Cincinnati, OH 45229, USA. 6Department of Child and Adolescent Psychiatry, Ann & Robert Lurie Children’s Hospital, Feinberg School of Medicine, Northwestern University, 420 East Superior St., Chicago, IL 60611, USA. 7Division of Behavioral Medicine and Child Psychology, Cincinnati Children’s Hospital Medical Center (CCHMC), 3333 Burnet Ave., Cincinnati, OH 45229, USA. 8Department of Public Health, University of Cincinnati, 2600 Clifton Ave., Cincinnati, OH 45221, USA.
Received: 27 October 2012 Revised: 6 February 2013 Accepted: 21 February 2013 Published: 7 March 2013 References 1. Ainiala H, Loukkola J, Peltola J, Korpela M, Hietaharju A: The prevalence of neuropsychiatric syndromes in systemic lupus erythematosus. Neurology 2001, 57:496-500. 2. Sanna G, Bertolaccini ML, Cuadrado MJ, Laing H, Khamashta MA, Mathieu A, Hughes GR: Neuropsychiatric manifestations in systemic lupus erythematosus: prevalence and association with antiphospholipid antibodies. J Rheumatol 2003, 30:985-992. 3. Sibbitt WL Jr, Brandt JR, Johnson CR, Maldonado ME, Patel SR, Ford CC, Bankhurst AD, Brooks WM: The incidence and prevalence of neuropsychiatric syndromes in pediatric onset systemic lupus erythematosus. J Rheumatol 2002, 29:1536-1542. 4. Olfat MO, Al-Mayouf SM, Muzaffer MA: Pattern of neuropsychiatric manifestations and outcome in juvenile systemic lupus erythematosus. Clin Rheumatol 2004, 23:395-399. 5. Posse S, Binkofski F, Schneider F, Gembris D, Frings W, Habel U, Salloum JB, Mathiak K, Wiese S, Kiselev V, Graf T, Elghahwagi B, Grosse-Ruyken ML, Eickermann T: A new approach to measure single-event related brain activity using real-time fMRI: feasibility of sensory, motor, and higher cognitive tasks. Hum Brain Mapp 2001, 12:25-41. 6. DiFrancesco M, Holland S, Ris D, Adler C, DeBello M, Altaye M, Brunner H: Functional magnetic resonance imaging of cognitive function in childhood-onset systemic lupus erythematosus: a pilot study. Arthritis Rheum 2007, 56:4151-4163. 7. Hochberg MC: Updating the American College of Rheumatology revised criteria for the classification of systemic lupus erythematosus. Arthritis Rheum 1997, 40:1725. 8. Brunner HI, Silverman ED, To T, Bombardier C, Feldman BM: Risk factors for damage in childhood-onset systemic lupus erythematosus: cumulative disease activity and medication use predict disease damage. Arthritis Rheum 2002, 46:436-444. 9. Ross GS, Zelko F, Klein-Gitelman M, Levy DM, Muscal E, Schanberg LE, Anthony K, Brunner HI: A proposed framework to standardize the neurocognitive assessment of patients with pediatric systemic lupus erythematosus. Arthritis Care Res (Hoboken) 2010, 62:1029-1033. 10. Williams TS, Aranow C, Ross GS, Barsdorf A, Imundo LF, Eichenfield AH, Kahn PJ, Diamond B, Levy DM: Neurocognitive impairment in childhoodonset systemic lupus erythematosus: measurement issues in diagnosis. Arthritis Care Res (Hoboken) 2011, 63:1178-1187. 11. DiFrancesco MW, Holland SK, Ris MD, Adler CM, Nelson S, DelBello MP, Altaye M, Brunner HI: Functional magnetic resonance imaging assessment of cognitive function in childhood-onset systemic lupus erythematosus: a pilot study. Arthritis Rheum 2007, 56:4151-4163. 12. Galaburda AM, Holinger DP, Bellugi U, Sherman GF: Williams syndrome: neuronal size and neuronal-packing density in primary visual cortex. Arch Neurol 2002, 59:1461-1467. 13. Sagcal-Gironella AC, Klein-Gitelman M, Baker A, German A, Anderson E, Roebuck-Spencer T, Beebe D, Zelko F, Gitelman D, Holland SK, Brunner HI: Preliminary findings of fMRI assessments of visuoconstructional ability in childhood-onset systemic lupus erythematosus patients and best-friend controls [abstract]. Arthritis Rheum 2009, 60(Suppl 10):1534. 14. Glover GH, Mueller BA, Turner JA, van Erp TG, Liu TT, Greve DN, Voyvodic JT, Rasmussen J, Brown GG, Keator DB, Calhoun VD, Lee HJ,
DiFrancesco et al. Arthritis Research & Therapy 2013, 15:R40 http://arthritis-research.com/content/15/2/R40
15. 16. 17.
18.
19.
20.
21.
22.
23.
24. 25.
26.
27.
28.
29.
30.
31.
32. 33. 34. 35.
Ford JM, Mathalon DH, Diaz M, O’Leary DS, Gadde S, Preda A, Lim KO, Wible CG, Stern HS, Belger A, McCarthy G, Ozyurt B, Potkin SG: Function biomedical informatics research network recommendations for prospective multicenter functional MRI studies. J Magn Reson Imaging 2012, 36:39-54. SPM8, Wellcome Trust Centre for Neuroimaging. [http://www.fil.ion.ucl.ac. uk/spm]. FBIRN. [http://www.birncommunity.org/tools-catalog/function-birn-stabilityphantom-qa-procedures/]. Plichta MM, Schwarz AJ, Grimm O, Morgen K, Mier D, Haddad L, Gerdes AB, Sauer C, Tost H, Esslinger C, Colman P, Wilson F, Kirsch P, MeyerLindenberg A: Test-retest reliability of evoked BOLD signals from a cognitive-emotive fMRI test battery. Neuroimage 2012, 60:1746-1758. Ogg RJ, Zou P, Allen DN, Hutchins SB, Dutkiewicz RM, Mulhern RK: Neural correlates of a clinical continuous performance test. Magn Reson imaging 2008, 26:504-512. Meyer-Lindenberg A, Kohn P, Mervis CB, Kippenhan JS, Olsen RK, Morris CA, Berman KF: Neural basis of genetically determined visuospatial construction deficit in Williams syndrome. Neuron 2004, 43:623-631. Jolles DD, van Buchem MA, Crone EA, Rombouts SA: A comprehensive study of whole-brain functional connectivity in children and young adults. Cereb Cortex 2011, 21:385-391. Buck R, Singhal H, Arora J, Schlitt H, Constable RT: Detecting change in BOLD signal between sessions for atlas-based anatomical ROIs. Neuroimage 2008, 40:1157-1165. Constable RT, Skudlarski P, Mencl E, Pugh KR, Fulbright RK, Lacadie C, Shaywitz SE, Shaywitz BA: Quantifying and comparing region-of-interest activation patterns in functional brain MR imaging: methodology considerations. Magn Reson Imaging 1998, 16:289-300. Fisk JD, Eastwood B, Sherwood G, Hanly JG: Patterns of cognitive impairment in patients with systemic lupus erythematosus. Br J Rheumatol 1993, 32:458-462. Gladman DD, Ibanez D, Urowitz MB: Systemic lupus erythematosus disease activity index 2000. J Rheumatol 2002, 29:288-291. Monastero R, Bettini P, Del Zotto E, Cottini E, Tincani A, Balestrieri G, Cattaneo R, Camarda R, Vignolo LA, Padovani A: Prevalence and pattern of cognitive impairment in systemic lupus erythematosus patients with and without overt neuropsychiatric manifestations. J Neurol Sci 2001, 184:33-39. Fitzgibbon BM, Fairhall SL, Kirk IJ, Kalev-Zylinska M, Pui K, Dalbeth N, Keelan S, Robinson E, During M, McQueen FM: Functional MRI in NPSLE patients reveals increased parietal and frontal brain activation during a working memory task compared with controls. Rheumatology (Oxford) 2008, 47:50-53. Lin Y, Zou QH, Wang J, Wang Y, Zhou DQ, Zhang RH, Zhang YW, Lii HT, Fang YF: Localization of cerebral functional deficits in patients with nonneuropsychiatric systemic lupus erythematosus. Hum Brain Mapp 2011, 32:1847-1855. Mackay M, Bussa MP, Aranow C, Ulug AM, Volpe BT, Huerta PT, Argyelan M, Mandel A, Hirsch J, Diamond B, Eidelberg D: Differences in regional brain activation patterns assessed by functional magnetic resonance imaging in patients with Systemic Lupus Erythematosus stratified by disease duration. Mol Med 2011, 17:1349-1356. Mak A, Ren T, Fu EH, Cheak AA, Ho RC: A prospective functional MRI study for executive function in patients with systemic lupus erythematosus without neuropsychiatric symptoms. Semin Arthritis Rheum 2012, 41:849-858. Rocca MA, Agosta F, Mezzapesa DM, Ciboddo G, Falini A, Comi G, Filippi M: An fMRI study of the motor system in patients with neuropsychiatric systemic lupus erythematosus. Neuroimage 2006, 30:478-484. Wilke M, Holland SK, Myseros JS, Schmithorst VJ, Ball WS Jr: Functional magnetic resonance imaging in pediatrics. Neuropediatrics 2003, 34:225-233. Wechsler D: Wechsler Intelligence Scale for Children - Fourth Edition (WISC-IV). San Antonio, TX, USA: Pearson Education, Inc.; 2003. Wechsler D: Wechsler Adult Intelligence Scale - Fourth Edition (WAIS-IV). San Antonio, TX, USA: Pearson Education, Inc.; 2008. Conners CK: Conners’ Continuous Performance Test II (CPT-II). San Antonio, TX, USA: Pearson Education, Inc.; 2004. Delis DC, Kaplan E, Kramer JH: Delis-Kaplan Executive Function System (D-KEFS). San Antonio, TX, USA: Pearson Education, Inc.; 2001.
Page 12 of 12
36. Wechsler D: Wechsler Abbreviated Scale of Intelligence (WASI). San Antonio, TX, USA: Pearson Education, Inc.; 1999. 37. Daleo DV, Lopez BR, Cole JC, Kaufman AS, Kaufman NL, Newcomer BL, Murphy CE: K-ABC simultaneous processing, DAS nonverbal reasoning, and Horn’s expanded fluid-crystallized theory. Psychol Rep 1999, 84:563-574. 38. Kaufman AS, O’Neal MR, Avant AH, Long SW: Introduction to the Kaufman Assessment Battery for Children (K-ABC) for pediatric neuroclinicians. J Child Neurol 1987, 2:3-16. doi:10.1186/ar4197 Cite this article as: DiFrancesco et al.: Functional neuronal network activity differs with cognitive dysfunction in childhood-onset systemic lupus erythematosus. Arthritis Research & Therapy 2013 15:R40.
Submit your next manuscript to BioMed Central and take full advantage of: • Convenient online submission • Thorough peer review • No space constraints or color figure charges • Immediate publication on acceptance • Inclusion in PubMed, CAS, Scopus and Google Scholar • Research which is freely available for redistribution Submit your manuscript at www.biomedcentral.com/submit