program that included three of the largest ... behavioural model and then as the RTL stabilized, both ... RTL level simulations of a single ASIC would be. In.
Functional Verification of Large ASICs Adrian Evans, Allan Silburt, Gary Vrckovnik, Thane Brown, Mario Dufresne, Geoffrey Hall, Tung Ho, Ying Liu Nortel P.O. Box 3511, Station C, Ottawa, Ontario, K1Y-4H7, Canada 1-613-{763-6328,763-7975,763-4365,763-5482,763-7898,763-9729,765-5007,763-6358}
{abe, silburt, garyvrck, thane, dufresne, hallg, tungho, yingliu}@nortel.ca
1. ABSTRACT This paper describes the functional verification effort during a specific hardware development program that included three of the largest ASICs designed at Nortel. These devices marked a transition point in methodology as verification took front and centre on the critical path of the ASIC schedule. Both the simulation and emulation strategies are presented. The simulation methodology introduced new techniques such as ASIC sub-system level behavioural modeling, large multi-chip simulations, and random pattern simulations. The emulation strategy was based on a plan that consisted of integrating parts of the real software on the emulated system. This paper describes how these technologies were deployed, analyzes the bugs that were found and highlights the bottlenecks in functional verification as systems become more complex. 1.1 Keywords ASIC Verification, Simulation, Emulation
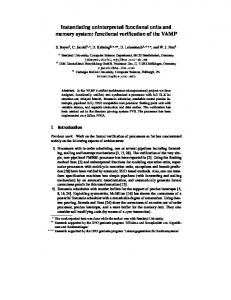
writing a behavioural model (BEH) for each of the three devices. A conformance test-plan (CTP) document was written for each ASIC, enumerating all the features and functions that required verification. Based on this document, a regressionable testbench suite was written for each ASIC. Initially, the testbenches were developed using the behavioural model and then as the RTL stabilized, both platforms were used for writing testbenches. [1] Near the end of the ASIC testbench effort, system testbench development began in parallel using the behavioural models. The objective of these simulations was to prove the interfaces between ASICs and verify the protocol error conditions. Only functionality that required multiple ASICs to prove correct operation was simulated at this level. As the directed ASIC and system simulation efforts completed, the TLSC (Top Level Simulation Complete) milestone was declared; however the bug find rates remained high. It was apparent that the feature driven test-plan had not sufficiently verified interactions when multiple features were enabled in combinations. To address these holes, an Extended Simulation Plan (ESP) was developed in order to create random and multi-feature tests and to target those lines of code that had not been simulated based on codecoverage reports. These tests proved extremely valuable in finding obscure bugs. IC SRTD
A TLSC
TB CODING RTL CODING BEH MODEL
SYS
This paper describes the ASIC functional verification techniques that were deployed on a recent large hardware development program. It details the simulation and emulation methodologies and provides an in-depth analysis of the bugs that were found with both technologies. Finally, some of the bottlenecks of each technology are presented with ideas on how to overcome them in the future.
ASIC
2. INTRODUCTION
B C SRTL
ESP
EMULATION SOFTWARE SYS SIM
Legend : IC=In Circuit (first functional hardware in emulation lab) A,B,C=Emulation Software Milestones (section 3.2) SRTD=Start of Design TLSC=Top Level Simulation Complete SRTL=Start of Layout ESP=Extended Simulation
The project consisted of three new circuit boards connected via a high speed backplane using a proprietary protocol. A full system consists of 26 boards. Various combinations of the three ASICs reside on each of the circuit boards. These ASICs interface with high speed memories and powerPC microprocessors. For the purposes of this paper, we will refer to the chips as Alpha, Beta and Gamma. They were fabricated in a 0.25 micron process and had gate counts of 482K gates, 824K gates and 635K gates, respectively.
During the TLSC to SRTL (start of layout) interval, timing analysis, floorplanning, DFT and synthesis were completed.
3. Verification Methodology
3.1 Behavioural Model
The simulation methodology shown in figure 1, consisted of
Figure 1. ASIC Development Gantt Chart
The ASIC behavioural(BEH) models were written in Verilog, were pin compatible with the RTL model and
th
35 Design Automation Conference ® Copyright ©1998 ACM 1-58113-049-x-98/0006/$3.50
DAC98 - 06/98 San Francisco, CA USA
implemented nearly all of the device functionality. They were written at a high level of abstraction, manipulating entire transactions rather than individual signals, and thus required less effort to write and simulated faster than the RTL. As the latency through the behavioural model was not the same as that of the RTL implementation, testbenches had to be tolerant of both sets of timing. Early in the project, it was unclear how manageable full RTL level simulations of a single ASIC would be. In addition, considering the size of the design teams and the tight schedule, there was concern over the amount of time it might take to integrate the partially tested RTL blocks at the ASIC top level. Therefore, the behavioural models were written at the ASIC sub-system level. That is, the behavioural model was structurally decomposed into the same sub-systems as the RTL code for the ASIC. This approach enabled the possibility of mixed BEH / RTL chip level simulations. By modeling at the sub-system level, the verification team helped to formalize the internal interface specifications and maintain adherence to them. Finally, by modeling at this level, the verification team was able to deliver a ready-made test environment to each sub-system designer. These benefits enabled top level RTL integration times of between a day to a week from the first attempts at ASIC level simulations to successful testbench runs. BEH ASIC SUBSYS1 SUBSYS2 SUBSYS3
RTL BLOCK1 ... BLOCKN
Figure 2. Sub-System Level Modeling
The choice to model at a lower level of hierarchy meant that the behavioural model simulation speed gain was limited by the additional simulation events from the internal interfaces. Furthermore, this approach necessitated additional work in order to track changes in the internal interfaces. Other benefits of the behavioural model were that it found discrepancies between the RTL and the specification, as it provided an alternative view of the specification. Several times, a testbench initially developed on the RTL failed on the behavioural model due to an error in the RTL that was duplicated in the testbench; these would otherwise have gone undetected in simulation. The most important benefit of the model, however, was that it allowed the verification teams to become thoroughly familiar with the functionality of the devices very early in the project.
3.2 Emulation Methodology The emulation system implemented 2.4 Million ASIC gates in a total system configuration of 5 circuit boards and multiple instances of each device. Each ASIC was reduced in size from the original by removing duplicated logic, nonmission mode logic, and in the case of the Beta, by
synthesizing with area constraints and relaxed timing. The emulation elements were filled to capacities of between 68% and 97%, with most (60%) being filled to greater than 90% capacity. In some cases, this high utilization made it difficult to insert probes for debugging problems. Production quality firmware was used on the circuit cards. Virtually all of this firmware is being reused in the production system. The firmware staff noted that the emulation environment was the most stable prototype platform available to them for developing their code. Special high level software was written for the emulation platform in order to prove the hardware functionality. The software was rolled out in three phases (see figure 1) : A. major features of the ASICs were tested and a software development environment was established. B. every feature of each ASIC was tested in a stand alone fashion. C. every feature of each ASIC was tested repeatedly and in random combinations over long durations. The requirements specification of the software tests was driven primarily by the ASIC teams. Approximately 40% of the high level software that was developed is considered production code that will be reused in the real system. In addition, the software designers reported that several design years worth of experience on the system was gained and that in later development the most productive software designers were those that had worked with the emulation system. Overall, the total number of netlist revisions that was emulated was 32 Alpha, 18 Beta and 16 Gamma. New netlists were compiled as functionality was added or bug fixes were addressed in the design. The average time to process each netlist (fully compile and go in-circuit) varied from 3 weeks with the first full netlists, to 12 hours with the final full netlists.
4. Project Retrospective The graph in figure 3 shows a breakdown of the effort spent between the start of design (SRTD) and start of layout (SRTL) milestones, averaged across all three devices. The lower sections represent tasks not associated with functional verification, the remainder is functional verification. The slice "RTL and block test" in figure 3 includes block and sub-system level design and testbench effort. At this level of hiearchy, it was not possible to separate these two tasks. In effect a portion of this slice could be grouped with verification. From figure 3, it is clear that functional verification represents well over 50% of the effort from SRTD to SRTL. It is interesting to note that on the Alpha and Beta ASICs, functional verification was on the critical path. Timing clean and floor-planned netlists were available well in advance of their actual SRTL dates. In other words, the tape out was delayed in order to find and address functional bugs. As devices become more complex, functional verification is increasingly on the critical path[2,3].
System Simulation ASIC Testbenches
Extended Simulation Equivalence Checking Emulation Support Emulation Software
The designers were asked to rank the probability that each bug could have been found by an alternate technology on a scale of high, medium or low. The results are summarized in tables 1 and 2. Note that two bugs were found almost simultaneously by both simulation and emulation, and have thus been included under both categories.
5.1 Emulation Bugs In table 1, we summarize the severity and probability of being found by simulation for each of the emulation bugs :
Verification Beh Model
the DOA category. The last DOA bug was found three months before the SRTL of that device
Design
Severity
High Level Design
Timing Analysis DFT Synthesis
RTL and Block Test
Chance of Finding in Simulation
DOA
Respin
Minor
Hi
Med
Low
Alpha
0
18
6
8
13
3
Beta
3
6
4
5
4
4
Gamma
1
4
5
3
3
4
Table 1: Emulation Bug Classification
Figure 3. Breakdown of Effort
5. Bug Analysis Accurate bug information was kept for emulation bugs from the beginning of the project and for simulation bugs from TLSC onwards. Prior to TLSC, it is difficult to separate bugs from code development and evolution. Each bug was classified by severity according to the effect if the bug had been left unfound in the actual silicon: minor a simple software or board fix exists to workaround the bug respin the chip could be used for lab work and initial software development with the bug present, but would have to be respun prior to shipping the product to the customer DOA (dead on arrival) the device would be of limited use in the lab Dead On Respin Arrival (64) (7)
Minor (37) Figure 4. Bug Breakdown by Severity
Figure 4 shows a break-down of the bugs by severity. It is interesting to note that only a small number of bugs fit into
Overall, 47 bugs were found through emulation (24 Alpha, 13 Beta, 10 Gamma). The severity of the emulation bugs was classified as 4 DOA, 28 respin and 15 being minor problems. Of the emulation bugs, 34% had a high probability of being found in simulation, 43% had a medium probability and 23% had a low probability of being found by simulation. Of the bugs that had a low probability of being found in simulation, 55% would have resulted in a respin and 45% were minor. All three ASICs had at least one bug in the category: respin severity and low probability of finding it with simulation.
5.2 Simulation Bugs In table 2, we summarize the severity and probability of being found by emulation for each of the simulation bugs. Severity
Chance of Finding in Emulation
DOA
Respin
Minor
Hi
Med
Low
Alpha
0
4
2
0
3
3
Beta
2
12
7
6
6
9
Gamma
1
22
13
2
12
22
Table 2: Simulation Bug Classification
Overall, 63 bugs were found by post-TLSC simulation (6 Alpha, 21 Beta, 36 Gamma). The severity of these simulation bugs was classified as 3 DOA, 38 respin and 22 minor. Of the simulation bugs, 13% had a high probability of being found in emulation, 33% had a medium probability and 54% had a low probability of being found by emulation.
Of the bugs that had a low probability of being found in emulation, 53% were respin severity and 3% were DOA severity. All three ASICs had at least one bug in the category : respin or DOA severity and low probability of finding it with emulation.
5.3 Coverage Overlap In comparing the three devices, it is interesting to note the predominance of bugs found by emulation on Alpha and by simulation on Gamma. This is due to the fact that Alpha completed functional design several months ahead of the other two devices. A conscious decision was made to rely on early emulation, rather than extend the simulation effort on Alpha. Gamma, on the other hand, had the most simulation effort. As seen in tables 1 and 2, there is a strong correlation between where the effort was invested and where the bugs were found. Simulation and emulation both have certain characteristics that make them better suited to finding certain types of bugs. These characteristics are summarized in table 3 : Emulation
Simulation
Greater throughput
Precise event timing control
Gate level representation
Greater observability
Software Stimulus
Greater control of the environment
Board netlists and board environment
Runs at true clock frequency
Table 3: Characteristics of Emulation and Simulation
From the low probability slices, in figure 5, it is clear that there are bugs that have a low chance of being found with only one verification technology. Low (34)
Medium (20)
Low (11)
related to external memory timing violations under error cases. Such violations would not be detected in emulation unless they actually corrupt memory contents, which is unlikely with the reduced clock speed. Others are related to the fact that only a partial system is being emulated; thus certain traffic scenarios are not possible. Still others relate to scenarios that are difficult to setup from high level software. The throughput afforded by emulation can find bugs that would require extremely long simulations. Since the emulation system used actual circuit boards, system level interconnect problems were found. Additionally, software usage of the hardware exercised the chips in manners the hardware verification team had not considered. In table 4, we have classified the bugs found by emulation both by that attribute of emulation which enabled the bug to be found as well as by the probability that it could have been found by simulation. Those bugs in the right hand column are especially significant as they were very unlikely to have been found by simulation. There was one noteworthy bug in the "Board Environment" row, in the low column, which was not found earlier in simulation because the electrical characteristics of a certain bus were not correctly modeled in the simulation environment. The bug in the "Gate Level" row with low probability of being found in simulation relates to a problem in the re-synchronization of signals across an asynchronous boundary. This bug manifested itself in emulation, only during long traffic soaks. Interestingly, there are a large number of bugs in the "Richness" row related to richness of stimulus afforded by real software running on the emulation platform. Total
Hi
Med
Low
Throughput
6
0
5
1
Richness
16
7
9
0
Gate Level
7
4
2
1
Board Environment
7
3
1
3
Real S/W
9
2
3
4
Other
2
0
0
2
Table 4: Classification of Emulation Bugs
6. Bottlenecks
High (8) High (16)
Medium (21) Simulation Bugs
Emulation Bugs
Figure 5. Alternate Bug Find Probability
Some of the bugs that are difficult to find in emulation are
In order to compress the ASIC verification interval, it is important to understand where the true bottlenecks lie.
6.1 Simulation Time There are two very different areas where simulation time impacts productivity : testbench development and running the regressions. Table 5 captures some simulation speed data for Gamma, which is also typical for the other devices. All simulations were done in Verilog and the data is
averaged for Sparc-20 and Sparc Ultra-1 class machines : RTL
BEH
BEH (virtual i/o)
platform was initially the behavioural model. In order to compress the duration of the testbench coding interval, a large team size was applied to the task. Figure 6 shows the testbench team sizes for Beta and Gamma over the course of the project : 12
Beta
Average ASIC TB Compile/Link/Run Time
2 hr
Total Regression Suite Run Timea
8 days
52 min
12 min
Gamma
10
a.Behavioural regression uses a mixture of normal and virtual interfaces. Table 5: Simulation Speed Data
A behavioral modeling technique that was successfully applied was one which we call "virtual interfacing". When modeling a device that receives frames serially, it is possible to bypass the physical interface by transferring entire frames directly into the model with a single simulator event. Using this technique on the high speed interfaces, eliminated the simulation events associated with the high speed clocks and resulted in significant simulation speedups (right hand column in table 5). For certain tests involving the physical aspects of the interface, this technique was disabled. The behavioural regression used a mixture of real and virtual interfaces. From the data in table 5, several observations can be made. The compile/run time for a RTL simulation is on the order of a few hours and with a behavioural model with virtual interfaces this is ten times faster. The typical ASIC testbench consisted of between two and three independent tests that could generally be developed in isolation. Thus with the behavioural model with virtual interfaces, the average simulation iteration time was approximately 5.5 minutes. With RTL this interval was 50 minutes. Therefore, simulation times are manageable even for extremely large devices, especially with behavioural models. The second aspect of simulation consists of regularly running the regression suite during the later phases of the design cycle. The time required to run the regression is limited by two factors : the number of workstations on which to distribute the jobs and the duration of the longest testbench. Given this, a complete regression for any of the devices could essentially be run over a weekend, if spread across about 10 workstations. Here again, there isn’t a real bottleneck : given sufficient workstations, simulator licenses and judicious sizing of the testbenches, the regression interval can be managed.
6.2 Testbench Development The real bottleneck in functional verification was the development and debugging of the testbenches. From figure 3, we see that the ASIC, system and extended simulation testbenches alone represented over a third of the total effort. Testbench coding can not begin until a platform for writing and debugging testbenches is in place. In this case the
Team Size
8
14 hr
6
4
2
0
Month Figure 6. Testbench Team Size
Ramping-up the necessary people was a challenge. The testbench coding team consisted of behavioural modelers, dedicated testbench coders, RTL designers and contractors. For people joining the project as testbench coders, reading the ASIC specifications and learning about the system operation required from several weeks to over a month. New people often required help when debugging obscure problems, whether they lay in the testbench, behavioural or RTL code. We found that a dedicated verification team that started by writing behavioral models was effective in enabling a large, productive team to be built.
6.3 Emulation Bottlenecks The emulation process can be broken up into three distinct phases : going in-circuit, debugging and recompiling the netlists. Going in-circuit for the first time requires a target board to be manufactured and the first in-circuit netlist needs to be compiled. Each target board required about two person months of effort to produce. Each netlist took about three weeks to compile the first time. Once the netlist was compiled, an interconnection from the emulator to the target board was created. This typically took about one week to design and test. The major bottleneck in debugging was the amount of time it took to add probes to the netlists. Adding probes would typically take between an hour and a day depending upon the utilization of the emulation hardware. To completely debug a problem several iterations of adding probes was often required. Another bottleneck in the debugging cycle was the difficulty of replicating problems that arose. This was due to the need to have identical software loads, ASIC netlists and starting conditions. After the first compile of a netlist the emulation team could start writing scripts to automate the compile process. With each compile of the ASIC, the scripts were improved until
compiles were being completed in under 12 hours. Since the compiles were done over the network, LAN traffic had a major effect on the time to compile an ASIC. With no network traffic the compiles could be completed in under 6 hours.
visibility of all netlist nodes. This should greatly improve the debug cycle because probing will no longer require recompilation Finally, compile effort with the newer systems is also reduced, and faster workstations should allow for faster recompiles.
Another major bottleneck in emulation is the number of platforms available for development and debugging. In this project, software development, firmware development, bug tracing and lab issues all competed for the same resource. Had multiple platforms been available, then these tasks could have been parallelized and overall efficiency would have improved. However, the high cost of emulation equipment makes replicating the platform impractical. This remains one of the most serious impediments to productivity improvement using emulation.
Given these improvements, software development and hardware debug, will be limited by the number of emulation platforms available prior to tape-out. Without a significant reduction in cost, the bottleneck associated with sharing a single platform between multiple users will remain an issue in using this technology.
7. Looking Forward 7.1 Simulation We observe that the dominant activities in testbench development are the intellectual process of understanding the device behaviour, the feature to be tested and interpreting the results of simulation runs. As a result, the opportunity for productivity improvement through faster simulation or coding productivity tools is limited. Faster simulators are certainly welcome and will provide an incremental improvement in productivity, but they will not drastically reduce the overall verification effort. Verification productivity tools largely address shortcomings in HDLs and facilitate the development of random tests. These tools may provide incremental improvements in testbench coding productivity, however, they do not address the issue of ramping-up a large verification team who understand the system. In order to address the large testbench team problem, two things can be done. First, these people should be involved in the project as early as possible in order to learn about the system, either as behavioural modelers, RTL designers, firmware developers, etc. Second, good teaching material must be created in order to help new people understand the system being designed. This can be achieved through explanatory documentation, tutorials, walk-through documents or debugging guides. Model Checking formal verification tools may provide a productivity gain for block level verification where the tools can handle the state space. It is unlikely that model checking will be applicable at the ASIC or system level on a project of this size, because of the state explosion problem. From isolated tests we have found this technology has the potential to find obscure bugs in communicating state machines early in the design cycle.
7.2 Emulation The increased capacities of modules in newer emulation systems should decrease the time to compile a netlist for the first time, as partitioning will be much easier. Newer emulation systems are also evolving towards 100%
8. Conclusions Several key observations emerged during the course of the design of the ASICs. First, was that functional verification represents the largest single task in the design to layout interval. Second, based on the high bug find rates after the TLSC milestone, that a targeted, feature driven test plan is not sufficient when complex feature interactions are present. The directed tests must be supplemented with extensive random and heavy traffic tests. We observed that there is value in emulating as early as possible, but the system should not be handed over to software staff until high quality netlists are available and all known lab issues have been resolved. With increased simulation coverage, the number of bugs that will be found in emulation is reduced. However, with devices of the complexity of those on this project, it appears that regardless of how much simulation is done, there is a significant probability that some respin severity bugs will remain, some of which can be found through emulation. Real software interacting with the ASICs generates a richness of stimulus that is difficult to achieve in simulation. Finally, there is no revolutionary new verification technology on the horizon. Simulation will remain the workhorse for functional verification for the foreseeable future. Faster simulators will enable simulation to track ASIC growth, but will not significantly reduce the overall effort devoted to functional verification.
9. ACKNOWLEDGEMENTS Our thanks go out to the entire project team, especially Joël Bolduc, David Wheelock and Randy Mullin, for the information they shared to make this paper possible.
10. REFERENCES [1] Silburt, A., Perryman, I., Bergeron, J., Nichols, S., Dufresne, M., Ward, G., “Accelerating Concurrent Hardware Design with Behavioural Modelling and System Simulation”, Design Automation Conference 1995. [2] Miklosz, John, “Meeting the Crisis in Confidence That Complexity Causes”, Integrated Systems Design, August 1997. [3] Silburt, A., Evans, A., Vrckovnik, G., Dufresne, M., Brown, T., "Functional Verification of ASICs in Silicon-Intensive Systems", DesignCon98, January 1998, Santa Clara, California.