Science of the Total Environment 599–600 (2017) 981–991
Contents lists available at ScienceDirect
Science of the Total Environment journal homepage: www.elsevier.com/locate/scitotenv
Functioning grouped soil microbial communities according to ecosystem type, based on comparison of fallows and meadows in the same region Dominika Chmolowska a,⁎, Dana Elhottová b, Vaclav Krištůfek b, Maciej Kozak d, Filip Kapustka c, Szymon Zubek d a
Institute of Systematics and Evolution of Animals, Polish Academy of Sciences, Sławkowska 17, 31-016, Kraków, Poland Biology Centre AS CR, v.v.i., – Institute of Soil Biology, Na Sádkách 7, 370 05, České Budějovice, Czech Republic Institute of Environmental Sciences, Jagiellonian University, Gronostajowa 7, 30-387, Kraków, Poland d Institute of Botany, Jagiellonian University, Kopernika 27, 31-501 Kraków, Poland b c
H I G H L I G H T S
G R A P H I C A L
A B S T R A C T
• Soil microbial community structure and activity was compared in fallows and meadows. • AMF root colonization was higher in meadows than in fallows. • The AMF activity was promoted with increasing soil pH and lower N, P, K availability. • Meadows had higher soil respiration, lower cellulose- and N-mineralization rates. • Soil microbiota formed functional ecotypes characteristic for the ecosystem type.
a r t i c l e
i n f o
Article history: Received 19 December 2016 Received in revised form 18 April 2017 Accepted 28 April 2017 Available online 11 May 2017 Editor: D. Barcelo Keywords: Microorganisms Grassland Abandoned farmland Diversity Structure Spatial scale
a b s t r a c t Predicting the composition and function of microbial communities at a bio-geographical scale, across ecosystems, is challenging. We compared six abandoned fields to six meadows to see whether soil microbial community structure and activity are more similar within the ecosystem type than between the types. We implemented bacteria and fungi phylogenetic markers profiling, phospholipids analysis, fluorescence counts of total bacteria and algae and microscopy of arbuscular mycorrhizal fungi (AMF). The functional performance of microbial communities was assessed using enzymes activity measurements as well as culturing and incubation experiments. The studied fallows and meadows had similar biomass and general structure of soil microbial communities. However, the AMF root colonization frequency was higher in the meadows than in the fallows. The AMF colonization was promoted in meadows characterised by lower availability of NO− 3 , P and K as well as higher soil pH, which additionally hampered plant acquisition of P at the P-limited ecosystem. Fallow and meadow microbial communities showed characteristic functional traits. Meadow soils exhibited higher basal respiration rate, while cellulose decomposition and nitrogen mineralization were faster in fallows. Even when no major differences in community structure could have been detected soil microbial communities adapted to local and/or instantaneous environmental conditions and formed functionally-specific ecotypes. This work points out the relevance of preserving meadows as reservoirs of plant
⁎ Corresponding author. E-mail address:
[email protected] (D. Chmolowska).
http://dx.doi.org/10.1016/j.scitotenv.2017.04.220 0048-9697/© 2017 Elsevier B.V. All rights reserved.
982
D. Chmolowska et al. / Science of the Total Environment 599–600 (2017) 981–991
diversity, which cope excellent in nutrient depleted conditions and in mountain regions thanks to microbial components of ecosystem. © 2017 Elsevier B.V. All rights reserved.
1. Introduction Are microbial communities predictable across spatial and ecological gradients? To what extent is the composition and functioning of a soil microbial community driven by plant community, soil properties or field management? Based on the study of PLFA and T-RLFP on a successional gradient from dwarf shrubland (moorland) to deciduous woodland, Mitchell et al. (2010) stated that ‘The vegetation composition predicted the soil microbial community at least as well as the soil chemical data’. However, the plant community was more reliable in predicting microbial community composition than soil properties, because the most meaningful set of soil properties varied between sites. The authors speculated that vegetation inherit and summarise soil properties. Many studies compared effects of soil management practices on soil microbiota biomass and composition. For example, Steenwerth et al. (2003) were able to group the PLFA-based structure of microbial communities according to land use types: annual or perennial grassland, watering, fallowing and herbicide treatment. Allison et al. (2007) showed that microbial PLFA biomass increased and the community structure changed along a successional gradient of prairie restoration. Global studies pointed out driving effect of edaphic properties on soil microbial communities (Lauber et al., 2009; Liu et al., 2014; Tedersoo et al., 2014). However, at the large scale microbial communities are also structured by distance (Berner et al., 2011; Griffiths et al., 2011; Mi et al., 2012; Liu et al., 2014), what can hinder the impact of the whole ecosystem, if there are no real replicates of ecosystems in each location. Large scale studies are limited in their resolution as function. If plant cover is taken into account the sorting is simplified and divergent ecosystem types are treated as one group, e.g. maintained meadows, initial stages of secondary succession, ruderal fields, plots with low and high species richness might be placed into grassland. This may also resulted losing the significant and actual part of variability. Thus, while the edaphic and climatic factors are metric and can be analysed conveniently, to test the biocenoses/ecosystems effects is less straightforward. Therefore, a study with ecosystem replicates in one location was needed to observe the ecosystem type effect on soil microbial community structure and activity. Even though the number of data on the distribution of bacteria and fungi over large geographic scales is growing in recent years, there is still lack of data combining the distribution of species or whole groups of microorganisms with their functional abilities and field performance. Microbial biologists, who characterize communities using gene phylogenies are often unable to resolve functional traits, while the ecology underwent a shift in perspective from taxonomy to function (Krause et al., 2014). Microbial ecotypes might be more useful in environmental microbiology, because of the enormous microbial diversity, physiological plasticity and redundancy (Bohannon, 2008; Green et al., 2008). Different niches inhabited by the same species, even in one area, generate microbial ecotypes that have different adaptations and thus different habitat preferences (Bohannon, 2008). This study was performed to answer the question if soil microbial communities, structure and activity, are specific to ecosystems at a local geographical scale. For this purpose two ecosystem types at different successional stages, namely fallows and meadows, were compared. The two ecosystem types with similar total plant biomass were chosen in order to eliminate potential effect of this variable. Evident differences in microbial community properties among biocenoses with contrasting plant biomass was described elsewhere (e.g. Kageyama et al., 2008; Nacke et al., 2011; Wallenius et al., 2011; Blaško et al., 2015). The plots were distributed over a few kilometers range. In studies conducted
at a local scale, that is over a few kilometre range, distance effect seemed negligible (Martiny et al., 2006; Zinger et al., 2011). At a local scale, environmental/habitat factors started to play a role however. The research comprised real field replicates of six fallow and six meadow plots and consisted of detailed examination of vegetation composition, soil properties, microbial community structure and activity. The plant community composition and soil physico-chemical properties were described in detail (Chmolowska et al., 2016). Herein we present a few years of research on soil microbial communities conducted with the unique combination of tools. The study has also got a practical aspect since the area of fallows has been increasing in Europe (Keenleyside and Tucker, 2010; Renwick et al., 2013). While, the fresh meadows chosen for the research, representing communities within the Arrhenatherion alliance, are protected by Natura 2000 network as valuable, endangered and rapidly disappearing habitat type in Europe. 2. Methods 2.1. Sites description Six fallows and six meadows chosen for this research were located in Polish Western Outer Carpathians (the Beskid Sądecki Mountains), near the Krynica-Zdrój town (49° 25′ 17″ N; 20° 57′ 33″ E), a few kilometers apart from one another. The area is not favourable for farming for its hilly landscape and mountain climate, and extensively used meadows have dominated there over other agricultural practices for centuries. The climatic conditions are: vegetation period 170–185 days, annual average precipitation 890 mm, average annual temperature + 4 °C above 600 m a.s.l. (fallow 1, 6, meadow 1, 2) and + 6 °C between 500 and 600 a.s.l. (all remaining plots). The type of ecosystem (fallow or meadow) was determined according to the floristic composition. Fallows were characterized by the presence of ruderal and segetal weeds (especially couch grass Elymus repens) and low plant diversity (less than 27 species per 25 m2 plot, Table A). For meadows the indicators were: high proportion of species characteristic for the Molinio-Arrhenatheretea class and high richness of plant community (plant species number 35– 50 per 25 m2 plot, Table A). History of the plots can be inferred from their plant composition and diversity, soil properties and typical management observed in the Polish Western Outer Carpathians. The meadows are regularly mowed, usually once a year. The hay making takes place from the second half of June up to the beginning of July, depending on the elevation. After that, in the late summer, most of them are extensively grazed, mainly by cows and/or sheep. The meadows are moderately fertilised once a few years with organic fertilisers, liming is uncommon. Fallows are much younger ecosystem resulting from secondary succession on farm fields, in which cultivation was abandoned. The younger age of fallows is confirmed by lower plant diversity characteristic for initial secondary succession, presence of ruderal and segetal weeds, lower soil C:N ratio and water holding capacity (Chmolowska et al., 2016). We observed that arable lands in the Polish parts of Carpathian mountains are fertilised with organic and inorganic fertilisers, and sometimes with after-crops. Much higher concentrations of available P, K and nitrates in the studied fallow than meadow soils confirmed it. Fallow soils had almost tenfold higher concent of P2O5, threefold higher of K2O and sevenfold higher of NO− 3 than meadow soils on average (Chmolowska et al., 2016). The soil pH did not differ statistically between fallows and meadows. However, the fallows were acidic or slightly acidic while meadows ranged from acidic and slightly acidic to neutral and even alkaline. Usage of ammonia-containing fertilizers, could have led to the acidity of ex-arable fields. The
D. Chmolowska et al. / Science of the Total Environment 599–600 (2017) 981–991
neutral and alkaline soils in meadow 5 and 6 respectively, had higher contents of total calcium than other soils, which most probably originated from their bedrocks and/or river mud of Mochnaczka river. In particular the alkaline soil in meadow 5 consisted free calcium carbonate (Chmolowska et al., 2016). Higher variability in soil pH and nutrients content in grassland than in arable fields at the same mountain range was observed in a Carpathian study (Zarzycki et al., 2011). In total 15 soil physicochemical properties were determined in the studied plots: water holding capacity (WHC), pH in H2O and in 1 M KCl, Cation Ex+ change Capacity (CEC), total N, C, Ca, Na Mn, K2O, P2O5, NO− 3 , NH4 , sand, silt, clay and organic matter (OM) contents. Soil texture was classified and C:N ratio was calculated. Full data and methods of plant community composition and soil physicochemical properties are available in Chmolowska et al. (2016). Basic descriptors are presented in Table 1 and Table A. 2.2. Sampling The soil was sampled for three years in June and November 2008, June 2009 and June 2010. Basal soil respiration was measured every sampling event. A year 2009 was a major time-point of the study and the following analyses were performed: soil enzymes, N mineralization and cellulose decomposition, physiological profiling on Biolog™ Eco plates, R2A agar inoculation, bacteria DAPI-stained counts, arbuscular mycorrhizal fungi root colonization, phospholipid and neutral lipid fatty acid (PLFA and NLFA) analysis. In addition, in June 2008 a study on spatial heterogeneity of soil respiration was conducted, in November 2008 soil algae were enumerated and in June 2010 phylogenetic
983
profiling was done. From each of the six fallows and six meadows ten soil cores 10 cm deep were taken along the 18 m random transect. For soil algae enumeration, three cores 3 cm deep were taken per field because soil algae, which are photosynthetic autotrophs, are present only in the very top soil layer. The cores from one plot were pooled and then sieved through 4 mm mesh. Separated root bulks were used for AMF colonization measurements. To asses soil spatial heterogeneity, three meadows and three fallows were sampled. Five soil cores 10 cm deep were taken from each plot, one from each corner and one from the centre of the 100 m2 square. They were handled separately during sieving, storing and throughout the soil respiration measurements. Field-moist soil samples were stored at 4 °C prior to chemical and biological analyses, apart from PLFA and T-RLFP analyses, for which the samples were frozen at − 29 °C, and enumeration of soil algae for which the soils were stored air dried. Respiration rate and enzymes activity were assessed after 3–5 day incubation in darkness at 22 °C and 70% air humidity to let the soil communities stabilize before the measurements. 2.3. Soil respiration For respiration rate measurements soil moisture was adjusted to 50% maximum water holding capacity (WHC) and the samples were incubated in darkness at 22 °C. Soil basal respiration rate was measured in soil samples equivalent to 10 g dwt. with the automated MicroOxymax respirometer (Columbus Instruments), and substrate-induced respiration (SIR) by the titration method (Niklińska et al., 2005) in samples equivalent to 50 g dwt. Substrate-induced respiration (SIR) was
Table 1 Fallows and meadows main soil characteristics, soil microbial activity and biomass estimates. Means ± standard deviation; sign. Dif.: significant difference by a Student t-test or Mann – Whitney U test: * p b 0.05, ** p b 0.01, *** p b 0.001; fallow: n = 6, meadow: n = 6; ^ meadow: n = 5. Soil properties are retrieved from Chmolowska et al., 2016. Soil properties
Unit
Fallow
Meadow
pH in H2O Organic matter CEC K2O P2O5 NO− 3 NH+ 4
% cmol(+)·kg−1 mg·kg−1 mg·kg−1 mg·kg−1 mg·kg−1
5.9 ± 0.4 6.2 ± 1.6 1524 ± 553 302 ± 157 41.8 ± 25.9 12.3 ± 3.5 3.3 ± 1.4
6.5 ± 0.8 7.9 ± 2.2 2618 ± 1665 83 ± 30 4.8 ± 2.6 1.7 ± 2.4 3.6 ± 2.0
Microbiological properties Respiration per dwt. Respiration per OM Acid phosphatase Alkaline phosphatase Urease N mineralization Cellulose decomposition Active biomass Cmic per OM qCO2 per OM qCO2 per dwt−1 Total bacteria Culturable bacteria Culturability Mycorhhizal frequency (F) Relative mycorrhizal root length (M)
μlCO2 ·g−1 ·h−1 μlCO2·g om−1 ·h−1 μg pNP ·g·h−1 μg pNP·g·h−1 μgN·g−1·2 h−1 μgN·g−1·d−1 % mg·g OM−1 ml CO2·g OM−1 ·g biomass−1 ml CO2·g dwt−1 ·g biomass−1 cell·108·g−1 CFU·107·g−1 % % %
2.0 ± 0.4 16.2 ± 3.2 67.1 ± 16.0 29.9 ± 16.1 95.1 ± 33.9 56.2 ± 16.2 55.7 ± 20.8 5.6 ± 1.1 2.9 ± 0.5 2.9 ± 0.5 11.8 ± 2.0 5.3 ± 1.2 4.7 ± 0.9 28.9 ± 24.1 11.2 ± 10.4
3.2 ± 0.8 12.6 ± 2.8 95.0 ± 32.1 50.1 ± 31.6 124.5 ± 26.3 30.5 ± 12.7 21.8 ± 24.0 5.0 ± 1.8 2.1 ± 0.5^ 4.2 ± 0.6 9.6 ± 2.0 4.2 ± 1.4 4.7 ± 1.4 64.3 ± 26.2 28.8 ± 20.0
nM·g−1 nM·g−1 nM·g−1
129 ± 16 59.0 ± 7.6 14.3 ± 2.3 0.69 ± 0.30 11.0 ± 8.3 6.09 ± 0.83 11.0 ± 1.0 45.7 ± 0.6 7.1 ± 3.0 0.91 ± 0.59 4.7 ± 0.4 0.24 ± 0.02 1.39 ± 0.28
149 ± 31 70.5 ± 15.1 16.4 ± 2.6 0.42 ± 0.22 2.5 ± 4.4 7.97 ± 1.88 11.1 ± 1.8 47.2 ± 1.0 5.2 ± 3.8 0.84 ± 0.31 5.4 ± 0.8 0.24 ± 0.04 1.28 ± 0.22
PLFA & NLFA total PLFA Bacteria Fungi NLFA:PLFA AMF (NLFA) AMF (PLFA) Fungi [%] Bacteria [%] Actinomycetes [%] Protists [%] AMF [%] F:B G(+):G(−)
nM·g−1 nM·g−1 % % % % %
Sign.dif.
** ** ***
*
* * * **
*
*
*
984
D. Chmolowska et al. / Science of the Total Environment 599–600 (2017) 981–991
measured after a 4-h incubation of soil amended with glucose at the rate 3 mg g dwt.−1 and substrate-active biomass was calculated according to Anderson and Domsch (1978). Metabolic quotient qCO2, that is the ratio of microbial respiration rate to biomass, was calculated as the ratio of basal microbial respiration rate to SIR biomass. 2.4. Soil enzymes, N mineralization and cellulose decomposition Acid and alkaline phosphomonoesterase activities were measured with the method of Tabatabai and Bremner (1969), and Eivazi and Tabatabai (1977) in modification by Margesin (1996). The released pnitrophenol was measured photometrically at 400 nm with a spectrophotometer Helios gamma ThermoSpectronic. Urease activity was determined with the method of Kandeler and Gerber (1988), as described by Kandeler (1996). The released ammonium was measured with a spectrophotometer Helios gamma ThermoSpectronic. Nitrification potential was estimated according to Hart et al. (1994). Fifteen grams of soil were shaken on a laboratory shaker (3521 Orbit Shaker, Lab-line Instruments) for 24 h at 200 rpm. The NO− 3 content was estimated with a continuous flow analyzer (FIAcompact, MLE) after 2, 8 and 24 h of incubation at room temperature. Nitrogen mineralization rate was measured according to the method of Beck (1993), as described by Kandeler (1996) with modification of incubation temperature from 25 °C to 22 °C. The ammonium and nitrate (V) contents were measured on the continuous flow analyzer (FIAcompact, MLE). Cellulose decomposition was measured as the filter paper weight loss. The filters (standard 90 mm filters Munktell, 389) were cut into four even pieces, dried overnight at 105 °C and weighed before digging each piece into a moist soil (50% WHC) corresponding to 50 g dwt. After four weeks of incubation in darkness at 22 °C, 70% air humidity and 50% of WHC soil humidity, the remains of the filters were collected, dried at 105 °C, weighed and combusted to measure the amount of mineral contamination. 2.5. Soil bacterial cultures: R2A agar and Biolog™ eco plates Agar inoculation was performed according to Krištůfek et al. (2005) with the 0.2 ml of 10−5 dilution inoculated on five R2A agar plates. The colonies growing in the first three days were considered as representing r-strategists, and those appearing and growing in days 4–7 were taken for calculations as K-strategists following Krištůfek et al. (2005). For Biolog™ Eco plates, 0.125 ml 10−3 of the soil dilution in brine (0.9% NaCl) was pipetted to each well of the 96 well plates. Each soil was inoculated on two replicates of substrate sets (32 wells in a set). Incubation at 22 °C lasted for seven days and the absorbance was read every 12 h on μQuant spectrometer (BIO-TEK instruments). The absorbance measurements were corrected against the control well containing all ingredients but C substrate. The maximum colour development rate was noticed on the third day following inoculation, and statistical analysis was performed on absorbance readings at that time. The calculated parameters were: average well colour development (AWCD), substrate richness Rs, functional Shannon-Wiener diversity index H′, and functional evenness I′ as described in Klimek and Niklińska (2007). 2.6. Soil lipids analysis Fatty acids were designated as the total number of carbon atoms: the number of double bonds followed by the position of the double bond from the methyl end (ω) of the molecule. The prefixes i- and a- indicate terminal isobranched and anteiso-branched PLFA, respectively. 10Meindicates a methyl group at the 10th carbon atom from the carboxyl end of the molecule (i.e., mid branching), and cy- refers to cyclopropane fatty acids. Br- indicates an unknown methyl branch position; the prefixes 2OH- and 3OH- indicate 2- and 3-hydroxy fatty acids, respectively. Phospholipid fatty acid (PLFA) analysis was performed in line with
Elhottová et al. (2009). Soil samples equivalent to 5 g dwt. were used for extraction. The TSBA6 Library (MIS Sherlock System, ver. 6.0) were used for identification of the total PLFAs profiles. Because the retention time of isomers 16:1 ω7c and 16.1 ω6c is very close, one resulting peak 16:1 ω7c/16.1 ω6c is considered as belonging to one or both PLFAs. The ratio of total PLFAs to soil carbon (PLFA:C) was used as an indirect measure of carbon quality (Allison et al., 2007), while the ratio of mono-unsaturated to saturated PLFA (MUFA:STFA) was used as an indicator of C substrate availability to the microbial community (Bossio and Scow, 1998). The ratio of neutral lipids to phospholipids (NLFA:PLFA) was used as the index of storage materials content (Elhottová et al., 2009). Number of individual PLFA was used as qualitative indicator of microbial community richness (Laczkó et al., 1997). PLFAs considered as of bacterial origin were: i15:0, a15:0, 15:0, i16:0, a16:0, 16:1ω7c, i17:0, a17:0, cy17:0, 18:1 ω7c, cy 19:0, 19:1 ω8c (Bååth, 2003; Frostegård and Bååth, 1996). The branched acids a11:0, a13:0, i14:0, a14:0, a15:0, a16:0, i16:0, a17:0, i17:0, i18:0, i19:0, a19:0, i20:0 indicated on gram-positive bacteria (O'Leary and Wilkinson, 1988), and non-branched, cyclic or hydroxylated acids: 8:0 3OH, 10:0 2OH, 10:0 3OH, 12:0 2OH, 12:0 3OH, 13:0 2OH, 15:0 2OH, cy17:0, 16:0 2OH, 17:0 3OH, cy19:0 ω8c on gram-negative ones (Wilkinson, 1988; Zelles, 1999). Fatty acids methylated at the tenth C position: 10Me18:0, 10Me17:0 and 10Me16:0 marked actinomycetes (Kroppenstedt, 1985), PLFA 18:2 ω6,9c (Frostegård and Bååth, 1996; Ruess et al., 2002) and 18:1 ω9c (Zak et al., 1996) marked fungi. For arbuscular mycorrhizal fungi (AMF) both phospho- and neutral-lipid variants of 16:1 ω5c (Olsson, 1999) were used as markers. Polyunsaturated PLFA 18:3 ω6 and 20:4 ω6 were considered characteristic to protists (Erwin, 1973). 2.7. Bacteria and algae counts Total bacteria number was based on counting DAPI stained cells following the method by Bloem (1995) under the epifluorescence microscope Olympus BX60 and was done in 70–80 microscopic pools for each soil. The ratio of colony forming units (CFU) to the total number of bacteria was used to calculate culturability of soil microbial communities. For soil algae counting, soil suspensions were prepared as follows: 1:5 (w:v; g air dry soil:water volume) shaken for 2 min and 1 min centrifuged at 40 rcf. From one soil there were two soil suspensions, and from each suspension three 0.02 ml drops were placed on three microscopic glasses and covered. Autofluorescent cells were counted in ten transects on each glass/drop under the epifluorescence microscope Nikon YS-100 with G-2A (ex510–560) filter. 2.8. Arbuscular mycorrhizal fungi root colonization For the evaluation of root colonization by arbuscular mycorrhizal fungi (AMF), roots were prepared according to the Phillips and Hayman (1970) method with modifications by Zubek et al. (2011). The degree of AMF colonization was estimated according to Trouvelot et al. (1986) in five randomly picked pieces of underground parts of the plants from mixed root bulks of each fallow and meadow. The parameters evaluated were: mycorrhizal frequency (F%) and relative mycorrhizal root length (M%). Mycorrhizal frequency (F%) was calculated as the ratio between root fragments colonized by AMF mycelium and the total number of root fragments analysed. The relative mycorrhizal root length (M%) is an estimate of the amount of root cortex that is mycorrhizal relative to the whole root system. 2.9. Phylogenetic profiling Terminal Fragment Length Polymorphism (T-RFLP) was used to compare genetic profiles of fallow and meadow soil microbial communities. T-RFLP had a similar capacity as pyrosequencing to separate samples according to distance at a local scale, and to correlate
D. Chmolowska et al. / Science of the Total Environment 599–600 (2017) 981–991
985
environmental variables with microbial community structure (van Dorst et al., 2014). DNA extraction was performed using a phenol-chloroform modified protocol of Yeates et al. (1997) applied to small samples. Each DNA sample was extracted from 0.5 g of soil. The protocol was extended by adding a step of three cycles of freezing (− 70 °C, 20 min) and thawing (95 °C, 10 min) a sample in the initial extraction buffer. Ten-fold diluted DNA extracts were used in each PCR reaction. The bacterial PCR reaction mixture contained: 1× PCR buffer, 0.0375 U μl−1 DreamTaqTM DNA Polymerase (Fermentas), 0.2 mM dNTP each (Fermentas), Bovine Serum Albumin (Fermentas) 1 μg μl−1, primers 0.3 μM each. Primers were those described by Fortuna et al. (2011) of 16S rRNA bacterial genes 63F and 1392R apart from that the forward primer was fluorescently labeled with 56-FAM instead of the backward. They were manufactured by Oligo.pl. The PCR reaction started with 5 min at 95 °C, followed by 28 cycles, each consisting of 30 s at 94 °C, 40 s at 56 °C, and 1 min at 72 °C, and finished with final extension at 72 °C for 7 min. The reaction was performed in 40 μl volume in five replicates, using the Eppendorf Mastercycler. The fungal PCR reaction mixture contained: 1× PCR buffer, 0.05 U μl− 1 DreamTaq™ DNA Polymerase (Fermentas), 0.2 mM dNTP each (Fermentas), Bovine Serum Albumin (Fermentas) 0.4 μg μl−1, primers 0.2 μM each. Fungal primers were ITS-1 and ITS-4 as described by Singh et al. (2006). Forward primer was labeled VIC and was synthesized by Life Biosciences, while backward primer was supplied by Oligo.pl. The reaction started with 5 min at 95 °C, followed by 33 cycles, each consisting of 30 s at 94 °C, 30 s at 55 °C, and 50 s at 72 °C, and finished with final extension at 72 °C for 10 min. The reaction was performed on the SensQuest thermocycler in 50 μl volume in four replicates. Two hundred microliters of PCR product: five 40 μl of bacteria reactions or four 50 μl reaction volumes of fungal PCR, were pooled and cleaned with StrataPrep® PCR Purification kit (Stratagene), fungi and bacteria separately. The restriction mixture components were: reaction buffer medium 100×, BSA 10 000×, 0.3 U Msp1 (EURx) μl−1 reaction volume. PCR product was added at the ratio 4:1 restriction mixture (v:v). Reactions were incubated at 37 °C for 4 h in case of bacteria PCR products, and for 7 h in case of fungi. The reaction was stopped by heat inactivation 20 min at 65 °C. Digestion was checked on 1.5% agarose gel. Bacterial and fungal digests were pooled and cleaned with Clean-Up Concentrator kit (A&A Biotechnology). Cleaned restriction products were checked at NanoDrop™ 1000 Spectrophotometer (Thermo Fisher Scientific) and were diluted in PCR-purity grade water. Two and half microliter of the diluted cleaned restriction products were mixed with 14.5 μl deionized formamide, 0.3 μl Gene Scan 1200LIZ size standard (Thermo Fisher Scientific) and T-RFs were size separated on ABI 3130xl automated sequencer (Applied Biosystems). To optimize peaks size below 8000 fu genotyping was performed twice: for bacteria template amount was 1.7 ng μl−1 of sequencing mixture, for fungi 0.6 ng μl−1, because the latter spectra were composed of smaller number and thus stronger signal peaks.
(m5). The analyses were performed in Statgraphics Centurion XVI program. Repeated measures ANOVA was used for comparisons of nitrification potential in the fallows and meadows. To compare the growth activity on agar of fallow and meadow soil microbial cultures the repeated measures ANOVA was applied directly on the Colony Forming Units (CFU) number or on the relative CFU number (% of the final CFU number from each soil per day). Because of the lack of sphericity of the data, the lower bound correction was employed. Repeated measures ANOVA's were done in Statistica 10. PLFA data were transformed with log10(x + 1), and acids that were present in less than three soil samples and in a quantity lower than 0.015% of total PLFA biomass were removed from multivariate analysis. Remaining 64 acids out of 84 were used for Principal Component Analysis (PCA) and Redundancy Analysis (RDA), a multivariate method for non-gradient analysis (Legendre and Gallagher, 2001). PCA and RDA were carried out in Canoco 4.5. Environmental variables were standardized before RDA. The RDA options were chosen as follows: scaling by inter-samples distances, PLFAs centred by species only. Inter-sample scaling is preferred for comparing sample distances rather than relationships of descriptor vectors. With inter-samples scaling the angles between vectors are meaningless. Monte Carlo permutation test with 1000 permutations was run, as suggested for p = 0.05 (Kindt and Coe, 2005), to detect which environmental factors significantly contributed to community structure. Only significant variables were included in an RDA graph. T-RFLP profiles were analysed with Gene Marker 2.2.0 (Soft Genetics) program. T-RF sizes (rmu) were determined using a signal detection threshold of 200 fluorescence units for bacteria and 100 for fungi with 50–1200 bp size frame. Bacterial Rmu were rounded to two because of the observed shifts in a few replicated samples. Bacterial rmu were rounded manually which was done carefully with cross-validation of T-RLFP spectra. In case of fungi, rounding was performed automatically to one with a macro by dr C. Walsh (Rees et al., 2004) adapted to our data. Profiles were standardized as suggested Hartmann and Widmer (2008), that is each peak height was divided by the sum of all peak heights measured in a sample. Nonmetric Multidimensional Scaling (NMDS) with Bray-Curtis similarity measure, which are suggested for T-RFLP profiles comparisons (Rees et al., 2004), were run with obtained T-RFs in the PAST program (Hammer et al., 2001). Because not a single fungal T-RF was obtained from fallow 3, and only two bacterial ones from meadow 1, thus, these profiles were excluded from the analyses. Mantel test was run in the Past program (Hammer et al., 2001) to check if there are correlations of fatty acids and T-RF's composition with spatial distribution of the sampling sites. Euclidean similarity measure was chosen and 5000 permutations were performed in the analysis.
2.10. Statistical analyses
3.1. Soil microbial communities activity
Properties of the two studied ecosystem types were compared with t-Student test or median test. Each test was preceded with F test to examine if variances of the two groups were homogenous. If heteroscedasticity was detected (F test p b 0.05), the non-parametric median test was employed. Pearson's correlations were used to test for any relationships between variables. Soil physicochemical characteristic data, which were described in Chmolowska et al. (2016a), were used for correlation analysis with soil microbiological indices from this research. If standardized skewness or standardized kurtosis of a measured parameter did not fit within − 2–2 range, the parameter was transformed until the condition was met. This was the case for relative mycorrhizal root length (M%), which was log transformed. In case of qCO2 calculated for soil dry weight one extended point was excluded
Respiration rate per soil dry weight was higher in the meadows than in the fallows in June in all three years of the study (p = 0.01 in 2008 and 2009, p = 0.001 in 2010). A single autumn sampling in November 2008 did not show this relationship (Table B.2). Respiration rates calculated per organic matter were higher in the meadow soils in the two sampling events, in June 2008 and 2010, while in November 2008 the two ecosystem types did not differ (p N 0.1), and on June 2009 the opposite trend was seen (p = 0.06). The respiration rate strongly and positively correlated with organic matter and negatively with N-NO− 3 contents (Table 2). Metabolic quotient qCO2 when calculated for soil dry weight was lower in fallow than in meadow soil (p = 0.001, Table 1, Table B.3). In contrary, when calculated per organic matter, qCO2 was higher in fallow soil than in meadow (p = 0.03, Table 1, Table B.3).
3. Results
986
D. Chmolowska et al. / Science of the Total Environment 599–600 (2017) 981–991
Table 2 Correlations among functional traits and soil physicochemical properties, p ≤ 0.05. Soil properties are retrieved from Chmolowska et al., 2016. Correlated parameters Respiration – acid phosphatase Respiration – urease Respiration – SIR-Cmic Respiration – OM [%] Respiration – NO3 [μg g dwt−1] RespirationOM – SIR-Cmic RespirationOM – acid phosphatase RespirationOM - N [%] RespirationOM – C [%] RespirationOM – Na [mg kg dwt.−1] SIR-Cmic – acid phosphatase SIR-Cmic – urease SIR-Cmic – OM [%] BIOLOG AWCD – Mn [mg kg dwt.−1] cellulose decomposition – N mineralisation rate cellulose decomposition – C:N−1 cellulose decomposition – K2O [mg kg soil−1] cellulose decomposition – P2O5 [mg kg soil−1] −1 ] cellulose decomposition – NO− 3 [μg g dwt acid phosphatase – urease acid phosphatase – OM [%] −1 ] acid phosphatase – NO− 3 [μg g dwt alkaline phosphatase – pH [H2O] alkaline phosphatase – pH [KCl] alkaline phosphatase – Ca−1 [mg kg dwt.−1] alkaline phosphatase – CEC−1
r 0.95 0.78 0.77 0.86 −0.74 −0.68 −0.86 −0.69 −0.66 −0.68 0.74 0.74 0.78 −0.68 0.73 0.61 0.64 0.69 0.76 0.67 0.87 −0.61 0.92 0.92 −0.83 −0.79
r ≥ 0.8 in bold.
Nitrogen mineralization rate was higher, roughly two times, in the fallows than in meadows (Table 1, Table B.3). Nitrogen mineralization rate was explained by the initial soil nitrate content (regression analysis R2 = 68.5%), while ammonia content did not contribute significantly to the model: N mineralization rate = 25.54 + 2.55 NO− 3 . Consequently, nitrification potential, expressed as the quantity of NO− 3 produced, was higher in fallows than in meadows (F(1,10) = 26.49, p = 0.0004). There was no interaction between time and ecosystem type. However, the raw data showed that the meadow samples exhibited mainly exponential increase of nitrate concentration with time, while in the fallow samples a reverse trend and plummeting was often seen. Cellulose decomposed faster in the fallow soils (W = 5.0, p = 0.05). The filters lost 26–88% of their initial mass in the fallows, and 0–68% in the meadows during four weeks of incubation (Table 1, Table B.3). The microbial cultures from fallow soils grew better on agar during one week incubation (F(1,10) = 5.97, p = 0.03). The numbers of CFU at the end of incubation (Table 1) correlated moderately strongly with the total number of bacterial cells (r = 0.68, p = 0.01). There was no interaction of time with ecosystem type for the relative number of colonies or their actual numbers (repeated measures ANOVA, nonsignificant time × ecosystem interaction) and no significant difference in growth activity between days 1–3 or 4–7. Five percent of the total number of bacteria cells grew on R2A agar on average (Table 1). There was no difference between fallows and meadows in average substrate utilization pattern, activity and diversity of soil microbial culturable communities as measured on Biolog™ Eco Plates (Table B.3). No differences were found between fallows and meadows in soil enzymes activity (acid and alkaline phosphateases and urease) and SIR (Table 1, Table B.3). Spatial heterogeneity of the respiration rate was evaluated using two levels of sampling: three plots for each ecosystem type and five soil subsamples per plot. Majority of the total variance in respiration rate per gram of organic matter, 59%, was explained by differences between the two ecosystem types. However, high local soil spatial variability, 35% of the variance, was observed also within plots. The between-plot differences were responsible for only 4% of the total variance. Remaining 3% of unexplained variability was the estimation error.
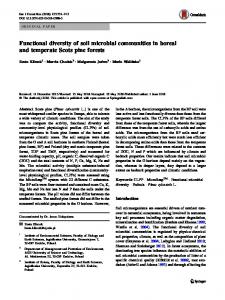
3.2. Soil microbial communities structure The average number of bacterial cells in the fallows was 11.8 ∙ 108 cells g dwt.−1, while in meadows 9.6 ∙ 108 cells g dwt.−1 (Table 1, Table B.4). The biomass of fungi, bacteria, actinomycetes and protists were also similar in both ecosystem types (fallow/meadow) as measured as PLFA concentration in soil (nM g dwt.−1, Table B.5). Considering the relative contents of particular groups in the total PLFA biomass, fungi constituted 11% of the total phospholipid biomass in both ecosystems, while bacteria 46% in the fallows and 47% in the meadows. The slightly higher contribution of bacteria in the meadows was statistically significant (Table 1, Table B.5). The calculated amount of bacterial PLFA per cell (nM g dw −1 per cell number) was higher in bacterial cells in meadows than in fallows (Table B.4). The bacteria PLFA relative content in meadows was explained by root biomass (simple linear regression, R2 = 73.33%, r = 0.86, p = 0.03). The PLFA nutrient stress indicators, such as ratios MUFA:STFA, PLFA:NLFA, and PLFA:C, did not differ between fallows and meadows (Table B.5). The PLFA fraction of 16:1 ω5c did not differ between fallows and meadows. Analysis of the neutral lipid 16:1 ω5c, which is the AMF storage fatty acid, showed its absence in most of the meadow plots and thus lower NLFA:PLFA ratio in meadows t = 2.43, p = 0.04 (Table 3). Principal component analysis (PCA) and redundancy analysis (RDA) of PLFAs and environmental variables (Fig. 1) showed samples distributed regardless of the ecosystem type. In RDA the pattern was similar to PCA but with more even distribution of the plots. Both methods pointed out on the actinomycetes marker 10Me16:0 to be the most meaningful acid in the analyses output. In PCA it explained 20.69% of total variance in the ordination graph (Table B.6). Apart from that, the fungal marker 18:2 ω6 had high fit to the model by RDA. From the environmental factors available P and C:N ratio were shown to contribute significantly to the samples distribution. The arrow indicating available P points in the same direction as the actinomycetes marker 10Me16:0 along axis 1, while the fungal marker 18:2 ω6 along axis 2 (Fig. 1). The two soil ecosystems were clearly distinguished from each other by the AMF presence. The meadow root system showed twice as high mycorrhizal frequency (F%) (p = 0.04) and relative mycorrhizal root length (M%) (p = 0.09) as in the fallows. In fallows around 29% of roots were colonized by these symbionts, and in meadows approximately 64% (Table 3). The mean length of roots colonized by AMF mycelium (M%) was 29% in the meadows and 11% in the fallows. Mycorrhization level positively correlated with relative content of the AMF phospholipid marker 16:1 ω5c (r = 0.79, p = 0.04 for both F% and M%) and did not correlate with the neutral and phosholipid 16:1 Table 3 Arbuscular mycorrhizal fungi (AMF) estimates: PLFA and NLFA AMF signature 16:1 w5c in soil; mycorrhizal frequency F(%) and relative mycorrhizal lenght M(%). AMF parameter
NLFA
PLFA
NLFA:PLFA
FA unit fallow 1 fallow 2 fallow 3 fallow 4 fallow 5 fallow 6 meadow 1 meadow 2 meadow 3 meadow 4 meadow 5 meadow 6
16:1 ω5c [nM g dwt−1] 3.16 15.85 16.83 9.23 20.98 0.00 0.00 4.05 10.90 0.00 0.00 0.00
16:1 ω5c [nM g dwt−1] 5.31 4.99 6.11 7.18 6.19 6.76 10.68 5.24 8.56 7.33 7.00 9.03
16:1 ω5c
mean fallow mean meadow test F test t
11.01 2.49 0.20 0.05
6.09 7.97 0.10 0.05
P ≤ 0.05 in bold.
F
M
0.59 3.18 2.75 1.29 3.39 0.00 0.00 0.77 1.27 0.00 0.00 0.00
[%] 22.2 20.0 11.1 40.0 72.4 7.7 55.6 27.6 57.1 55.6 93.3 96.7
[%] 2.7 9.2 3.9 24.3 24.3 2.9 16.7 6.9 20.2 21.5 57.0 50.2
1.87 0.34 0.06 0.04
28.9 64.3 0.86 0.04
11.2 28.8 0.18 0.09
D. Chmolowska et al. / Science of the Total Environment 599–600 (2017) 981–991
987
a
Fig. 1. RDA of PLFA and environmental variables in fallows and meadows, n = 12. Filled squares: fallows, open circles: meadows. Solid arrows indicate four the most meaningful PLFAs, above 83% fit to PC1 and PC2. Dashed grey arrows indicate environmental variables selected by automated forward selection and with p b 0.05 from Monte Carlo permutation test, 1000 permutations. Soil properties are retrieved from Chmolowska et al., 2016.
ω5c or their ratio NLFA:PLFA when direct quantitative measurements (nM g dwt.−1) were used. The mycorrhizal root length M% correlated negatively to NO− 3 content (r = − 0.64, p = 0.03) and available K (r = − 0.7, p = 0.01). There were no correlations with infection frequency F%. Multiple regression run separately for each ecosystem type pointed out soil pH to play a role in a gradient of soil pH in meadows: with increasing pH in meadow soils root mycorrhization frequency and length increased too (F%: R2 = 80.46%, p = 0.02, r = 0.90, F% = − 137.8 + 29.96 ∙ pH; M%: R2 = 76.20%, p = 0.02, r = 0.87, M% = −121.36 + 22.25∙pH). The comparison of soil bacterial and fungal T-RLFP profiles showed some trends. The number of bacterial dominant genotypes was 30 in the fallows and 17 in the meadows on average but the difference was barely significant at p = 0.07. The average number of dominant fungal genotypes was similar in the fallow and meadow soils: 22 and 24, respectively. Bacterial T-RF's were distributed more evenly than fungal. Fungi tended to produce just few dominant T-RF's and a bunch of small ones. Nonmetric Multidimensional Scaling (NMDS) of bacterial profiles showed the fallow soil bacterial communities concentrated in the middle, with meadows communities surrounding them. The meadow communities were more diversified among the sites (Fig. 2a). Cluster analysis pointed out three pairs of sites, meadow 4 and 2, fallow 5 and 6, and fallow 1 and 2, with dissimilarity of bacterial communities within each pair around 25%. At similarity level around 50%–55%, the analysis clustered fallow and meadow soil bacterial communities. The meadows 6 and 5 departed most clearly from the rest of soil bacterial T-RLFP profiles. In case of fungal profiles the fallows tended to locate in the left part of a NMDS graph, while the meadows split between quarters I, II and III (Fig. 2b). Fungal profiles showed higher dissimilarity than bacterial ones. The most similar were fallows 5 and 6, at 0.6 dissimilarity, which next clustered with fallow 2 at dissimilarity node 70%. These three soils showed also high similarity of bacterial communities. At lower similarity, around 0.2, fallows and meadows started to join together. Soils commonly contain 103–104 of algae cells (Metting, 1981), and the algae counts in fallows and meadows were consistent with these values. They numbered to 8.8∙104 and 13∙104 cells g dwt.−1 in fallows and meadows respectively and did not differ statistically. 4. Discussion Considering many similarities between the two ecosystem types: biotic and abiotic it is not surprising that biomass and structure of soil bacteria and fungi showed trends rather than uniformly sorted the communities according to their origin. The possible distinction can result from particular divergences between habitats. Focusing on functional groups in regards to known differences between the ecosystems
b
Fig. 2. Nonmetric Multidimensional Scaling of T-RLFP spectra of soil microbial communities in fallows and meadows: a) bacteria, b) fungi. F1-f6: fallows, m1-m6: meadows, n = 11.
might reveal the actors in a spectacle. Indeed, the two ecosystem types were discriminated by arbuscular mycorrhizal fungi (AMF) performance. Further differences in functioning pointed out more efficient C and N mineralization in fallows than in meadows, while meadow soils exhibited higher respiration rate. In accordance with published data (e.g. Blaško et al., 2015) younger ecosystem have quicker decomposition rates. This resulted from higher microbial activity, what at most depended on environmental factors. Ecosystem sums edaphic and biocenosis properties. 4.1. Soil microbial activity According to Göransson et al. (2011), C was the most important resource for microbial growth, N was the secondary limiting nutrient, followed by P. In our experiment cellulose decomposition correlated positively with the nitrate and available P and K, and the strongest was the relationship with N-NO− 3 , then with P followed by K. Lower soil available N and P contents were related to longer start-up of cellulose decomposition in the studied meadows than in fallows (Chmolowska et al., 2017). The cellulose decay was also negatively related to C:N ratio, pointing on contribution of OM quality to microbial activity. In both experiments on cellulose decomposition, which were
988
D. Chmolowska et al. / Science of the Total Environment 599–600 (2017) 981–991
performed separately in two different seasons and used different methods of cellulose decay measuring (area loss vs. mass loss) meadow 3 was characterised by very low cellulose utilization, which was resulting from its very slow start-up (Chmolowska et al., 2017). Meadow 3 had the highest in comparison to other plots: content of soil OM, total C and N, water holding capacity, cation exchange capacity as well as plant diversity and richness, all together suggesting that meadow 3 might be the oldest ecosystem with slower C and N mineralisation rates and/or microbial activity was retarded by some habitat properties (Chmolowska et al., 2017). Because cellulose decomposition correlated also with nitrogen mineralization rate, this suggests that these two processes depend to some extent on similar factors. The significantly higher nitrogen mineralization rate in fallows suggests a higher availability of soil organic matter for decomposition in fallows or higher immobilization of released inorganic N by microbiota in meadows. N immobilization ranges from 35 to 95% of released inorganic nitrogen in different soils (Bengtsson et al., 2003) and due to lower availability of inorganic N in meadow soils, microorganisms can be Nlimited and have higher needs for N assimilation than in fallows. In a laboratory study, a higher gross NO− 3 consumption was measured in a soil with low C and N content and lower microbial biomass compared to a fertile soil (Boyle et al., 2008). Gross consumption of inorganic N is related to its microbial immobilization (Burger and Jackson, 2003). In a field study, two months after nitrogen fertilization at the rate 100 kg ha−1, there was less inorganic N in soil than just before fertilization due to, as suspected, plant or microbial immobilization during vegetation growth (Ajwa et al., 1999). On the other hand, a slightly lower C:N ratio in fallow soils accompanied by a higher content of nitrate may cause organic matter to be less recalcitrant than in meadows. Younger ecosystems were reported to have more available organic matter (Göransson et al., 2011), and stable, old organic matter decomposes slower as described by Paul and Juma (1981) (McTaggart and Smith, 1993). In contrast to cellulose decomposition and nitrogen mineralization rates, basal soil respiration was higher in meadow soils than in fallow soils. Basal soil respiration can be an indicator of combined soil microbial activity and biomass, and its rate can be increased by a number of factors. The effect of habitat is supported by a positive correlation of respiration rate with OM content across the studied grasslands. Similar findings were reported in a gradient of grassland management, in which organic matter content and microbial activity measured as dehydrogenase activity increased from a fertilized managed plot towards natural grassland (Brodie et al., 2002). When respiration was calculated per unit organic matter, it was higher in meadows in two seasons and was negatively related to total C, N and Na contents (Table 2). All these differences and relations suggest that lower OM quality caused increased respiration rate. A switch of qCO2 when calculated per soil dry weight or organic matter underlined it. Decreasing qCO2, because of increasing C conserving along succession was suggested (Elhottová et al., 2002). It is also known that AMF release more stable OM compounds to the environment (Berg and McClaugherty, 2008) and AMF were more abundant in meadow plants roots than in fallows. The effect of microbial community structure on observed higher respiration rate in meadow soils can be linked to the presumption that mycorrhiza takes part in total soil respiration. It has been suggested that mycorrhizal fungi were responsible for respiration bursts following humus decomposition (Berg and McClaugherty, 2008). Contrary to the hypothesis that microbial communities of younger ecosystems are dominated by opportunistic species, microbial communities in fallows did not show higher culturability and no clear differences in relative colony forming curves (CFC) were found. Actual r −/ K-selection can also be hindered by 5% culturability of soil bacteria. The fallow inoculants exhibited a higher total number of CFU in time what can be attributed to the observed trend to higher total number of bacterial cells in fallows, supported by the correlation between total cell number and CFU number. These findings are in agreement with
the study by Brodie et al. (2002), who obtained higher numbers of colonies from agriculturally improved but less plant rich field than from a semi-natural meadow. High small-scale spatial heterogeneity of soil was reported for a number of chemical and microbial characteristics (Brockman et al., 1998; Cavigelli et al., 1995; Clegg et al., 2000; Parkin, 1987; Stoyan et al., 2000), including microbial respiration (Stoyan et al., 2000). In the surveyed fallows and meadows, the variation of soil basal respiration rate between five soil cores collected within each plot accounted for one third of the total variance among samples. Nevertheless, the difference between fallows and meadows explained the majority of the variance, showing that this functional trait is characteristic for the ecosystem type. 4.2. Structure of soil microbial communities It is well known that plant symbiosis with AMF is promoted in habitats limited by resources, especially P (Smith and Read, 2008). In addition, it is known that a high pH can inhibit the uptake of phosphate ions by plants and that this limitation can be overcome with mycorrhiza (Smith and Read, 2008). Results of this study support this mechanism because mycorrhizal frequency was higher in the ecosystem with low nitrate content and increased at meadows with higher pH in particular. After root colonization AMF proliferate into soil and produce extraradical hyphae at least 15 cm long as described by Jansa et al. (2003) (Smith and Read, 2008). Thus, one might expect higher 16:1 w5c PLFA biomass in meadow soils. However, 30–60% of PLFA can be of bacterial origin (Olsson, 1999), what may account for the lack of a significant difference in the PLFA biomass of the AMF marker between fallows and meadows in bulk soil and just positive correlation of roots mycorrhization These findings underline limitations of bulk soil analysis for symbiotic microorganisms performance. High phosphate fertilization rate decreased root colonization by AMF (Mohammad and Malkawi, 2004), while the smaller amounts stimulated it (Mohammad and Malkawi, 2004; Zubek et al., 2012). In a study by Antunes et al. (2012), N and P depletion resulted in higher numbers of AMF hyphae, with N deficiency having stronger effect. At the same time, the number of AMF spores was lower. Similar findings were found in this study: the NLFA analysis showed that most of the meadow soils contained no AMF storage neutral lipid 16:1 ω5c and consequently the ratio of NLFA:PLFA of the 16:1 ω5c was lower. In conclusion, in the studied meadows, representing grasslands depleted in NO− 3 , available P and K, a higher frequency of AMF root colonization was observed, which correlated positively with the soil relative content of the AMF PLFA and negatively with AMF NLFA biomarker. Disturbed and ruderal habitats were often found to be rich in nutrients and dominated by non-mycorrhizal plants according to Francis and Read (1995) (van der Heijden and Cornelissen, 2002). In our study, in both ecosystem types the majority of plants were mycorrhizal species (Chmolowska et al., 2016). Thus, different mycorrhization level between fallows and meadows can be attributed to the edaphic factors. AMF symbiosis is promoted in low-productive, nutrient depleted natural grasslands (Loreau et al., 2002). The suggestion that the ratio of fungi to bacteria increases along a successional gradient or with increasing sustainability of soil management, such as lower nitrogen fertilization, is often found in literature (e.g. Grayston et al., 2004; Plassart et al., 2008; Strickland and Rousk, 2010; Van der Wal et al., 2006). In our research there was no difference in F:B ratio between fallows and meadows. Similarly, Huang et al. (2011), who used the same markers, did not find any pattern in F:B ratio on grassland restoration sites aged from one to 78 years. Similarly to the studies on the prairie restorations (Allison et al., 2007; McKinley et al., 2005), we did observe significantly higher relative content of PLFA bacterial biomass in meadows. In our study this output was explained by higher PLFA content per cell in bacteria in meadows than fallows. Higher homogeneity of bacterial T-RLFP profiles in fallows than in meadows may reflect higher variability of crucial environmental
D. Chmolowska et al. / Science of the Total Environment 599–600 (2017) 981–991
properties in meadows and/or management history or strong grouping effects of the specific fallow properties on bacterial soil communities, e.g. N, P, K availability. The meadows showed higher variability in the C:N ratio, CEC and Ca content, as indicated by the F test for homogeneity of variances (Chmolowska et al., 2016). Soil pH in H2O ranged from acidic to alkaline in meadows, while the fallow pH varied from acidic to slightly acidic (SI1). Structuring force of soil pH on bacterial (Griffiths et al., 2011; Lauber et al., 2009) and fungal (Liu et al., 2014) communities was reported. In our study the two alkaline-neutral soils (m5, m6) differed the most in their soil bacterial T-RLFP profiles from other acidic or slightly acidic soils too. It was also noticeable that in general bacterial communities were more homogeneous than fungal communities. Similarly, a T-RFLP study on a transect across natural and managed grasslands showed higher dissimilarity of fungal communities between plots compared to bacterial communities (Brodie et al., 2002; Brodie et al., 2003). Appearance of fungal PLFA marker after adding environmental variables in RDA, while its absence in PCA, may suggest fungal relationship with edaphic conditions, in line with Birkhofer et al. (2012). PCA and RDA of PLFA, via the marker 10Me 16:0, pointed to actinomycetes as the main factor forming the similarity of soil microbial communities. In a study on grassland restoration in China, significant fluctuations of actinomycetes PLFA biomass with grassland age were observed. Its PLFA biomass was one of the most discriminative factors, along with AMF of soil microbial community structure (Huang et al., 2011). In conclusion despite the general structure similarity, specific functional traits of soil microbial communities were characteristic for the ecosystem types. This was perhaps caused mainly by environmental factors such as NO− 3 , P and K availability and organic matter quality. The results of this study provided the evidence for formation of functional microbial niches, which to some extent are coherent with the ecosystem type regardless of geographical distribution at a local scale. The functioning of species-rich meadow biocenosis in nutrient poor conditions may be possible due to plant-microbial symbiosis. As previously described, higher contribution of leguminous plant species in meadows than in fallows suggests N acquisition to ecosystem by N2-fixers (Chmolowska et al., 2016). Here we showed that AMF were more frequently found in plant roots in meadows, which are older grasslands and have higher plant diversity, but are NO− 3 and available P and K depleted. The higher mycorrhizal colonization can result from the promotion of symbiosis by the lack of phosphate and nitrate in meadow soils and elevated pH, which is known to suppress nutrient acquisition by plants and favour mycorrhizal symbiosis. Acknowledgements This work was supported by the Institute of Environmental Sciences, Jagiellonian University in Kraków, Poland (DS 758, 759) and by the Ministry of Science and Higher Education, Republic of Poland (PhD grant N304 005139). Institute of Botany, Jagiellonian University in Kraków, also provided partial funding (K/ZDS/005399, K/ZDS/006305). The PLFA analysis and bacteria enumeration were done in the Biology Centre AS CR, v.v.i. – Institute of Soil Biology, České Budějovice, Czech Republic: (LC06066 Centre for Environmental Microbiology, MŠMT ČR (20062010); Research Plan of Biology Centre v.v.i., Academy of Sciences of the Czech Republic – ISB (AVOZ 60660521). We would like to express special thanks to dr. M. Niklińska, Jagiellonian University in Krakow, for a kind cooperation. Sincere gratitude is owed to Klara Řeháková for introducing into soil algae and other people from the Institute of Soil Biology, České Budějovice for scientific discussions and help: M. Šimek, A. Chroňáková, J. Jirout, L. Dohnalova and more. Special thanks go to the staff of the Forest Research Station in Krynica-Zdrój, Agricultural University in Kraków, Poland, for a help with searching for the study plots, during which the first author has also learnt how to drive a car in the mountains.
989
The first author's PhD thesis included material from this work. The first author of this work planned the experiment, performed field work and most of the laboratory and statistical analyses and wrote a paper, DE guided FA analysis, VK guided total and culturable bacteria enumeration, MK determined plots choice and described their floristic properties, FK wrote a macro for t-RFLP, SZ performed root analysis for mycorrhizal colonization. Appendix A. Supplementary data Supplementary data associated with this article can be found in the online version, at http://dx.doi.org/10.1016/j.scitotenv.2017.04.220. These data include the Google map of the most important areas described in this article.
References Ajwa, H.A., Dell, C.J., Rice, C.W., 1999. Changes in enzyme activities and microbial biomass of tallgrass prairie soil as related to burning and nitrogen fertilization. Soil Biol. Biochem. 31, 769–777. Allison, V.J., Yermakov, Z., Miller, R.M., Jastrow, J.D., Matamala, R., 2007. Using landscape and depth gradients to decouple the impact of correlated environmental variables on soil microbial community composition. Soil Biol. Biochem. 39, 505–516. Anderson, J.P.E., Domsch, K.H., 1978. A physiological method for measurement of microbial biomass in soils. Soil Biol. Biochem. 10, 215–221. Antunes, P.M., Lehmann, A., Hart, M.M., Baumecker, M., Rillig, M.C., 2012. Long-term effects of soil nutrient deficiency on arbuscular mycorrhizal communities. Funct. Ecol. 26, 532–540. Bååth, E., 2003. The use of neutral lipid fatty acids to indicate the physiological conditions of soil fungi. Microb. Ecol. 45, 373–383. Beck, T., 1993. Die N-Mineralisation von Böden im Laborbrutversuch. Z. Pflanzenernähr. Bodenkd. 146, 243–252. Bengtsson, G., Bengtson, P., Mansson, K.F., 2003. Gross nitrogen mineralization-, immobilization-, and nitrificatio rates as a function of soil C/N ratio and microbial activity. Soil Biol. Biochem. 35, 143–154. Berg, B., McClaugherty, C.A., 2008. Plant Litter. Decomposition, Humus Formation, Carbon Sequestration. Springer-Verlag, Berlin, Heidelberg. Berner, D., Marhan, S., Keil, D., Poll, C., Schützenmeister, A., Piepho, H.P., Kandeler, E., 2011. Land-use intensity modifies spatial distribution and function of soil microorganisms in grasslands. Pedobiologia 54, 341–351. Birkhofer, K., Schőning, I., Alt, F., Herold, N., Klarner, B., Maraun, M., et al., 2012. General relationships between abiotic soil properties and soil biota across spatial scales and different land-use types. PLoS ONE 7 (8), e43292. Blaško, R., Holm Bach, L., Yarwood, S.A., Trumbore, S.E., Högberg, P., Högberg, M.N., 2015. Shifts in soil microbial community structure, nitrogen cycling and the concomitant declining N availability in ageing primary boreal forest ecosystems. Soil Biol. Biochem. 91, 200–211. Bloem, J., 1995. Fluorescent staining of microbes for total direct counts. In: Akkerman, A.D.L., van Elsas, J.D., de Bruijn, F.J. (Eds.), Molecular Microbial Ecology Manual. 4.1.8. Kluwer, Dordrecht. Boston, London, pp. 1–12. Bohannon, J., 2008. Confusing kinships. Science 320, 1031–1033. Bossio, D.A., Scow, K.M., 1998. Impact of carbon and flooding on soil microbial communities: phospholipid fatty acid profiles and substrate utilization patterns. Microb. Ecol. 35, 265–278. Boyle, S.A., Yarwood, R.R., Bottomley, P.J., Myrold, D.D., 2008. Bacterial and fungal contributions to soil nitrogen cycling under Douglas fir and red alder at two sites in Oregon. Soil Biol. Biochem. 40, 443–451. Brockman, F., Li, S., Fredrickson, J., Ringelberg, D., Kieft, T., Spadoni, C., White, D., McKinley, J., 1998. Post-sampling changes in microbial community composition and activity in a subsurface Paleosol. Microb. Ecol. 36, 152–164. Brodie, E., Edwards, S., Clipson, N., 2002. Bacterial community dynamics across a floristic gradient in a temperate upland grassland ecosystem. Microb. Ecol. 44, 260–270. Brodie, E., Edwards, S., Clipson, N., 2003. Soil fungal community structure in a temperate upland grassland soil. FEMS Microbiol. Ecol. 45, 105–114. Burger, M., Jackson, L.E., 2003. Microbial immobilization of ammonium and nitrate in relation to ammonification and nitrification rates in organic and conventional cropping systems. Soil Biol. Biochem. 35, 29–36. Cavigelli, M.A., Robertson, G.P., Klug, M.J., 1995. Fatty-acid methyl-Ester (FAME) profiles as measures of soil microbial community structure. Plant Soil 170, 99–113. Chmolowska, D., Kozak, M., Laskowski, R., 2016. Soil physicochemical properties and floristic composition of two ecosystems differing in plant diversity: fallows and meadows. Plant Soil 402, 317–329. Chmolowska, D., Hamda, N., Laskowski, R., 2017. Cellulose decomposed faster in fallow soil than in meadow soil due to a shorter lag time. J. Soils Sediments 17, 299–305. Clegg, C.D., Ritz, K., Griffiths, B.S., 2000. %G+C profiling and cross hybridisation of microbial DNA reveals great variation in below-ground community structure in UK upland grasslands. Appl. Soil Ecol. 14, 125–134. van Dorst, J., Bissett, A., Palmer, A.S., Brown, M., Snape, I., Stark, J.S., et al., 2014. Community fingerprinting in a sequencing world. FEMS Microbiol. Ecol. 89, 316–330. Eivazi, F., Tabatabai, M.A., 1977. Phosphatases in soils. Soil Biol. Biochem. 9 (3), 167–172.
990
D. Chmolowska et al. / Science of the Total Environment 599–600 (2017) 981–991
Elhottová, D., Szili-Kovács, T., Tříska, J., 2002. Soil microbial community of abandoned sand fields. Folia Microbiol. 47 (4), 435–440. Elhottová, D., Krištůfek, V., Malý, S., Frouz, J., 2009. Rhizosphere effect of colonizer plant species on the development of soil microbial community during primary succession on postmining sites. Commun. Soil Sci. Plant Anal. 40, 758–770. Erwin, J.A., 1973. Fatty acids in eukarytic microorganism. In: Erwin, J.A. (Ed.), Lipids and Biomembranes of Eukaryotic Microorganisms. Academic Press, New York, pp. 41–143. Fortuna, A.-M., Marsh, T.L., Honeycutt, C.W., Halteman, W.A., 2011. Use of primer selection and restriction enzymes to assess bacterial community diversity in an agricultural soil used for potato production via terminal restriction fragment length polymorphism. Appl. Microbiol. Biotechnol. 91, 1193–1202. Francis, R., Read, D.J., 1995. Mutualism and antagonism in the mycorrhizal symbiosis, with special reference to impact on plant community structure. Can. J. Bot. 73, 1301–1309. Frostegård, Å., Bååth, E., 1996. The use of phospholipid fatty acid analysis to estimate bacterial and fungal biomass in soil. Biol. Fertil. Soils 22, 59–65. Göransson, H., Venterink, H.O., Bååth, E., 2011. Soil bacterial growth and nutrient limitation along a chronosequence from a glacier forefield. Soil Biol. Biochem. 43, 1333–1340. Grayston, S.J., Campbell, C.D., Bardgett, R.D., Mawdsley, J.L., Clegg, C.D., Ritz, K., Griffiths, B.S., Rodwell, J.S., Edwards, S.J., Davies, W.J., Elston, D.J., Millard, P., 2004. Assessing shifts in microbial community structure across a range of grasslands of differing management intensity using CLPP, PLFA and community DNA techniques. Appl. Soil Ecol. 25, 63–84. Green, J.L., Bohannan, B.J.M., Whitaker, R.J., 2008. Microbial biogeography: from taxonomy to traits. Science 320, 1039–1043. Griffiths, R.I., Thomson, B.C., James, P., Bell, T., Bailey, M., Whiteley, A.S., 2011. The bacterial biogeography of British soils. Environ. Microbiol. 13 (6), 1642–1654. Hammer, O., Harper, D.A.T., Ryan, P.D., 2001. PAST: Paleontoligical statistics software package for education and data analysis. Paleontol. Electron. 4, 1. Hart, S.C., Stark, J.M., Davidson, E.A., Firestone, M.K., 1994. Nitrogen mineralization, immobilization, and nitrification. In: Angle, Weaver R.W., J.S., Bottomley P.D. (Eds.), Methods of Soil Analysis, Part 2, Microbiological and Biochemical Properties. Soil Sci. Soc. Am., Madison, WI, pp. 985–1018. Hartmann, M., Widmer, F., 2008. Reliability for detecting composition and changes of microbial communities by T-RFLP genetic profiling. FEMS Microbiol. Ecol. 63, 249–260. van der Heijden, M.G.A., Cornelissen, J.H.C., 2002. The critical role of plant–microbe interactions on biodiversity and ecosystem functioning: arbuscular mycorrhizal associations as an example. In: Loreau, M., Naeem, S., Inchausti, P. (Eds.), Biodiversity and Ecosystem Functioning. Oxford University Press, New York, pp. 181–192. Huang, Y., Michel, K., An, S., Zechmeister-Boltenstern, S., 2011. Changes in microbial-community structure with depth and time in a chronosequence of restored grassland soils on the loess plateau in northwest China. J. Plant Nutr. Soil Sci. 174, 765–774. Jansa, J., Mozafar, A., Frossard, E., 2003. Long-distance transport of P and Zn through the hyphae of an arbuscular mycorrhizal fungus in symbiosis with maize. Agronomie 23, 481–488. Kageyama, S.A., Posavatz, N.R., Waterstripe, K.E., Jones, S.J., Bottomley, P.J., Cromack, K., et al., 2008. Fungal and bacterial communities across meadow–forest ecotones in the western cascades of Oregon. Can. J. For. Res. 38, 1053–1060. Kandeler, E., 1996. N mineralization under aerobic conditions, pp. 139–140. Ureaze activity by Colorymetric technique, pp. 171–174. In: Schinner, F., Öhlinger, R., Kandeler, E., Margesin, R. (Eds.), Methods in Soil Biology. Springer – Verlag, Berlin, Heidelberg. Kandeler, E., Gerber, H., 1988. Short-term assay of soil urease activity using colorimetric determination of ammonium. Biol. Fert. Soils 6, 68–72. Keenleyside, C., Tucker, G., 2010. Farmland abandonment in the EU: an assessment of trends and prospects. 93. WWF and IEEP, London (November). Kindt, R., Coe, R., 2005. Tree diversity analysis. A manual and software for common statistical methods for ecological and biodiversity studies. World Agroforestry Centre, Nairobi, Kenya. Klimek, B., Niklińska, M., 2007. Zinc and copper toxicity to soil bacteria and fungi from zinc polluted and unpolluted soils: a comparative study with different types of biolog plates. Bull. Environ. Contam. Toxicol. 78, 102–107. Krause, S., Le Roux, X., Niklaus, P.A., van Bodegom, P.M., Lennon, J.T., Bertilsson, S., et al., 2014. Trait-based approaches for understanding microbial biodiversity and ecosystem functioning. Front. Microbiol. 5, 1–10. Krištůfek, V.K., Elhottová, D., Chronáková, A., Dostálková, I., Picek, T., Kalcík, J., 2005. Growth strategy of heterotrophic bacterial population along successional sequence on spoil of Brown coal colliery substrate. Folia Microbiol. 50, 427–435. Kroppenstedt, R.M., 1985. Fatty acid and menaquinone analysis of actinomycetes and related organisms. In: Goodfellow, M., Minnikin, D.E. (Eds.), Chemical Methods In Bacterial Systematics. Academic Press, London, pp. 173–199. Laczkó, E., Rudaz, A., Aragno, M., 1997. Diversity of anthropogenically influenced or disturbed soil microbial communities, pp. 57–67. In: Insam, H., Rangger, A. (Eds.), Microbial Communities Functional versus Structural Approaches. Springer-Verlag, Berlin. Lauber, C.L., Hamady, M., Knight, R., Fierer, N., 2009. Pyrosequencing-based assessment of soil pH as a predictor of soil bacterial community structure at the continental scale. Appl. Environ. Microbiol. 75, 5111–5120. Legendre, P., Gallagher, E.D., 2001. Ecologically meaningful transformations for ordination of species data. Oecologia 129, 271–280. Liu, J., Sui, Y., Yu, Z., Shi, Y., Chu, H., Jin, J., et al., 2014. High throughput sequencing analysis of biogeographical distribution of bacterial communities in the black soils of northeast China. Soil Biol. Biochem. 70, 113–122. Loreau, M., Naeem, S., Inchausti, P. (Eds.), 2002. Biodiversity and Ecosystem Functioning Synthesis and Perspectives. Oxford University Press. Margesin, R., 1996. Acid and alkaline phosphomonoesterase activity with the substrate pnitrophenyl phosphate. In: Schinner, F., Öhlinger, R., Kandeler, E., Margesin, R. (Eds.), Methods in Soil Biology. Springer – Verlag, Berlin Heidelberg, pp. 213–217.
Martiny, J.B.H., Bohannan, B.J.M., Brown, J.H., Colwell, R.K., Fuhrman, J.A., Green, J.L., Horner-Devine, M.C., Kane, M., Krumins, J.A., Kuske, C.R., Morin, P.J., Naeem, S., Ovreås, L., Reysenbach, A.-L., Smith, V.H., Staley, J.T., 2006. Microbial biogeography: putting microorganisms on the map. Nat. Rev. Microbiol. 4, 102–112. McKinley, V.L., Peacock, A.D., White, D.C., 2005. Microbial community PLFA and PHB responses to ecosystem restoration in tallgrass prairie soils. Soil Biol. Biochem. 37, 1946–1958. McTaggart, I.P., Smith, K.A., 1993. Estimation of potentially mineralisable nitrogen in soil by KCl extraction - II. Comparison with soil N uptake in the field. Plant Soil 157, 175–184. Metting, B., 1981. The systematics and ecology of soil algae. Bot. Rev. 47, 195–312. Mi, L., Wang, G., Jin, J., Sui, Y., Liu, J., Liu, X., 2012. Comparison of microbial community structures in four black soils along a climatic gradient in northeast China. Can. J. Soil Sci. 92, 543–549. Mitchell, R.J., Hester, A.J., Campbell, C.D., Chapman, S.J., Cameron, C.M., Hewison, R.L., Potts, J.M., 2010. Is vegetation composition or soil chemistry the best predictor of the soil microbial community? Plant Soil 333, 417–430. Mohammad, M.J., Malkawi, H.I., 2004. Root, shoot and nutrient acquisition responses of mycorrhizal and nonmycorrhizal wheat to phosphorus application to highly calcareous soils. Asian J. Plant Sci. 3, 363–369. Nacke, H., Thurmer, A., Wollherr, A., Will, C., Hodac, L., Herold, N., et al., 2011. Pyrosequencing-based assessment of bacterial community structure along different management types in German forest and grassland soils. PLoS One 6 (2), 17000. Niklińska, M., Chodak, M., Laskowski, R., 2005. Characterization of the forest humus microbial community in a heavy metal polluted area. Soil Biol. Biochem. 37, 2185–2194. O'Leary, W.M., Wilkinson, S.G., 1988. In: Ratledge, C., Wilkinson, S.G. (Eds.), Microbial Lipids. Academic Press, London, pp. 17–20. Olsson, P.A., 1999. Signature fatty acids provide tools for determination of the distribution and interactions of mycorrhizal fungi in soil. FEMS Microbiol. Ecol. 29, 303–310. Parkin, T.B., 1987. Soil microsites as a source of denitrification variability. Soil Sci. Soc. Am. J. 51, 1194–1199. Paul, E.A., Juma, N.G., 1981. Mineralisation and immobilisation of soil nitrogen by microorganisms. In: Clark, F.E., Roswall, T. (Eds.), Terrestrial Nitrogen Cycles. Processes, Ecosystems Strategies and Management Impacts. Ecology Bulletin, Stockholm, pp. 179–204. Phillips, J., Hayman, D.S., 1970. Improved procedures for clearing roots and staining parasitic and vesicular-arbuscular mycorrhizal fungi for rapid assessment of infection. Trans. Br. Mycol. Soc. 55, 158–161. Plassart, P., Akpa Vinceslas, M., Gangneux, C., Mercier, A., Barray, S., Laval, K., 2008. Molecular and functional responses of soil microbial communities under grassland restoration. Agric. Ecosyst. Environ. 127, 286–293. Rees, G.N., Baldwin, D.S., Watson, G.O., Perryman, S., 2004. Ordination and significance testing of microbial community composition derived from terminal restriction fragment length polymorphisms: application of multivariate statistics. Antonie Van Leeuwenhoek 86, 339–347. Renwick, A., Jansson, T., Verburg, P.H., Revoredo-Giha, C., Britz, W., Gocht, A., et al., 2013. Policy reform and agricultural land abandonment in the EU. Land Use Policy 30 (1), 446–457. Ruess, L., Häggblom, M.M., Garcı́a Zapata, E.J., Dighton, J., 2002. Fatty acids of fungi and nematodes—possible biomarkers in the soil food chain? Soil Biol. Biochemist 34, 745–756. Singh, B.K., Nazaries, L., Munro, S., Anderson, I.C., Campbell, C.D., 2006. Use of multiplex terminal restriction fragment length polymorphism for rapid and simultaneous analysis of different components of the soil microbial community. Appl. Environ. Microbiol. 72, 7278–7285. Smith, S.E., Read, D.J., 2008. Mycorrhizal Symbiosis. third ed. Academic Press, Elsevier. Steenwerth, K.L., Jackson, L.E., Calderón, F.J., Stromberg, M.R., Scow, K.M., 2003. Soil microbial community composition and land use history in cultivated and grassland ecosystems of coastal California. Soil Biol. Biochem. 35, 489–500. Stoyan, H., De-Polli, H., Böhm, S., Robertson, G.P., Paul, E.A., 2000. Spatial heterogeneity of soil respiration and related properties at the plant scale. Plant Soil 222, 203–214. Strickland, M.S., Rousk, J., 2010. Considering fungal:bacterial dominance in soils methods, controls, and ecosystem implications. Soil Biol. Biochem. 42, 1385–1395. Tabatabai, M.A., Bremner, J.M., 1969. Use of p-nitrophenylphosphate for assay of soil phosphatase activity. Soil Biol. Biochem. 1, 301–307. Tedersoo, L., Bahram, M., Polme, S., Koljalg, U., Yorou, S., Wardle, D.A., et al., 2014. Disentangling global soil fungal diversity. Science 346, 1052–1053. Trouvelot, A., Kough, J.L., Gianinazzi-Pearson, V., 1986. Mesure du taux de mycorhization VA d'un systeme radiculaire. Recherche de methodes d'estimation ayant une signification fonctionnelle. In: Gianinazzi-Pearson, V., Gianinazzi, S. (Eds.), Physiological and genetical aspects of mycorrhizae. INRA, Paris, pp. 217–221. van der Wal, A., van Veen, J.A., Smant, W., Boschker, H.T.S., Bloem, J., Kardol, P., van der Putten, W.H., de Boer, W., 2006. Fungal biomass development in a chronosequence of land abandonment. Soil Biol. Biochem. 38, 51–60. Wallenius, K., Rita, H., Mikkonena, A., Lappi, K., Lindström, K., Hartikainen, H., et al., 2011. Effects of land use on the level, variation and spatial structure of soil enzyme activities and bacterial communities. Soil Biol. Biochem. 43, 1464–1473. Wilkinson, S.G., 1988. Gram-negative bacteria. In: Ratledge, C., Wilkinson, S.G. (Eds.), Microbial Lipids. Academic Press, London, pp. 299–488. Yeates, C., Gillings, M.R., Davison, A.D., Altavilla, N., Veal, D.A., 1997. PCR amplification of crude microbial DNA extracted from soil. Lett. Appl. Microbiol. 25, 303–307.
D. Chmolowska et al. / Science of the Total Environment 599–600 (2017) 981–991 Zak, D.R., Ringelberg, D.B., Pregitzer, K.S., Randlett, D.L., David, C., Curtis, P.S., 1996. Soil microbial communities beneath Populus grandinentata grown under elevated atmospheric C02. Ecol. Appl. 6, 257–262. Zarzycki, J., Kopeć, M., Bedla, D., 2011. Ocena zróżnicowania siedlisk użytków zielonych Pasma Radziejowej (Beskid Sądecki) metodą fitoindykacyjną (in Polish). Fragm Agron 28, 115–123. Zelles, L., 1999. Identification of single cultured micro-organisms based on their wholecommunity fatty acid profiles, using an extended extraction procedure. Chemosphere 39, 665–682.
991
Zinger, L., Lejon, D.P.H., Baptist, F., Bouasria, A., Aubert, S., Geremia, R.A., et al., 2011. Contrasting diversity patterns of crenarchaeal, bacterial and fungal soil communities in an alpine landscape. PLoS One 6, e19950. Zubek, S., Błaszkowski, J., Mleczko, P., 2011. Arbuscular mycorrhizal and dark septate endophyte associations of medicinal plants. Acta Soc. Bot. Pol. 80, 285–292. Zubek, S., Stefanowicz, A.M., Błaszkowski, J., Niklińska, M., Seidler-Łożykowska, K., 2012. Arbuscular mycorrhizal fungi and soil microbial communities under contrasting fertilization of three medicinal plants. Appl. Soil Ecol. 59, 106–115.