Edited by Arthur B. Pardee, DanaâFarber Cancer Institute, Boston, MA, and ...... Kruglyak, L., Daly, M. J., Reeve-Daly, M. P. & Lander, E. S. (1996) Am. J. Hum.
Further genetic evidence for a panic disorder syndrome mapping to chromosome 13q Steven P. Hamilton*†, Abby J. Fyer*, Martina Durner‡, Gary A. Heiman§, Ada Baisre de Leon*, Susan E. Hodge*‡, James A. Knowles*¶, and Myrna M. Weissman*§储 *Department of Psychiatry, College of Physicians and Surgeons at Columbia University and the New York State Psychiatric Institute, 1051 Riverside Drive, New York, NY 10032; ¶Columbia Genome Center, College of Physicians and Surgeons at Columbia University, 1051 Riverside Drive, New York, NY 10032; and ‡Division of Statistical Genetics, Department of Biostatistics, and §Department of Epidemiology, Mailman School of Public Health, Columbia University, 1051 Riverside Drive, New York, NY 10032 Edited by Arthur B. Pardee, Dana–Farber Cancer Institute, Boston, MA, and approved December 9, 2002 (received for review September 18, 2002)
Substantial evidence supports that there is a genetic component to panic disorder (PD). Until recently, attempts at localizing genes for PD by using standard phenotypic data have not proven successful. Previous work suggests that a potential subtype of PD called the panic syndrome exists, and it is characterized by a number of medical conditions, most notably bladder兾renal disorders. In the current study, a genome scan with 384 microsatellite markers was performed on 587 individuals in 60 multiplex pedigrees segregating PD and bladder兾kidney conditions. Using both single-locus and multipoint analytic methods, we found significant linkage on chromosome 22 (maximum heterogeneity logarithm of odds score ⴝ 4.11 at D22S445) and on chromosome 13q (heterogeneity logarithm of odds score ⴝ 3.57 at D13S793) under a dominantgenetic model and a broad phenotypic definition. Multipoint analyses did not support the observation on chromosome 22. The chromosome 13 findings were corroborated by multipoint findings, and extend our previous findings from 19 of the 60 families. Several other regions showed elevated scores by using when one analytic method was used, but not the other. These results suggest that there are genes on chromosome 13q, and possibly on chromosome 22 as well, that influence the susceptibility toward a pleiotropic syndrome that includes PD, bladder problems, severe headaches, mitral valve prolapse, and thyroid conditions.
A
mong human psychiatric disorders, panic disorder (PD) is unusual for its combination of physiological and psychological symptoms. Whereas somatoform disorders are characterized by the former, and mood兾psychotic disorders by the latter, it is only in PD that bodily sensations and emotional reactions are so critically intertwined. A formal diagnosis of PD requires having recurrent panic attacks, which are brief episodes of intense fear that are accompanied by a number of physical symptoms, including palpitations, sweating, sensations of shortness of breath or smothering, the feeling of choking, chest pain, paresthesias, and nausea, among others. These attacks must be accompanied by anticipatory anxiety, the fear that one will have additional attacks. The worldwide lifetime prevalence of PD is ⬇1–3% (1), and numerous family studies suggest a relative risk of ⬇8 for PD in first-degree relatives of PD probands when compared with the relatives of controls (2). Twin studies provide evidence for a heritability estimate as high as 0.48 (3). The past several years have seen efforts to identify the genetic factors contributing to PD. Three genome scans, a focused genome screen, and a number of candidate-gene studies of PD have been completed by us and others. Our first-stage genome scan of 23 pedigrees revealed six markers that gave logarithm of odds (LOD) scores of ⬎1.0, but none with scores of ⬎2.0 (4). Also, using 23 families, Crowe et al. (5) reported, in a second genome scan, a maximum LOD score of 2.23 on chromosome 7p15. This location was just 10 centimorgans (cM) from the location of our maximal LOD score of 2.45 in our second-stage genome scan (J.A.K., A.J.F., S.E.H., and M.M.W., unpublished observations). A third group published a genome scan in which the authors also used agoraphobia as a phenotype (6). The maximal LOD score
2550 –2555 兩 PNAS 兩 March 4, 2003 兩 vol. 100 兩 no. 5
obtained in this study for PD was 2.04 on chromosome 1q, near a position found to have a LOD score of 1.2 in the scan of Crowe et al. (5). A second score of 2.01 was seen at the CCKBR locus on 11p. When agoraphobia was used as a phenotype, positive scores were found at loci different from those found for PD. A fourth group expanded on the phenotype, incorporating PD, chronic anxiety, and childhood-onset anxiety disorders into their linkage analyses (7). Using a single large pedigree, Smoller et al. (7) performed a focused-genome scan of 11 chromosomal regions on nine chromosomes, chosen by homology to mouse regions identified as quantitative trait loci for anxiety behaviors. Ninety-nine markers were genotyped and a maximum LOD score of 2.38 was found on 10q. Clinicians have long noticed the disproportionate cooccurrence of PD and medical conditions. A substantial literature supports the existence of comorbidity between PD and neurological, gastrointestinal, cardiac, and respiratory conditions (8). In the Epidemiological Catchment Area study (9), a large epidemiological study of five sites in the U.S., PD was found to be associated with medical conditions such as cardiovascular disease. Other community or clinical studies have found association between PD and mitral valve prolapse (MVP), headaches, and thyroid conditions (10–13). These data provided population-based evidence for clinical findings, although the degree of overlap between all of these conditions has not been reported, and family history of these symptoms is entirely unknown. More recently, a previously described association between PD and joint laxity (14, 15) has been characterized at the genetic level in seven Spanish pedigrees (16). The Spanish group discovered a large interstitial duplication on chromosome 15q segregating within their pedigrees. Performing linkage analysis by using a broad phenotype of joint laxity, PD, agoraphobia, social phobia, and simple phobia, Gratacos et al. (16) observed LOD scores of 4.94. A follow-up case-control association study using PD as the phenotype found this duplication in 97% of probands and in only 7% of controls. The authors suggest that rather than a pleiotropic effect of a single gene, the co-occurrence of psychiatric and medical conditions was likely explained by independent gene dosage effects of multiple genes within the duplicated segment. However, these findings have not yet been replicated. Using a different approach, we have previously reported a panic disorder syndrome, consisting of PD, bladder兾kidney conditions, thyroid problems, migraines and other serious This paper was submitted directly (Track II) to the PNAS office. Abbreviations: PD, panic disorder; MVP, mitral valve prolapse; cM, centimorgans; LOD, logarithm of odds; HLOD, heterogeneity LOD; NPL, nonparametric linkage; CIDR, Center for Inherited Disease Research. †Present address: Department of Psychiatry and Program in Human Genetics, University of
California, 401 Parnassus Avenue, P.O. Box NGL, San Francisco, CA 94143-0984. 储To
whom correspondence should be addressed at: Unit 24, New York State Psychiatric Institute, 1051 Riverside Drive, New York, NY 10032. E-mail: weissman@childpsych. columbia.edu.
www.pnas.org兾cgi兾doi兾10.1073兾pnas.0335669100
Materials and Methods Clinical Ascertainment and Assessment. A detailed description of the methodology involved in the collection of PD pedigrees is provided in ref. 19, and will only be summarized here. Our protocol was approved by the institutional review board of the New York State Psychiatric Institute, and informed consent was obtained from all interviewed subjects. Families collected from diverse sources and those containing at least three affected relatives on the initial screen were subjected to a modification of the Lifetime Version of the Schedule for Affective Disorders and Schizophrenia (SADS-LA; ref. 20) by trained interviewers. Family history was assessed with the Family Informant Schedule and Criteria (FISC), which is a modification (21) of the Family History-Research Diagnostic Criteria (FHRDC; ref. 22), to include coverage of all major axis I diagnoses listed in the Diagnostic and Statistical Manual of Mental Disorders, Third Edition, revised (DSM III-R; ref. 23). Using the FISC, the interviewer asked each subject to provide information on their first-degree relatives. The interviewer prepared a detailed narrative summary for each relative who had panic symptoms. Finally, a thorough checklist of medical conditions, including age of onset, was completed, and if possible, the relevant medical records were obtained. These data provided provisional diagnoses for a best estimate procedure performed by three senior clinical investigators (A.J.F., M.M.W., and Donald F. Klein) blinded to any identifying data. As described by Fyer and Weissman (19), each family was assessed, and all diagnostic information on each family member was compiled and blinded to name and family. At least two senior clinical investigators independently reviewed the case material and diagnosed each individual as to level of affectedness for PD and age of onset. If Hamilton et al.
these investigators agreed, then the diagnosis stood as final. Cases where there any disagreement (e.g., level of certainty of PD, or different ages of onset) were reviewed at a meeting with the diagnosticians present. Additional information was collected if necessary and a consensus diagnosis was reached through rereview and discussion. The independent review by several individuals was used to protect against oversight and interpretive bias. The consensus procedures ensured standardization. Individuals were diagnosed for PD in one of six categories: definitely affected, probably affected, possibly affected, any panic, unaffected, and unknown (17). Panic diagnosis was further refined as broad, intermediate, or narrow, depending on the best estimate criteria, e.g., broad ⫽ definite ⫹ probable ⫹ possible ⫹ any panic (24). In this study, the broad diagnosis was used for determining PD status. The procedures for identifying syndrome cases and families are described in detail in Weissman et al. (17). DNA Analysis. By using standard procedures (25), DNA was isolated from peripheral blood leukocytes or lymphoblastoid cell lines. Genotyping was performed at the Center for Inherited Disease Research (CIDR; The Johns Hopkins University, Baltimore) on ABI 377 sequencers (Applied Biosystems). In general, 40 ng of genomic DNA was amplified in multiplex reactions comprising two or three loci on ABI 9700 thermocyclers (Applied Biosystems), using standard or touchdown conditions. Typically, eight PCRs were pooled with a Hydra 384 (Robbins Scientific, Sunnyvale, CA) microdispenser liquid handler. Electropherograms were analyzed using ABI Prism GENESCAN and GENOTYPER software (Applied Biosystems). The markers comprised 384 microsatellite repeats, at an average spacing of 9 cM, with no gaps ⬎20 cM (www.cidr.jhmi.edu兾download兾 CIDRmarkers.txt). Classification of Families and Individuals. Two models for individual
affectedness status were used for the results reported here. The first, PD兾bladder, scored a person as affected if she or he had panic or a bladder condition. The second, PD兾syndrome, classified an individual as affected if that person had panic or any component of the syndrome (bladder, MVP, serious headache, or thyroid).
Data Analysis. The parameter selection for the LOD score anal-
ysis was originally guided by the results from our previous segregation analysis (26). However, subsequent work showed that the actual parameters used in a linkage analysis are not critical for detecting linkage; what matters is to analyze according to at least one dominant and one recessive model (27–29). We used a disease allele frequency of 0.01 for the dominant model, and 0.2 for the recessive model. In both dominance models, the phenocopy rate was set to 0.01 and the penetrance to 0.5. Single-locus linkage analyses using the Elston–Stewart algorithm were performed with LIPED (30). LOD scores under models of homogeneity and heterogeneity were obtained. Thus, eight single-locus LOD scores were obtained at each locus (two genetic models ⫻ two phenotypic classifications ⫻ two disease partition models). To extract linkage information from several loci simultaneously, multipoint analyses were performed with GENEHUNTER 2.0 (31). Parametric multipoint analyses were carried out with the same parameters described above, which also allowed for heterogeneity. The NPLall statistic, hereafter referred to as nonparametric linkage (NPL), a measure of identityby-descent sharing of alleles among affected family members, was also calculated. With the proliferation in the number of linkage statistics used by geneticists, it has become more difficult to compare results across studies using different methodologies. It has been proposed that interpretation of linkage results will be rendered more uniform by the complete reporting in each study of the significance threshold being used, LOD scores, and the PNAS 兩 March 4, 2003 兩 vol. 100 兩 no. 5 兩 2551
GENETICS
headaches, and MVP (17). This construct was developed after the clinicians, who were blind to family relationship and marker data, noticed a substantial number of individuals with unusual medical conditions. When the familial relationships between these individuals were subsequently examined, we observed that the medical conditions were distributed in a nonrandom fashion. Families were then dichotomized into syndrome (those with at least one individual with a bladder兾 kidney condition) or nonsyndrome (those with no individuals with a bladder兾kidney condition), and we tested the hypothesis that the syndrome families are genetically distinct from the nonsyndrome families. The predivided-sample test (18), performed on the reclassified families (19 with the syndrome and 15 without), revealed a significant difference between the two groups. Among the families with the syndrome, marker D13S779 on chromosome 13q yielded a maximum LOD score of 3.6 when we considered panic as affected, or a score of 4.2 when we considered individuals with one or more of the above diagnoses as affected. The 15 nonsyndrome families provided negative LOD scores at the same locus. The bladder component of the syndrome appears to be the same (or similar) disease as the urological disorder interstitial cystitis (diagnosed by cystoscopy and urodynamics). As a test of this observation we have recently completed a case control study of patients with interstitial cystitis, ascertained from urology practices and clinics, and found an elevated rate of PD. Moreover, and remarkably, family members of these interstitial cystitis probands (both with and without PD) had elevated rates of the syndrome when compared with controls ascertained from the same sources (M.M.W., R. Gross, A.J.F., G.A.H., M. J. Gameroff, S.E.H., D. Kaufman, and S. A. Kaplan, unpublished results). In the work presented here, we have identified an additional 41 families with members having the syndrome, and we now present data from a genomic screen of a total of 60 multiplex pedigrees, which further supports the existence of a genetically mediated panic兾bladder syndrome.
Table 1. Single-locus HLOD scores PD兾bladder HLODs
PD兾syndrome HLODs
Chromosome
cM
Marker
Dominant
P value
Recessive
P value
Dominant
P value
1 2 2 5 5 6 9 10 12 13 13 16 22
247 4 252 59 183 73 147 59 109 76 83 11 46
D1S3462 D2S2976 D2S2968 D5S1457 D5S211 D6S2410 D9S2157 D10S1426 PAH D13S793 D13S779 D16S2616 D22S445
2.22
0.002
0.85 2.34 2.22
0.05 0.001 0.002
1.04 0.63
0.03 0.08
0.83
0.05
2.79 1.50 2.76 1.94 2.16
0.0005 0.01 0.0005 0.004 0.002
0.004 0.02 0.01 0.01 0.02
0.03
0.08 0.07
1.92 1.31 1.49 1.34 1.32
1.10
0.63 0.71
3.13
0.0002
1.93 3.57 3.20 1.30 4.11
0.004 0.00008 0.0002 0.02 0.00002
Recessive
P value
1.13 0.91 1.18 2.19 2.46 2.34 2.01 2.85 0.93 0.78
0.02 0.04 0.02 0.002 0.001 0.001 0.003 0.0004 0.04 0.06
1.89
0.004
HLODs and associated P values for markers that showed HLODs ⬎2.0 under any analytic model are shown. Scores ⬍0.59 are removed for presentation clarity. Scores are highlighted according to the significance thresholds described in the text. Significant scores, ⬎3.3, are in bold; suggestive scores, ⬎1.86, are underlined; and nominal scores, ⬎0.59, are in italics.
associated P values (32). As a starting point, we used the familiar Lander–Kruglyak criterion for significance, with genome-wide significance of LOD ⫽ 3.3 (P ⫽ 0.00049), suggestive significance of LOD ⫽ 1.86 (P ⫽ 0.0017), and nominal significance of LOD ⫽ 0.59 (P ⫽ 0.05; refs. 33 and 34). Thus, P values for single-locus LOD scores were generated by using an Excel conversion spreadsheet (32). In the work presented here, we focused on LOD scores obtained under heterogeneity (i.e., HLODs), as the admixture model represents the preferred method of analysis under conditions of heterogeneity (35, 36). It is not clear what the critical HLOD should be for this situation. Chiano and Yates (37) suggest 3.44 for heterogeneity scores, but that was for a single genetic model. Based on extensive computer simulations, Abreu et al. (34) suggested 3.70 for HLODs when two genetic models are considered, as is done here. This corresponds to a P value of 0.0001 (or 2.8 for a P value of 0.001). We present our maximum HLOD scores under several different situations. Results Pedigree Description. A pedigree was characterized as a syndrome
family (60 total) by the presence of at least one individual with kidney兾bladder conditions. Among these 60 families are the 19 pedigrees that described in ref. 17. The entire data set of 60 families included 889 individuals, of which 245 were diagnosed as definitely affected with PD, 85 probably affected, 41 possibly affected, 73 with any panic, 89 unaffected, and 356 unknown. Family size ranged from 5 to 39, with a mean size of 14.7, and a median size of 13. DNA was available for 587 individuals. The median number of affected individuals per family was six for PD兾bladder and eight for PD兾syndrome. The 60 pedigrees contained 34 affected sib pairs, 23 affected sib trios, 8 affected sib quartets, 1 affected sib quintet, and one family with 7 affected siblings. Linkage Results. A genomic screen was performed on families that
segregated PD and that contained at least one family member with a bladder兾kidney condition. A total of 384 polymorphic markers for autosomes and both sex chromosomes with an average spacing of 9 cM and an average heterozygosity of 0.76 were genotyped in 587 individuals. Graphical representations of all linkage data described below are available in Figs. 2–11, which are published as supporting information on the PNAS web site, www.pnas.org.
2552 兩 www.pnas.org兾cgi兾doi兾10.1073兾pnas.0335669100
Parametric Single-Locus Analyses. our HLOD scores were calculated for each marker, as described in Materials and Methods. Table 1 shows 13 markers that gave single-locus HLOD scores of ⬎2.0 in any of the four analyses (two genetics model ⫻ two diagnostic models). The highest score, 4.11, was found at the most telomeric marker on chromosome 22, D22S445, using a dominant-genetic model and the PD兾syndrome phenotype. Under the same model, the adjacent marker (D22S683), 10 cM away, showed all-negative HLOD scores (i.e., with a maximum HLOD score of 0). The two next highest scores were 3.57 and 3.20 from the adjacent chromosome 13q markers, D13S793 and D13S779 (separated by 7 cM), respectively, observed under a dominant model using the PD兾syndrome phenotype. The latter marker had also provided the highest HLOD score of 3.3 in our previous genomic screen with the first 19 of the current 60 families (17). A fourth marker, D16S2616, at 11 cM on chromosome 16p, yielded a HLOD score of 3.13 under a recessive model with the more restrictive PD兾bladder phenotype. The adjacent marker (D16S748, 23 cM) provided a HLOD score of 1.61 under the same model. Nine other markers (two each from chromosomes 2 and 5, and one each from chromosomes 1, 6, 9, 10, and 12) produced HLOD scores between 2.0 and 3.0. HLOD scores in Table 1 were also converted to P values for easy comparison to other analytic approaches (32, 34). Parametric Multipoint Analyses. Using GENEHUNTER, the highest
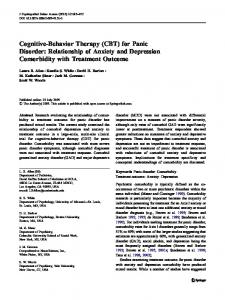
parametric multipoint HLOD was 3.21, using a recessive genetic model of the PD兾syndrome phenotype, occurring at 124 cM on chromosome 9. Four HLOD scores were ⬎3 in this region, and HLOD scores of ⬎2.0 stretched from 114 to 131 cM. In the single-locus analysis, the results for the same region using the same parameters were consistent, showing HLOD scores of 1.95 (128 cM), 1.85 (136 cM), and 2.01 (147 cM) for the three consecutive markers D9S934, D9S1825, and D9S2157, respectively (Fig. 1). The single-locus peak was displaced slightly telomeric from the multipoint results. A second multipoint peak occurred using the same genetic and diagnostic models on chromosome 7p, with a maximum HLOD ⫽ 2.6 at 11 cM, and HLODs ⬎2 from 9 to 13 cM. Single-locus scores under the same models were somewhat smaller (0.94 for D7S3056 at 7 cM and 1.47 for D7S513 at 18 cM). Regarding chromosome 13, we observed a multipoint HLOD ⫽ 2.42, using a dominant-genetic model of the PD兾 bladder phenotype. This score occurred at 74 cM on chromosome 13, just 2 cM centromeric to D13S793 (76 cM), which had Hamilton et al.
PD兾syndrome model, in a region where the single-locus score was 1.98 under the same model (D18S1364, 99 cM). Nonparametric Multipoint Analyses. NPL scores were also obtained
Fig. 1. Comparison of single-locus and multipoint LOD scores. Single-locus HLOD, multipoint HLOD, and NPL scores are presented for three genomic areas of interest. NPL scores are scaled to LOD units for direct comparison. The genetic model (recessive vs. dominant) is indicated for parametric scores. 䉬, PD兾bladder multipoint HLOD score; ■, PD兾bladder NPL score; Œ, PD兾syndrome ⱍ PD兾bladder singlemultipoint HLOD score; ⫻, PD兾syndrome NPL score; ⫻, locus HLOD score; ⫹, PD兾syndrome single-locus HLOD score.
a single-locus HLOD score of 2.76 using the same models, and a single-locus HLOD score of 3.57 using the dominant-genetic model and broader PD兾syndrome phenotype. The corresponding multipoint HLOD peaked at 1.94 at 73 cM (Fig. 1). The only other multipoint parametric HLOD score of ⬎2.0 occurred at 96 cM on chromosome 18 (2.03), under a dominant Hamilton et al.
Discussion The work described here was designed to further test our earlier hypothesis positing the existence of a genetic syndrome involving PD, bladder兾kidney conditions, MVP, severe headaches, and thyroid conditions. This syndrome was initially identified purely on clinical observation, blind to family relationships or linkage results. Because we observed our highest LOD scores with this construct, we elected to pursue this finding. We have expanded our collection of pedigrees from 19 to 60, and completed a genome scan of the entire 60 families. It was encouraging that a region on chromosome 13, previously linked to this syndrome, continued to show evidence for linkage when parametric analyses were used. In our previous study of 34 PD families (17), marker D13S779 (at 83 cM) had yielded a maximal HLOD score of 3.3 under a dominantgenetic model using the PD兾bladder phenotype, and 2.8 using the PD兾syndrome phenotype. When analyzed in the 19 bladder families only, the maximal LOD score had increased to 3.5 and 4.2, at ˆ ⫽ 0.06 and 0.04, using the PD兾bladder and PD兾 syndrome phenotypes, respectively. In the current study, in the complete sample of 60 families, this marker yielded a maximal LOD score of 2.2 at ˆ ⫽ 0.20. Although this is still positive, it represents weaker evidence for linkage than we had previously. Why? If we break down the 60 families into the original 19 plus the new 41 families, then, based on the CIDR genotyping, the original 19 families would not have been particularly striking (maximal LOD is only 0.7, at ˆ ⫽ 0.10). We believe this discrepancy is because of missing genotypes in the current scan, and fine-mapping this region (including repeating genotyping D13S779) should resolve the discrepancy. However, the 41 new families yield a maximal LOD of 1.4 at ˆ ⫽ 0.20. Had we combined our lab’s genotyping of the original 19 families with the CIDR genotyping of the 41 new ones, the combined maximal LOD would be 4.6 at ˆ ⫽ 0.10, which would be impressive evidence of linkage. We chose not to highlight this approach, preferring to present the results more conservatively, as above. Then we also calculated HLOD scores on the complete CIDR scan, since increased heterogeneity may have entered the sample with the influx of 41 new families. Indeed, the maximal HLOD was 3.2, significantly higher than the homogeneity LOD of 1.4. The maximal HLOD score calculated on the combined sample (our genotyping of the original 19 families plus CIDR’s genotyping of the 41 new families) was even higher: 5.5. These comparisons are summarized in Table 2. Thus, overall, we believe the evidence for linkage to this marker on chromosome 13 is quite strong, despite the difficulties represented by this complex disease. The adjacent marker, D13S793 at 76 cM, which had not been previously typed, was found in the current study to have a maximal HLOD score of 3.6. Multipoint parametric heterogeneity scores supported linkage in this region, maximizPNAS 兩 March 4, 2003 兩 vol. 100 兩 no. 5 兩 2553
GENETICS
with GENEHUNTER, and all NPL scores were converted to the LOD unit scale for easier comparison. The analysis yielded the highest score of 3.04 (on a LOD scale) at 8 cM on chromosome 15 under the PD兾bladder phenotype. This region, remarkably, showed less impressive evidence of linkage when the single-locus approach was used (maximal single-locus HLOD ⫽ 1.40 at 12 cM with marker D15S822 under a dominant PD兾bladder phenotype). The region around D13S793 on chromosome 13 showed elevated NPL scores, consistent with the parametric single-locus and multipoint scores (Fig. 1). Interestingly, the region surrounding D22S445, our highest single-locus HLOD, showed little support for linkage in that area (dominant multipoint HLOD ⫽ 0.44, NPL ⫽ 0.71).
Table 2. Single-locus LOD and HLOD scores for marker D13S779 LODs Original 19
HLODs
New 41
Total
Total
Genotyping
Zmax
ˆ
Zmax
ˆ
Zmax
ˆ
Max HLOD
␣ˆ
ˆ
Our lab CIDR Combine
4.2 0.7 —
0.04 0.10 —
— 1.4 —
— 0.20 —
— 2.2 4.6
— 0.20 0.10
— 3.2 5.5
— 0.40 0.55
— 0.01 0.01
Scores obtained for marker D13S779 from our previous genome screen and the current work are presented. The phenotypic model is PD兾syndrome. See text for details. Combine, results when our lab’s genotyping of the first 19 families is combined with CIDR’s genotyping of the new 41 families; Zmax, maximal LOD score obtained.
ing at marker D13S793. Interestingly, nonparametric multipoint scores were only modestly positive in this region. We are most interested in these findings on chromosome 13, as they were supported by the convergence of two analytic techniques, namely single-locus and multipoint approaches. As is the case with many complex diseases, increasing sample size may have led to an increase of heterogeneity in the data set. Therefore, the evidence for linkage to chromosome 13 slightly decreased from our previous scan at one marker (D13S779), but the significance of this finding increased with this study because we have now performed a second complete genome scan, thus excluding most of the genome (with the possible exception of chromosome 22q) as a likely location for a gene for the panic syndrome. Another region with a similar overlap of results was on chromosome 9. We found a single-locus HLOD of 2.0 at D9S2157, using a recessive genetic model and the PD兾syndrome phenotype, with scores slightly ⬍2 at the two flanking centromeric markers. This same model and phenotype provided our highest parametric multipoint score, although somewhat centromeric to the single-locus peak. In terms of absolute LOD score magnitude, we observed our highest single-locus parametric score on chromosome 22 (HLOD ⫽ 4.11 at D22S445). Markers flanking the telomeric D22S445 showed no evidence of linkage, and multipoint analyses in this region were not positive. Thus, genotyping more markers in this region will be required to confirm the presence of linkage in this region. Until then, this locus provides the highest LOD score in this study. Likewise, chromosome 15, the region with the highest NPL multipoint score, showed little evidence of linkage when single-locus strategies were used, and will require fine-mapping to confirm linkage. While the finding on chromosome 13 was most clearly consistent with our previous report, we note that other regions that we identified in the initial scan of 19 families continue to be of interest. Of the eight markers showing significant differences between bladder and nonbladder families (nominal significance, P ⬍ 0.01, predivided-sample test) in the first 19 families, four regions continued to show detectable linkage. These included chromosomes 1, 12, 13 (as described above), and 16. Our peak on chromosome 1q, which incidentally occurs within the DISC1 (disrupted in schizophrenia 1) gene (38), was ⬇40 cM telomeric to our earlier peak. A peak on 12q, occurring within the third intron of PAH (phenylalanine hydroxylase) locus, was about 14 cM telomeric to our previous high score in that region. Finally, a high HLOD on chromosome 16p (D16S2616, HLOD 3.13), was only ⬇3 Mb centromeric to our previous peak at D16S423. These findings must be viewed in light of the limitations of the study. First, the choice of analytic techniques to be used in the genetic analysis of complex traits is still contested. We have used parametric LOD score analysis. We have also used multipoint approaches to maximize the genetic information collected, but these methods are problematic when the marker map is imprecise (39) or when family size increases (40), although multipoint 2554 兩 www.pnas.org兾cgi兾doi兾10.1073兾pnas.0335669100
analysis is not particularly sensitive to model misspecification (41). Second, we have used a number of diagnostic schemes and genetic models, raising the specter of multiple testing. However, these multiple analyses are not arbitrary or random. Our several data breakdowns are based on clinical evidence and careful examination of our families, and our goal is to link distinct pieces of evidence so as to put together a coherent picture of the genetics of PD. Third, as we noted in our previous genome scan, in which the syndrome construct was developed, our assessment of medical problems constituting the syndrome was limited to medical records and self-reports, without the benefit of direct medical examination. Finally, as the current data set incorporates pedigrees from our earlier analysis, the work presented here should be viewed as an expansion of that work (17), and not an independent replication. In light of these reservations, what can be gleaned from these results? We have tripled the number of panic兾bladder syndrome families and have not seen support for the chromosome 13 locus diminish in any substantial way. The persistence of this finding is promising. The appearance in this genome scan of regions with suggestive or significant evidence for linkage, although possibly false positives, may reflect the increased power of the sample. Alternatively, these new regions may be because of locus heterogeneity in our sample, with stochastic enrichment of families segregating particular linked chromosomes. It is of interest to note genetic linkage studies involving other psychiatric disorders, most notably schizophrenia and bipolar disorder, have also shown linkage to the 13q region (42–50). A recent metaanalysis of 11 bipolar disorder and 18 schizophrenia genomic screens showed the strongest evidence for linkage for both disorders to be localized to chromosome 13q (51). The aggregate of these findings suggests several possible explanations. First, several genes independently linked to schizophrenia, or bipolar disorder, or the PD syndrome described here, may be coincidentally located in the same region of chromosome 13q. Second, a single locus that serves as a common susceptibility locus for a number of psychiatric disorders is the source of linkage signals in the studies cited above. One might wonder whether data from gene-mapping studies for the component disorders of the panic syndrome described here would prove useful. If researchers looking at the constituent conditions of our syndrome on an individual basis found independent evidence of linkage to regions of interest in our data, this might support our clinical construct. Thus, comparisons of genomic screens in these disorders for overlap of linkage signals is of interest. Recent genomic scans of families with MVP found evidence for linkage to chromosomes 16p (52) and Xq28 (53), regions with modest evidence for linkage in our sample. Studies of families with hypothyroidism (54) or hyperthyroidism (55) show linkage to the region of the thyroglobulin gene on 8q, a region that also showed little evidence for linkage in our study. Finally, efforts at mapping genes for the most common forms of migraine have implicated the broad region of Xq24–27 (56) and Hamilton et al.
4q24 (57). These regions showed modest evidence for linkage in our study (HLOD scores of 1.8 and 1.4, respectively). Overall, there appears to be some overlap of findings, although not for our highest scores. In conclusion, we have presented further evidence for several pleiotropic loci for susceptibility to the panic syndrome. In particular, we have striking and consistent evidence for a susceptibility gene on chromosome 13 and兾or chromosome 22. Our approach shows that clinical stratification may reduce the genetic heterogeneity likely to underlie all complex disorders. Fine-resolution mapping of the loci described here should
We thank Dale Nyholt for helpful discussions, and we acknowledge the invaluable contribution made by the families who participated in this study. This study was supported by National Institute of Mental Health Grants MH28274 (to M.M.W.), MH37592 (to A.J.F. and Donald F. Klein), and MH48858 (to S.E.H.). Genotyping services were provided by the Center for Inherited Disease Research, which is fully funded through Federal Contract N01-HG-65403 from the National Institutes of Health to The Johns Hopkins University.
1. Weissman, M. M., Bland, R. C., Canino, G. J., Faravelli, C., Greenwald, S., Hwu, H.-G., Joyce, P. R., Karam, E. G., Lee, C.-K., Lellouch, J., et al. (1997) Arch. Gen. Psychiatry 54, 305–309. 2. Knowles, J. A. & Weissman, M. M. (1995) in Review of Psychiatry, eds. Oldham, J. M. & Riba, M. B. (Am. Psychiatr. Press, Washington, DC), Vol. 14, pp. 383–404. 3. Hettema, J. M., Neale, M. C. & Kendler, K. S. (2001) Am. J. Psychiatry 158, 1568–1578. 4. Knowles, J. A., Fyer, A. J., Vieland, V. J., Weissman, M. M., Hodge, S. E., Heiman, G. A., Haghighi, F., de Jesus, G. M., Rassnick, H., Preud’hommeRivelli, X., et al. (1998) Am. J. Med. Genet. 81, 139–147. 5. Crowe, R. R., Goedken, R., Wilson, R., Samuelson, S., Nelson, J. & Noyes, R., Jr. (2001) Am. J. Med. Genet. 105, 105–109. 6. Gelernter, J., Bonvicini, K., Page, G., Woods, S. W., Goddard, A. W., Kruger, S., Pauls, D. L. & Goodson, S. (2001) Am. J. Med. Genet. 105, 548–557. 7. Smoller, J. W., Acierno, J. S., Jr., Rosenbaum, J. F., Biederman, J., Pollack, M. H., Meminger, S., Pava, J. A., Chadwick, L. H., White, C., Bulzacchelli, M., et al. (2001) Am. J. Med. Genet. 105, 195–206. 8. Zaubler, T. S. & Katon, W. (1996) Bull. Menninger Clin. 60, A12–A38. 9. Weissman, M. M., Markowitz, J. S., Ouellette, R., Greenwald, S. & Kahn, J. P. (1990) Am. J. Psychiatry 147, 1504–1508. 10. Breslau, N., Schultz, L. R., Stewart, W. F., Lipton, R. & Welch, K. M. (2001) Neurology 56, 350–354. 11. Gorman, J. M., Goetz, R. R., Fyer, M., King, D. L., Fyer, A. J., Liebowitz, M. R. & Klein, D. F. (1988) Psychosom. Med. 50, 114–122. 12. Placidi, G. P., Boldrini, M., Patronelli, A., Fiore, E., Chiovato, L., Perugi, G. & Marazziti, D. (1998) Neuropsychobiology 38, 222–225. 13. Stewart, W., Breslau, N. & Keck, P. E., Jr. (1994) Neurology 44, S23–S27. 14. Bulbena, A., Duro, J. C., Porta, M., Martin-Santos, R., Mateo, A., Molina, L., Vallescar, R. & Vallejo, J. (1993) Psychiatry Res. 46, 59–68. 15. Martin-Santos, R., Bulbena, A., Porta, M., Gago, J., Molina, L. & Duro, J. C. (1998) Am. J. Psychiatry 155, 1578–1583. 16. Gratacos, M., Nadal, M., Martin-Santos, R., Pujana, M. A., Gago, J., Peral, B., Armengol, L., Ponsa, I., Miro, R., Bulbena, A., et al. (2001) Cell 106, 367–379. 17. Weissman, M. M., Fyer, A. J., Haghighi, F., Heiman, G. A., Deng, Z., Hen, R., Hodge, S. E. & Knowles, J. A. (2000) Am. J. Med. Genet. 96, 24–35. 18. Hodge, S. E., Anderson, C. E., Neiswanger, K., Sparkes, R. S. & Rimoin, D. L. (1983) Am. J. Hum. Genet. 35, 1139–1155. 19. Fyer, A. J. & Weissman, M. M. (1999) Am. J. Med. Genet. 88, 173–181. 20. Mannuzza, S., Fyer, A. J., Klein, D. F. & Endicott, J. (1986) J. Psychiatr. Res. 20, 317–325. 21. Chapman, T. F., Mannuzza, S., Klein, D. F. & Fyer, A. J. (1994) Am. J. Psychiatry 151, 574–579. 22. Andreasen, N. C., Endicott, J., Spitzer, R. L. & Winokur, G. (1977) Arch. Gen. Psychiatry 34, 1229–1235. 23. American Psychiatric Association (1987) Diagnostic and Statistical Manual of Mental Disorders (Am. Psychiatr. Publ., Arlington, VA), 3rd Ed., revised. 24. Hamilton, S. P., Heiman, G. A., Haghighi, F., Mick, S., Klein, D. F., Hodge, S. E., Weissman, M. M., Fyer, A. J. & Knowles, J. A. (1999) Psychiatr. Genet. 9, 1–6. 25. Sambrook, J., Fritsch, E. F. & Maniatis, T. (1989) Molecular Cloning: A Laboratory Manual (Cold Spring Harbor Lab. Press, Plainview, NY), 2nd Ed. 26. Vieland, V. J., Hodge, S. E., Lish, J. D., Adams, P. & Weissman, M. M. (1993) Psychiatr. Genet. 3, 63–71. 27. Abreu, P. C., Greenberg, D. A. & Hodge, S. E. (1999) Am. J. Hum. Genet. 65, 847–857. 28. Greenberg, D. A., Abreu, P. & Hodge, S. E. (1998) Am. J. Hum. Genet. 63, 870–879. 29. Hodge, S. E., Abreu, P. C. & Greenberg, D. A. (1997) Am. J. Hum. Genet. 60, 217–227.
30. Ott, J. (1974) Am. J. Hum. Genet. 26, 588–597. 31. Kruglyak, L., Daly, M. J., Reeve-Daly, M. P. & Lander, E. S. (1996) Am. J. Hum. Genet. 58, 1347–1363. 32. Nyholt, D. R. (2000) Am. J. Hum. Genet. 67, 282–288. 33. Lander, E. & Kruglyak, L. (1995) Nat. Genet. 11, 241–247. 34. Abreu, P. C., Hodge, S. E. & Greenberg, D. A. (2002) Genet. Epidemiol. 22, 156–169. 35. Hodge, S. E., Vieland, V. J. & Greenberg, D. A. (2002) Am. J. Hum. Genet. 70, 556–559. 36. Goldin, L. R. (1992) Genet. Epidemiol. 9, 61–66. 37. Chiano, M. N. & Yates, J. R. (1995) Ann. Hum. Genet. 59, 83–95. 38. Millar, J. K., Wilson-Annan, J. C., Anderson, S., Christie, S., Taylor, M. S., Semple, C. A., Devon, R. S., Clair, D. M., Muir, W. J., Blackwood, D. H., et al. (2000) Hum. Mol. Genet. 9, 1415–1423. 39. Risch, N. & Giuffra, L. (1992) Hum. Hered. 42, 77–92. 40. Goedken, R., Ludington, E., Crowe, R., Fyer, A. J., Hodge, S. E., Knowles, J. A., Vieland, V. J. & Weissman, M. M. (2000) Am. J. Med. Genet. 96, 781–783. 41. Greenberg, D. A. & Abreu, P. C. (2001) Genet. Epidemiol. 21, 299–314. 42. Blouin, J. L., Dombroski, B. A., Nath, S. K., Lasseter, V. K., Wolyniec, P. S., Nestadt, G., Thornquist, M., Ullrich, G., McGrath, J., Kasch, L., et al. (1998) Nat. Genet. 20, 70–73. 43. Brzustowicz, L. M., Honer, W. G., Chow, E. W., Little, D., Hogan, J., Hodgkinson, K. & Bassett, A. S. (1999) Am. J. Hum. Genet. 65, 1096–1103. 44. Cardno, A. G., Holmans, P. A., Rees, M. I., Jones, L. A., McCarthy, G. M., Hamshere, M. L., Williams, N. M., Norton, N., Williams, H. J., Fenton, I., et al. (2001) Am. J. Med. Genet. 105, 439–445. 45. Detera-Wadleigh, S. D., Badner, J. A., Berrettini, W. H., Yoshikawa, T., Goldin, L. R., Turner, G., Rollins, D. Y., Moses, T., Sanders, A. R., Karkera, J. D., et al. (1999) Proc. Natl. Acad. Sci. USA 96, 5604–5609. 46. Faraone, S. V., Skol, A. D., Tsuang, D. W., Bingham, S., Young, K. A., Prabhudesai, S., Haverstock, S. L., Mena, F., Menon, A. S., Bisset, D., et al. (2002) Am J. Med. Genet. 114, 598–604. 47. Kelsoe, J. R., Spence, M. A., Loetscher, E., Foguet, M., Sadovnick, A. D., Remick, R. A., Flodman, P., Khristich, J., Mroczkowski-Parker, Z., Brown, J. L., et al. (2001) Proc. Natl. Acad. Sci. USA 98, 585–590. 48. Lin, M. W., Sham, P., Hwu, H. G., Collier, D., Murray, R. & Powell, J. F. (1997) Hum. Genet. 99, 417–420. 49. Liu, C., Badner, J. A., Christian, S. L., Guroff, J. J., Detera-Wadleigh, S. D. & Gershon, E. S. (2001) Am. J. Med. Genet. 105, 375–380. 50. Pulver, A. E., Wolyniec, P. S., Housman, D., Kazazian, H. H., Antonarakis, S. E., Nestadt, G., Lasseter, V. K., McGrath, J. A., Dombroski, B., Karayiorgou, M., et al. (1996) Cold Spring Harbor Symp. Quant. Biol. 61, 797–814. 51. Badner, J. A. & Gershon, E. S. (2002) Mol. Psychiatry 7, 405–411. 52. Disse, S., Abergel, E., Berrebi, A., Houot, A. M., Le Heuzey, J. Y., Diebold, B., Guize, L., Carpentier, A., Corvol, P. & Jeunemaitre, X. (1999) Am J. Hum. Genet. 65, 1242–1251. 53. Kyndt, F., Schott, J. J., Trochu, J. N., Baranger, F., Herbert, O., Scott, V., Fressinaud, E., David, A., Moisan, J. P., Bouhour, J. B., et al. (1998) Am J. Hum. Genet. 62, 627–632. 54. Ahlbom, B. E., Yaqoob, M., Gustavsson, P., Abbas, H. G., Anneren, G., Larsson, A. & Wadelius, C. (2002) Hum. Genet. 110, 145–147. 55. Tomer, Y., Greenberg, D. A., Concepcion, E., Ban, Y. & Davies, T. F. (2002) J. Clin. Endocrinol. Metab 87, 404–407. 56. Nyholt, D. R., Curtain, R. P. & Griffiths, L. R. (2000) Hum. Genet. 107, 18–23. 57. Wessman, M., Kallela, M., Kaunisto, M. A., Marttila, P., Sobel, E., Hartiala, J., Oswell, G., Leal, S. M., Papp, J. C., Hamalainen, E., et al. (2002) Am J. Hum. Genet. 70, 652–662.
Hamilton et al.
PNAS 兩 March 4, 2003 兩 vol. 100 兩 no. 5 兩 2555
GENETICS
provide candidate genes for further characterization and eventual isolation of genes for this interesting syndrome.