FUSE: A System for Data-Driven Multi-Level Functional Summarization of Protein Interaction Networks Boon-Siew Seah§ Sourav S Bhowmick§ C F Dewey, Jr† Hanry Yu¶ § School of Computer Engineering, Nanyang Technological University, Singapore † Department of Biological Engineering, Massachusetts Institute of Technology, USA ¶ Department of Physiology, National University of Singapore, Singapore seah0097|
[email protected],
[email protected],
[email protected]
Abstract Despite recent progress in high-throughput experimental studies, systems level visualization and analysis of large protein interaction networks (ppi) remains a challenging task, given its scale and high-dimensionality. Specifically, techniques that automatically abstract and summarize ppis at multiple resolutions to provide high level views of its functional landscape are still lacking. In this demonstration, we present a novel data-driven and generic system called fuse (Functional Summary Generator) that generates functional maps of a ppi at different levels of organization, from broad process-process level interactions to in-depth complex-complex level interactions. By simultaneously evaluating interaction and annotation data, fuse abstracts higher-order interaction maps by reducing the details of the underlying ppi to form a functional summary graph of interconnected functional clusters. We demonstrate various innovative features of fuse which aid users to visualize these summaries in a user-friendly manner and navigate through complex ppis.
Categories and Subject Descriptors J.3 [Life And Medical Sciences]: Biology and genetics; H.5.2 [Information Interfaces And Presentation]: User Interfaces—Theory and methods
General Terms Algorithms, Performance
1. INTRODUCTION With advances in high throughput experimental biology, the number of large scale and disease specific protein interaction networks (ppi) have grown rapidly. The amount of information contained within large ppi, however, can often overwhelm researchers, making systems level analysis and visualization of ppis a daunting task. Consequently, making sense of the deluge of interaction data has emerged as an important research problem. A key solution to visualizing
Permission to make digital or hard copies of all or part of this work for personal or classroom use is granted without fee provided that copies are not made or distributed for profit or commercial advantage and that copies bear this notice and the full citation on the first page. To copy otherwise, to republish, to post on servers or to redistribute to lists, requires prior specific permission and/or a fee. IHI’12, January 28–30, 2012, Miami, Florida, USA. Copyright 2012 ACM 978-1-4503-0781-9/12/01 ...$10.00.
large interaction networks is to identify means of abstracting and decomposing the network into modules or functional clusters that interact with one another [3]. This allows one to perceive higher-order structures and patterns. At the same time, knowledgebases with Gene Ontology (go) annotations, such as UniprotKB, provide a wealth of annotation data at different levels of specificity. As proteins may involve in multiple roles and functions, go attributes associated with a protein or a gene can be high-dimensional. As majority of function annotation and high throughput or curated interaction data are encoded at protein or gene level, higher-order abstraction maps such as complex-complex or process-process functional landscapes, are often unavailable. However, availability of such information is invaluable as it not only allows one to ask questions about the relationships among high-level modules, such as cellular processes and complexes, but also allows one to visualize higher order patterns from a bird’s eye perspective. For instance, consider the Alzheimer’s Disease (ad) related ppi in IntAct [6]. A multi-level bird’s eye view of the functional landscape of ad network will enable us to understand the interplay of related processes in tandem to identify the causative mechanisms of ad. One might be able to answer the following questions: How do signaling pathways implicated for ad associate with one another? How do proteins related to transportation play a role in ad, and how are they associated with bioenergetics? (see [13] for details). We present fuse (Functional Summary Generator) – a novel interaction network visualization system that generates multi-level functional summaries of the underlying ppi graph [13]. fuse attempts to identify summaries that best represent higher-order abstractions of the ppi graph by simultaneously evaluating both interaction and annotation data. In particular, each summary graph simultaneously satisfy the following requirements: (a) it is at a specific level of detail, (b) it is representative of the original network, and (c) redundancies are minimized. These summaries are presented as layers of increasingly detailed functional landscapes, and users can navigate between the layers of summaries, visualizing broad processes map at the highest level, all the way to the underlying ppi itself at the lowest level.
2.
RELATED SYSTEMS & NOVELTY
The traditional data-driven approach to address this problem is to perform graph clustering to identify densely connected regions [2, 12, 14]. Cluster function can then be inferred and annotated by finding enriched annotations within the cluster. Although effective for identification of com-
3. SYSTEM OVERVIEW Figure 2 illustrates the system architecture of fuse, which consists of the following modules. The GUI module: Figure 3(a) shows the screenshot of the fuse interface. The user loads an input ppi graph through the menu panel (Panel 1). A new tabbed pane is created to allow the construction of higher-order summaries. The side panel (Panel 2) provides a means to several system features– including controlling user-defined parameters, searching for proteins and clusters, and filtering results. The summary graph generated by fuse is displayed in Panel 3. Finally, the user runs the summary construction by pressing RUN button in Panel 4. Figures 5(b)-(c) depict sample summaries constructed through fuse. The size and color of the node is correlated with the size of the cluster, while the thickness of the edges imply the association strength between two clusters. Additionally, the association strength slider in Panel 4 can be adjusted to dynamically filter edges in the result summary based on an edge’s association significance cutoff. The Parser module: This module parses the input ppi into the graph storage. A protein interaction network (ppi), G = (V, E), contains a set of vertices V , representing proteins, and a set of edges E, representing interactions. Cur-
(a) F-measure
1
(b) Representativeness
1
FUSE MCODE MCL NeMo CSV
0.8 precision score
0.8
F score
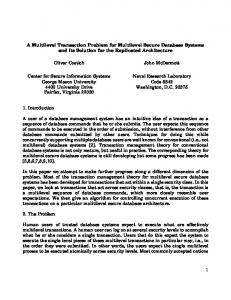
plexes, they are less suitable for identifying higher level functional clusters, such as biological processes and pathways, where interactors within them are likely to overlap [11]. CFinder [1] locates overlapping communities based on structure of the network, but ignores the wealth of functional knowledge already encoded in go annotations. These approaches also places strong focus on connectivity, ignoring the attribute coherence of the proteins in cluster. In practical applications of ppi summarization, however, attribute coherent regions (groups of proteins (vertices) that share a common vertex property) are key to forming meaningful, interpretable modules. Otherwise, clusters with inconsistent vertex properties, even if structurally well-connected, may not simply summarize into one functionally interpretable cluster that a user can quickly infer. Although some recent techniques utilize annotation information when clustering the networks [10], they form non-overlapping partitions and do not scale for high-dimensional attributes found in go annotated interaction networks. Other functional groups may also be less structurally dense (e.g., signaling pathways). Finally, because the annotations that describe proteins and their functions are high-dimensional, finding the right choice of attribute coherent groupings is combinatorial and non-trivial. To our knowledge, no existing method directly addresses our need for generating overlapping clusters from high-dimensional attributed graphs. Figure 1 depicts the summarization quality for varying summary granularity sizes (k) compared to state-of-the-art graph clustering methods, namely Markov clustering (mcl) [9], mcode [2], and nemo [12], and csv [14]. The reader may refer to [13] for the details. With the hprd [7] molecule class annotations as gold standard, observe that fuse generates summary with significantly higher F-measure score compared to the graph clustering-based approaches. Additionally, fuse assigns labels that are most representative of the proteins in the cluster. Thus, fuse is the first system that automatically generates superior quality summaries at multiple levels of complexity of the underlying ppi.
0.6
0.4
0.2
0.6
0.4
0.2
0
FUSE MCODE MCL NeMo CSV
0 0
5
10
15
20
25 k
30
35
40
45
0
5
10
15
20
25
30
35
40
45
k
Figure 1: Quality of summarization by FUSE.
Figure 2: Architecture of FUSE. rent version of fuse supports the following input network formats: psi-mi 2.5 [5] formatted graphs and hprd [7] graphs. This module also caches the network to accelerate subsequent reading of the network. The Functional Clusters Constructor module: Let u ∈ S∆ be a functional term in the annotation database S∆ . The annotation database contains go functional attributes of individual proteins. Also stored in the database is the go directed acyclic graph (dag) ontology, denoted as D. Each protein v ∈ V can be associated with a term association vector, denoted by ∆v , indicating go terms associated with v. A functional cluster, denoted as C(u), is a subgraph of G such that every node in the subgraph shares the function represented by the go term u. Prior to summary construction, possible functional clusters candidates must be enumerated. This module computes the candidate functional clusters from the input graph and the annotation database. The Iterative Summarizer module: Intuitively, graph summarization seeks to mix and match functional clusters from the candidates to identify the summary graph consisting of k clusters that best represent the underlying ppi. A functional summary graph of the underlying protein interaction network G(V, E), ΘG , is defined as ΘG = (S, F, Pi , α) , where S is a set of functional clusters and F is a set of edges that links the functional clusters. Let ocuv be the number of interactions connecting proteins in C(u) and C(v). Let Pi be the probability density function of observing ouv or more number of interactions between C(u) and C(v). Let β be a significance cut-off parameter (user-defined). Then, (C(u), C(v)) ∈ F if and only if Pi (X > ocuv ) ≤ 2β/|S|2 . The bijection α : 1, 2, . . . , m ↔ S is an ordering of S. To model this problem, we introduced a profit maximization model that quantifies the meaning of having a representative functional summary graph. It aims to find Θmin =
(a) Visual interface.
(b) Detailed viewer interface. Figure 3: The FUSE system.
(S, F, Pi , α) by maximizing information profit under a budget constraint. Every protein i ∈ V is assigned a nonnegative information budget b, which represents the information it contains. Let the ordered set ∆ = ⟨u1 , u2 , . . . , un ⟩ be a topological sort of D. Let S∆ be the set of functional clusters induced from ∆. Every functional cluster C(u) ∈ S∆ is assigned a non-negative structural information value ψ C(u) , which represents the amount of structural information contained within the functional subgraph. When a functional cluster C(u) is added to the summary, for every protein i ∈ V (u), a portion of b is taken out and added to summary information gain. This represents new information added to the summary. The amount to take depends on ψ C(u) . Imposing information budget b limits the amount of information a protein can provide. A parameter 0 ≤ d ≤ 10 is also introduced to penalize redundancy. Thus, repeated representation of a protein i yields reduced information gain, modeling diminishing returns. Let Ki be a set of functional clusters such that C(u) ∈ Ki if and only if i ∈ C(u). Based on this profit model, we construct the set of functional clusters that maximizes profit by satisfying the following optimization problem: maximize
|S| ∑∑
p(i, j)
i∈V j=1
where
b(i, m) =
d (b(i, m 10
− 1) − p(i, m − 1))
b(i, m − 1)
b ψ αS (m) p(i, m) = b(i, m) 0 subject to |S| = k S ⊂ S∆
if m > 1, αS (m − 1) ∈ Ki if m > 1, αS (m − 1) ∈ / Ki if m = 1
and
if b(i, m) ≥ ψ αS (m) and αS (m) ∈ Ki if b(i, m) < ψ αS (m) and αS (m) ∈ Ki αS (m) ∈ / Ki
The profit maximization problem is a variation of the budgeted maximum coverage problem [8], which is an NPhard problem. To permit a tractable solution, we adopt a modified greedy approach that greedily finds the next candidate that leads to the greatest gain in profit while adding a complexity cost constraint. Functional clusters that are too large or too small may be selected at early iterations, causing very poor cluster choices at later iterations due to limited information budget and summary size k constraint. The complexity cost constraint seeks to reduce this effect.
Given graph size |V | and summary size k, the expected cardinality of a functional cluster in the summary is defined by E[|C|] = |Vk | . Size deviation cost, denoted by cC(u) , is defined as the square of the deviation of |C(u)| from E[|C|], ( )2 cC(u) = |V (u)| − |Vk | . Each time a cluster is selected, total profit is reduced by this complexity cost factor. The aforementioned heuristic is realized in this module. The MapProfit store keeps track of the current remaining budget of the nodes in the ppi. Upon finding the best candidate, the MapProfit commits changes to the budget and cost landscape, which will be used in subsequent iterations. The Summary Graph Constructor module: After the summary clusters have been identified, this module computes the association significance between clusters to generate the edges of the summary and construct the final summary graph. The result is then stored in the Summaries data store to allow visualization. Multiple summaries will be generated at varying levels of detail, which will be presented to the user as an ensemble of functional landscapes. Summary Viewer sub-module: Upon successful summary graph construction, this gui sub-module computes the layout and displays the result. The graph visualization module is built on top of the prefuse visualization system [4]. Detailed Viewer sub-module: If the user wishes to drill into the details of the summary, she has various options, including clicking on edges of the summary to reveal the underlying ppi detail. ppi subgraph construction is handled by this module. It provides the graphical view of the underlying protein interaction subgraph of the clusters and their edges as depicted in Figure 4. Here, the nodes from two associated functional clusters and their connectivity are shown. Alternatively, the user may opt to convert the entire summary into the ppi view as shown in Figure 3(b). Here, the ppi view will show the ppi with proteins grouped into their respective functional clusters, as determined by the summary.
4.
DEMONSTRATION OBJECTIVES
fuse is implemented in Scala and Java. Several contextspecific interaction datasets will be provided as case studies (e.g., Alzheimer’s disease network and chromatin network from IntAct [6]). The user will also be able to open files that conform to the psi-mi 2.5 format for summarization. A video of fuse is available at http://www.youtube.com/ watch?v=oFUnMZC6ZOs. Multi-resolution pan and zoom. The key objective
(a) ppi level detail.
(b) High resolution summary. (c) Low resolution summary. Figure 5: Multi-level summaries of the FUSE system.
Figure 4: Subgraph of two functional clusters. of the demonstration is to allow the user to visualize multiresolution functional maps of the underlying ppi network (Figure 5). fuse visualization is designed to be navigated like one would navigate typical mapping tools. Pan and zoom is supported by clicking and dragging the graph and turning the mousewheel, respectively. Multi-level granularities of the ppi functional maps are presented as layers of summaries. The user will be able to zoom in or out between levels of detail by controlling the granularity slider. At the topmost level, the map of broad processes that comprise the network are shown. At the lowest level, the actual ppi itself is presented. Through this demonstration, the users will not only visualize the interaction of higher order clusters in a summary, but also visualize how smaller clusters collapse into larger clusters as the slider is adjusted. The user will be able to double-click on any node to find detailed information. Depending on whether the node is a functional cluster or protein, the corresponding go annotation or UniprotKB page that describes the protein will be displayed, respectively. Right-clicking the node, however, opens a pop-up menu with several options. One of the options allow the user to view the underlying ppi subgraph represented by the functional cluster. This subgraph can also be navigated like any graph visualization. Similarly, right-clicking an edge opens subgraph of the clusters incident to the edge. Users may also select multiple nodes of interest through standard click-and-drag selection. With the shift key, sets of nodes can be selected. The combined ppi subgraph of these nodes can also be viewed. Thus, parts of the summary can be shortlisted for viewing as ppi. Hovering the mouse over a node will reveal its interaction neighborhood. As most navigation tasks can be completed in two clicks or less, the user will be able to explore the web of interactors and their interactions quickly.
Dynamic visualization. We further aid visualization by having a dynamic visualization of the summaries. Here, “uninteresting” parts of the graph can be collapsed, hidden, or disconnected to remove visualization clutter. Interesting parts can be expanded to reveal more detail. The user will first select one or more nodes, then right-click to reveal the pop-up menu. Several modification actions will be available to the user, including actions that hide, collapse, expand, or disconnect these nodes from the rest of the graph. Hide removes selected clusters from the visualization. Collapse simplifies view by combining selected clusters into a single node. Expand reveals sub-clusters or underlying ppi of the cluster within the visualization itself. Finally, disconnect isolates selected clusters by removing all edges going into/from them. For example, consider Figure 5(a). Three functional clusters (the large and small ribosome subunits and the saga complex) contribute to the majority of the dense “hairball” in the center of the ppi graph. Disconnecting these clusters from the rest of the ppi graph creates less cluttered graph for analysis. Search and filter. The user can search for proteins through the search box, filter through the filter box, and hide or show nodes and edges by weight or size factors.
5.
REFERENCES
[1] B. Adamcsek, et al. CFinder: locating cliques and overlapping modules in biological networks. Bioinformatics, 22(8), 2006. [2] G. Bader, C. Hogue. An automated method for finding molecular complexes in large protein interaction networks. BMC Bioinformatics, 27, 2003. ´ si, Z.N. Oltvai. Network biology:understanding [3] A.L. Baraba the cell’s functional organization. Nat. Rev. Genet., 5(2), 2004. [4] J. Heer, K.C. Stuart, A.L. James. Prefuse: a toolkit for interactive information visualization. In CHI, 2005. [5] S. Kerrien, et al. Broadening the horizon–level 2.5 of the HUPO-PSI format for molecular interactions. BMC Biol., 5, 44, 2007. [6] S. Kerrien, et al. IntAct-open source resource for molecular interaction data. Nucleic Acids Res.,35, 2007. [7] T.S. Keshava Prasad, et al. Human Protein Reference Database-2009 update. Nucleic Acids Res.,37, 2009. [8] S. Khuller, et al. The budgeted maximum coverage problem. Information Processing Letters,70(1), 1999. [9] N.J. Krogan, et al. Global landscape of protein complexes in the yeast Saccharomyces cerevisiae. Nature, 440(7084), 2006. [10] S. Navlakha et al. Finding biologically accurate clusterings in hierarchical tree decompositions using the variation of information. J. Comput. Biol.,17(3), 2010. [11] G. Palla et al. Uncovering the overlapping community structure of complex networks in nature and society. Nature,435(7043), 2005. [12] C.G. Rivera et al. Network module identification in Cytoscape. BMC bioinformatics,11(1), 2010. [13] B.S. Seah et al. FUSE: Towards Multi-Level Functional Summarization of Protein Interaction Networks. In ACM-BCB, 2011. [14] N. Wang, et al. CSV: visualizing and mining cohesive subgraphs. In SIGMOD, 2008.