This paper addresses the multimodal nature of so- cial dominance and presents multimodal fusion tech- niques to combine audio and visual nonverbal cues for.
Fusing Audio-Visual Nonverbal Cues to Detect Dominant People in Conversations Oya Aran1 and Daniel Gatica-Perez1,2 Idiap Research Institute, Martigny, Switzerland 2 Ecole Polytechnique Federale de Lausanne (EPFL), Switzerland {oya.aran, gatica}@ idiap.ch 1
Abstract
Despite the multimodal nature of dominance, most of the works on automatic dominance estimation focus on the audio cues, discarding the visual ones [9]. Other works that use visual cues could not show their additional value on top of audio cues. In [6], the authors use both audio and visual cues for dominance estimation. However, the performance of visual cues show no improvement over the best audio cues. This paper addresses the question of fusing audio and visual nonverbal cues to estimate the most dominant person in small group interactions, and shows that one can achieve higher accuracies by combining multimodal cues. We present a new set of audio-visual features that combines audio-visual information at the feature extraction level. We also apply score and rank level fusion techniques for audio-visual fusion. For dominance estimation, we use simple rule based estimators, which do not require labeled training data. We collected a new set of annotations that doubles the size of the dataset used in previous publications [6]. This enlarged dataset gives us more support to interpret and generalize the results. Our experiments show that the visual information is necessary and the highest accuracies can only be achieved by combination of audio and visual cues. In Section 2, we explain the meeting corpus and the dominance annotations. Section 3 describes the automatically extracted nonverbal cues. Section 4 details the dominance estimation and multimodal fusion methods. We present the experimental results in Section 5.
This paper addresses the multimodal nature of social dominance and presents multimodal fusion techniques to combine audio and visual nonverbal cues for dominance estimation in small group conversations. We combine the two modalities both at the feature extraction level and at the classifier level via score and rank level fusion. The classification is done by a simple rulebased estimator. We perform experiments on a new 10hour dataset derived from the popular AMI meeting corpus. We objectively evaluate the performance of each modality and each cue alone and in combination. Our results show that the combination of audio and visual cues is necessary to achieve the best performance.
1. Introduction During a social interaction, humans display dominance via spoken language, most of which is consciously produced. However, besides the spoken words, human interaction also involves nonverbal elements which are extensively used in human communication [7]. As an example, social dominance is exerted through multimodal nonverbal cues including voice, head/hand gestures, body posture, gaze, and expressions. Dominant people are more active, vocally and visually, and use a wider range of motion than nondominant people [5]. The automatic analysis of multimodal nonverbal behavior in social interactions, in particular dominance, is a relatively recent research area [4]. In addition to its contributions to social sciences, the computational analysis of social interactions could enable the development of tools that improve collective decision making, help to keep remote users in the loop in teleconferencing systems, and build tools for self assessment and education.
2. Data and Dominance Tasks Our objective in this work is to study and model dominance in small group conversations using nonverbal audio and visual cues. We use a subset of the Augmented Multi-party Interaction (AMI) corpus [2], where each meeting has four participants, and is recorded with multiple cameras and microphones. 1
Table 1. Number of meetings with full and majority agreement in M1, M2, and jointly.
MD LD
M1 (58) Full Maj 34 56 31 54
M2 (67) Full Maj 33 65 40 63
Joint (125) Full Maj 67 121 71 117
Following the recent work in [6], we define two dominance estimation tasks: Given a meeting, the first task is to estimate the most dominant (MD) person, and the second is to estimate the least dominant (LD) person. To be able to assess our dominance estimation performance and to serve as a ground truth, we collected a set of annotations on a subset of the meetings from the AMI corpus. Previous publications on dominance estimation on AMI data use a set of meetings corresponding to 4.5 hours of recordings [4, 6]. In this paper we use an enlarged dataset, which corresponds to more than 10 hours of recordings, divided into five-minute segments. More information on the dataset can be found in [1]. For each meeting segment, three annotators ranked the participants according to their level of perceived dominance. We then assessed the agreement (full and majority agreement on most and least dominant person) between the annotators for each meeting. The agreement between the annotators for each set is summarized in Table 1. Meeting Set 1 (M1) is the initial set of meetings [6], where annotations are done on a total of 58 five-minute meeting segments. Meeting Set 2 (M2) is the new set with 67 five-minute meeting segments. In this study, we combine the two meeting sets and use the joint dataset in our experiments. For each of the tasks (MD and LD) we report the experimental results on the full agreement (Full) and majority agreement (Maj) datasets obtained from the joint dataset.
frame with a frame rate of 5 fps [3]. Using this information, we use the following cues and extract them for each participant: Total Speaking Length (TSL), Total Speaking Turns (TST), TST without Short Utterances (TSTwoSU), and Total Successful Interruptions (TSI). The definitions of these features can be found in [6]. In addition, we define two new audio features: Average Speaker Turn Duration (AST): This feature calculates the average turn duration per participant. Total Speaker Floor Grabs (TSFG): This feature is calculated as follows: Participant i grabs the floor if i starts talking while there are other people speaking, and all others stop talking before i does. TSFG is similar to TSI with a small difference: In TSFG, the interruptions that affect the whole group are counted.
3.2. Visual activity cues We focus on visual activity, based on the evidence from social psychology that states that dominant people are visually more active [5]. We compute visual activity by processing the close-up camera video data. These cameras capture the face and upper body of each participant. We use compressed domain processing to extract the motion information of skin colored regions [10]. We use the average of the MPEG motion vectors and the residual bit rate, and extract the binary visual activity information, which indicates whether the person is visually active at each time frame, with 25 fps frame rate. Using the visual activity information, we extract the following cues, which are visual counterparts of the audio cues presented above.: Total Visual act. Length (TVL), Total Visual act. Turns (TVT), TVT without Short Movements (TVTwoSM), Average Visual act. Turn Duration (AVT), Total Visual act. Interruptions (TVI), and Total Visual act. Floor Grabs (TVFG). Most of these features are also used in [6].
3. Nonverbal cues
3.3. Audio-visual cues
Social psychology research states that dominance is displayed via audio nonverbal cues such as the speaking time, turns, interruptions, pitch; and visual cues such as visual activity, expressions, gaze [7, 5]. With support from these, we extract the following audio and visual features as descriptors of some of the above cues.
We propose a new set of multimodal features, which represent the audio-visual (AV) activity jointly. We measure the visual activity of the person only while speaking and define the following cues: Total AV Length (TAVL), Total AV Turns (TAVT), TAVT without Short Movements (TAVTwoSM), Average AV Turn Duration (AAVT), Total AV Interruptions (TAVI), and Total AV Floor Grabs (TAVFG).
3.1. Audio Cues We use the audio recordings from the close-talk microphones attached to each participant to extract their speech activity. For each participant, we extract a binary indicator that shows the speaking status at each time
4. Dominance Estimation According to social psychology, dominant people often speak more, move more, or grab the floor more of-
ten, so if someone speaks the most or moves the most, he/she is more likely to be perceived as dominant over the other people in the meeting. Following this information, our assumption is that the nonverbal cues defined above are positively correlated with dominance.
4.1. Baseline model Based on the above assumption, to evaluate the estimation accuracy of each nonverbal cue, we define a rule-based estimator for each cue. To estimate the most dominant person in meeting i, using feature f , we use: M Di = arg max(fpi ), p ∈ {1, 2 . . . P }, p
(1)
where p is the participant number, fpi is the value of feature for that participant in meeting i, and P is the number of participants (P = 4 in our case). The least dominant person is estimated similarly by using arg min.
4.2. Multimodal fusion One disadvantage of the rule-based approach is that it only allows the use of a single feature and can not directly utilize the power of combining multiple features. Although speaking length is a good estimator of dominance, there are other displays of dominance as well, such as the visual activity, which provides complementary information. Thus different cues representing different aspects of dominance could be fused together to obtain a better estimator. In [6], the authors performed feature level fusion and trained a Support Vector Machine (SVM). However, the computational overhead of using a supervised classifier might not be justified. In this study, we propose to use a fusion approach, which uses the simple rule-based estimator, that does not require any labeled training data, to combine the different nonverbal cues. As the rule-based estimator is limited with a single feature, feature level fusion is not possible. Thus, we define a rule-based estimator on each feature as an independent classifier and apply fixed combination rules on the decisions of the classifiers. In the rest of the paper, we use the term “feature combination” to indicate the combinations of the classifiers based on each feature. We propose to use two different architectures: score level and rank level fusion [8]. Score Level Fusion uses the scores of the classifier, which represent the support of the classifier for each class. The scores of each classifier are then combined by simple arithmetic rules such as sum, product, etc. The scores to be combined should be in the same range, so a score normalization should be performed prior to fusion. In our case, we use the actual feature values as
the scores of our classifier as they are positively correlated with dominance. We use z-normalization to normalize the cues for each meeting: fˆpi = (fpi − µf i )/(σf i ), ∀p ∈ 1 . . . P
(2)
where fˆpi and fpi are the values of the feature f for participant p in meeting i, z-normalized and prior to normalization, respectively. µf i and σf i are the mean and the standard deviation over all participants. The score level fusion is then performed by using the median rule. Rank Level Fusion is a direct extension of the rulebased estimator. Instead of selecting the participant with the maximum feature value, we rank the participants and use the rank information to fuse different estimators based on different cues. For meeting i, using feature combination C, we sum up the ranks for each participant and select the one with the highest total rank: ∑ RiC = arg max( rfi p ), C ⊆ F, (3) p
f ∈C
where rfi p is the rank of participant p using feature f in meeting i, and F is the set of all features. In case of ties, we select based on the z-normalized scores.
5. Experiments We performed experiments on Full and Maj datasets for MD and LD tasks using the rule-based estimator and multimodal fusion. We assumed that the estimation is correct if it matches the agreement. If there is a tie, and one of the tied results is correct, we assign a weight, which is the reciprocal of the number of ties.
5.1. Results with single features The classification accuracies for each single nonverbal feature is shown in Table 2. The best accuracy for each feature set (audio, visual, and audio-visual) is shown in bold-italic. The best accuracy for each task is shown in bold. The results show that visual cues alone, are not good estimators of dominance; however the audio-visual cues may perform better than the audio alone cues. For the MD task, the best results are obtained with TSL (85.07% and 74.38%) and for the LD task, with TAVL (85.92%) and TSTwoSU (70.94%), on Full and Maj datasets respectively.
5.2. Results with multimodal fusion We perform an exhaustive search to find the best combination of nonverbal cues. The classification accuracies are shown in Table 3. The results show that
Table 3. Best results (%) with multimodal fusion for MD and LD tasks on Full and Maj datasets. LD MD
Rank Level Full Maj Full Maj
88.06 76.86 90.14 78.63
Score Level
TSL, TSFG, TVL TSL, TSTwoSU, TSI, TVL, TVI, TAVT AST, TAVT, TAVFG TST, TSTwoSU, TVFG, TAVT, TAVTwoSM, TAVFG
Table 2. Results (%) with single cues.
Audio-Visual
Visual
Audio
MD TSL TST AST TSTwoSU TSFG TSI TVL TVT AVT TVTwoSM TVFG TVI TAVL TAVT AAVT TAVTwoSM TAVFG TAVI
Full 85.07 58.96 74.63 73.88 53.73 59.70 74.63 53.73 74.63 72.89 52.24 42.54 80.60 82.09 50.75 75.62 55.22 13.18
LD Maj 74.38 51.65 64.46 65.29 50.69 52.07 67.36 50.00 66.12 65.56 53.03 45.32 69.42 69.42 50.41 66.25 52.75 13.36
Full 78.87 71.83 69.01 80.28 62.21 61.97 59.15 61.27 67.61 59.15 50.00 47.65 85.92 82.39 56.34 65.26 72.07 14.79
Maj 65.81 61.54 58.97 70.94 56.84 57.12 52.14 49.57 60.68 46.58 45.01 41.17 68.38 67.52 40.17 53.42 61.40 13.68
88.06 77.69 91.55 77.78
TSL, TSFG, TVT, AVT TSL, AST, TSTwoSU, TSI, TVFG, TVI TST, TSTwoSU, TVI, TAVT, TAVTwoSM, TAVFG TST, TSTwoSU, AVT, TVFG, TAVL, TAVFG
Best Single 85.07 TSL 74.38 TSL 85.92 TAVL 70.94 TSTwoSU
versations. Visual information is complementary to audio, and multimodal fusion is needed to achieve better performance. We conducted our experiments on a novel dataset which enables the generalization of our results. When we compare our results with the previous results on the smaller AMI dataset [6], we see that two properties are preserved: First, the same cues perform consistently better than others, and second, the combinations selected by the fusion techniques show some similarities. This suggests that the selected cues are consistent indicators of dominance in our data. This work is supported by EU FP7 MC IEF project Automatic Analysis of Group Conversations via Visual Cues in Non-Verbal Communication (NOVICOM).
References
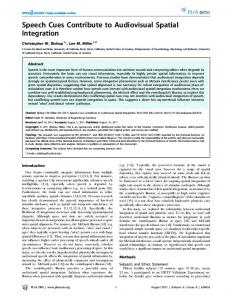
Figure 1. Most commonly chosen cues. we can achieve higher accuracies (~3% increase on MD task and ~7% on LD task) using rank or score level fusion in all tasks, in all datasets. Although we present one combination for each task, there is more than one combination that gives the highest result. In Figure 1, we show the percentage of times that a feature is selected in a combination that gives the highest result in the MD task. We see that the features frequently selected by rank and score level fusion show similar characteristics. When we further investigate the combinations, we see that the highest results are always audiovisual combinations and there is not one single combination that combines cues only from a single modality.
6. Conclusions In this paper we showed the importance of visual nonverbal cues for dominance estimation in group con-
[1] O. Aran, H. Hung, and D. Gatica-Perez. A multimodal corpus for studying dominance in small group conversations. In Proc. LREC workshop on Multimodal Corpora, Malta 2010. [2] J. Carletta et al. The AMI meeting corpus: A preannouncement. In Proc. MLMI, Edinburgh, 2005. [3] J. Dines. The segmentation of multichannel meeting recordings for automatic speech recognition. In Interspeech, 2006. [4] D. Gatica-Perez. Automatic nonverbal analysis of social interaction in small groups: A review. Image and Vision Computing, 27(12):1775–1787, 2009. [5] J.A. Hall, E.J. Coats, L.S. LeBeau. Nonverbal behavior and the vertical dimension of social relations: A metaanalysis. Psychological Bulletin, 1313(6):898–924,2005. [6] D. B. Jayagopi, H. Hung, C. Yeo, and D. Gatica-Perez. Modeling dominance in group conversations from nonverbal activity cues. IEEE Trans. on Audio, Speech, and Language Processing,, 17(3):501–513, 2009. [7] M. L. Knapp and J. A. Hall. Nonverbal Communication in Human Interaction. Wadsworth Pub., 7th Ed., 2009. [8] L. I. Kuncheva. Combining Pattern Classifiers: Methods and Algorithms. Wiley, 2004. [9] R. Rienks and D. Heylen. Dominance detection in meetings using easily obtainable features. In Proc. MLMI, Edinburgh, 2005. [10] C. Yeo, P. Ahammad, K. Ramchandran, and S. Sastry. High-speed action recognition and localization in compressed domain videos. IEEE Trans. on Circuits and Systems for Video Technology, 18(8):1006–1015, 2008.