Fuzzy-based Sensor Search in the Web of Things ∗ Cuong
Truong, ∗ Kay R¨omer, † Kai Chen
Institute of Computer Engineering, University of L¨ubeck, Germany ∗ {truong, roemer}@iti.uni-luebeck.de †
[email protected]
Abstract—An increasing number of sensors is being connected to the Internet and their output is published on the Web, resulting in the formation of a Web of Things (WoT) that will soon connect tens of Billions of devices. As in the traditional web, search will be a key service also in the WoT to enable users to find sensors with certain properties. We propose sensor similarity search, where given a sensor, other sensors on the WoT are found that produced similar output in the past. At the heart of our approach is an algorithm that exploits fuzzy sets for efficiently computing a similarity score for a pair of sensors that is used to obtain a ranked list of matching sensors. Using sensor data sets from real deployments, we find that this approach results in a high accuracy.
I. I NTRODUCTION A steadily increasing number of sensors worn by people (e.g., contained in mobile phones), embedded into the environment (e.g., sensor networks), and into objects (e.g., smart objects and appliances) are being connected to the Internet. This trend is leading to the formation of an Internet of Things (IoT) that is expected to interconnect Billions of devices by 2020 [1]. By publishing the resulting sensor data streams in the Web, novel real-world applications can be created by mashing up sensors and actuators with services and data available on the Web, leading to a Web of Things [2]. As in the traditional web, search will be a key service also in the WoT to enable users to find sensors with certain properties. Existing directories of online sensors such as Pachube1 , GSN [3], or Microsoft SensorMap [4] support search for sensors based on textual metadata that describes the sensors (e.g., type and location of a sensor, measurement unit, object to which the sensor is attached) and which is manually entered by the person deploying the sensor. Other users can then search for sensors with certain metadata by entering appropriate keywords. Unfortunately, this approach does not work well in practice, as humans make mistakes when entering metadata, different users use different terms to describe the same concept, or important metadata is not entered at all. For example, in [5] a user study is described where 20 participants were asked to enter metadata for a weather station sensor using a simple user interface. Those 20 persons made 45 mistakes in total. There are several approaches to address this problem. Firstly, some metadata of a sensor such as sensor type can be stored on the sensor during production using so-called Transducer Electronic Data Sheets (TEDS) as defined by IEEE 1 https://pachube.com/
1451, for example. However, most of the relevant metadata of a sensor depends on the deployment and use of the sensor (e.g., logical location of the sensor, object to which the sensor is attached) and cannot be provided by the producer of a sensor. Secondly, there are efforts to provide a standardized vocabulary to describe sensors such as SensorML or the Semantic Sensor Network Ontology (SSN). Unfortunately, these ontologies and their use are rather complex and end users likely won’t be able to provide correct descriptions of sensors and their deployment context without help from experts. Note that the same problem also applies to search for multimedia items on the web such as images and videos, which typically can only be found if appropriate textual descriptions are provided by users. One interesting alternative approach that avoids the use of metadata altogether is searching by example. For example, Google Images includes an option to find images that are similar to another image. There are even specialized search engines such as TinEye2 which find images that are similar to a given image. In this paper we adopt this search-by-example approach to sensors, i.e., a user provides a sensor, respectively a fraction of its past output as an example, and requests sensors that produced similar output in the past. We call this sensor similarity search service. This service could be used for different purposes. Firstly, it could be used to find places with similar physical properties. For example, if one wants to find places that have similar climatic conditions as a known place A, one could pick a temperature sensor that is known to be at place A, and then search for other temperature sensors with similar output. Secondly, it could be used to assist users with the formulation of a metadata description of a newly deployed sensor. A user would deploy a new sensor and then search for sensors with similar output, fetch the metadata of the found sensors, and reuse appropriate fractions of the metadata for the new sensor. The contribution of this paper is four-fold: (i) we propose sensor similarity search for the Web of Things and present an architecture to realize this service; (ii) we design a lightweight, efficient sensor comparison algorithm based on fuzzy logic that forms the heart of sensor similarity search; (iii) we evaluate our approach using data sets from three realworld deployments and find that our approach has a high accuracy and is computationally efficient; and (iv) we present a prototype implementation of our approach. 2 www.tineye.com
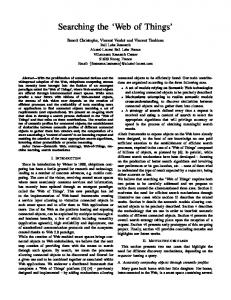
The motivation for using fuzzy logic is two-fold: firstly, fuzzy logic naturally addresses the uncertainty and noisy nature of sensor data and yet provides a robust way to assess the similarity of sensor output. Secondly, traditional approaches for comparing sensor data streams are too heavyweight for resource-constrained sensor nodes either in terms of computation (e.g., performing a spectral analysis of sensor data using FFT is not possible on low-power micro-controllers used on sensor nodes) or in terms of communication (sending raw data streams over wireless may not be feasible). In the remainder of the paper we explain the sensor similarity search architecture, discuss related work, describe how fuzzy sets are extracted from sensor data, how similarity scores are computed, evaluate our work using data sets obtained from real sensors, and finally demonstrate a prototype running setup of our work. II. R EQUIREMENTS AND A RCHITECTURE As we aim to apply sensor similarity search to the Internet of Things, the approach should be scalable to many sensors. This implies that the comparison of two sensors in order to decide if they are similar should be efficient. In particular, as many sensors have limited power supply, communication overhead with sensors should be minimized, which implies that sensors should compute a compact summary of their past output data that can be downloaded from the sensors with little communication overhead and indexed by a search engine. Further, the comparison of the output of a sensor with those indexed summary data structures should be efficient such that search results are returned quickly to the user. Finally, this comparison function should be flexible such that sensors can be found that show similar trends in their output despite differences in the actual output time series. In this paper we focus on developing an efficient sensor comparison algorithm that meets the above requirements. Fig. 1 illustrates our proposed architecture, where lowpower sensor nodes are connected to the Internet via gateways. We encode the output of a sensor over a long time period by a fuzzy set which is computed by the sensor itself. Periodically the search engine crawls sensors to download and index those fuzzy sets in a distributed database system in the Internet. Each fuzzy set has a memory footprint of few tens of bytes and can thus be efficiently downloaded from the sensors. To perform a search, the user specifies a time series of sensor values. This time series is compared to the indexed fuzzy sets and a similarity score is computed for each indexed sensor. The sensors with the highest similarity scores are presented to the user sorted by decreasing similarity score. III. R ELATED W ORK In this section we put our contribution into the context of work that is concerned with search for sensors and similarity of sensors. We structure the discussion of related work according to their design goal and their approach in comparing two different streams of sensor data.
S2 S4
crawls crawls
S1
crawls
S3 Internet
S1 S4 S3 S2
score : 1.0 score : 0.8 score : 0.5 score : 0.2
User
search for:
Fig. 1: Architecture of sensor similarity search.
A. Search based on Metadata In the context of the IoT, a number of systems support search for sensors based on metadata, for example Pachube3 , GSN [3], or Microsoft SensorMap [4]. Our approach is complementary as it does not rely on metadata, but searches for sensors with similar output. However, similarity search could be integrated with search based on metadata, e.g., performing similarity search only for sensors with certain metadata, or first searching sensors based on metadata, and then searching for sensors similar to some of the found sensors. In [6], the authors propose a systematic design for a search application in the Web of Things. Their design is based on clustering of sensors with similar semantic descriptions. Again, our work is different as it aims to provide a fundamental service that determines if two sensors are similar based on their output data. Content-Based Sensor Search Content-based sensor search refers to the problem of finding a sensor that outputs a given value at the time of a query and is investigated in [7] and [8]. The key idea is to exploit the periodicities in sensor output (e.g., a meeting room is occupied every Monday from 8 to 10), or correlations between sensors (e.g., parking spots close to the entrance of a building are often all occupied, whereas spots further away are often free) to build prediction models that predict which sensors would output the sought value at the time of the query. However, in the present paper we investigate the statistical similarity of sensors over a longer time window, which is a fundamentally different problem. B. Similarity of Data Streams Computing a similarity score of two data streams is a fundamental problem that has been studied in different contexts. In traditional multimedia systems, similarity of audio data, images, and video streams is considered (e.g., [9], [10]). However, these methods are often not tailored to scalar sensors and their resource footprint typically exceeds the capability of low-power sensor networks by far. The work in [11] aims at identifying similarities between data streams generated by neighbouring nodes in a sensor 3 https://pachube.com/
networks so that the streams can be aggregated to save bandwidth. A data stream is divided into multiple chunks and these chunks are compared against the chunks of another data stream to find similarities using the Jaccard similarity function. Our goal is, however, different as we do not seek for similar parts of two data streams, but we want to determine if the two entire streams are similar by using the fuzzy set representation of sensor data. The authors in [12] address clustering of data streams in general based on their similarity by developing an online version of the K-means algorithm which involves discrete Fourier transform and pairwise distance computation of data streams on-the-fly. Compared to our approach, this technique is clearly more resource-demanding, in particular with respect to computation overhead. The work in [13] focuses on sensor data streams and clusters sensors based on the similarity between their outputs. Their approach has a high memory footprint as all sensor measurements need to be stored either at a central processing point or at sensors, while we need to store only a much more lightweight fuzzy set. Further, similarity computation using correlation coefficients is costly when compared to our approach. Their computation also requires two measurement sets to have the same number of samples while ours does not. [14] and [15] explore secure pairing devices if their sensors obtain similar output data (e.g., two objects shaken together would experience similar acceleration patterns). The technique used to compute similarity of sensor output is based on a coherence function to measure the correlation in the frequency domain between data streams. This requires that sensor exchange raw data streams, while with our approach only compact fuzzy sets are required. While the above approaches investigate the computation of the similarity of sensor output, their overall aim is different. None of the above techniques addresses sensor similarity search in the Web of Things as we do. In a previous workshop paper [16], we outlined the basic approach of sensor similarity search. The present conference paper substantially extends [16] by considering temporal aspects of sensor similarity, be adding a broader and more detailed evaluation, and by describing a prototype implementation. IV. C OMPARING S ENSORS In this section, we propose a method based on fuzzy sets to compute a similarity score for a pair of sensors based on their output. A fuzzy set [17] is an extension of a crisp set which allows partial membership rather than only binary membership. A fuzzy set F on a universe of discourse U is defined by its membership function µF (x), x ∈ U such that µF (x) ∈ [0, 1]. The closer the value of this function is to one for a given x, the more x belongs to the fuzzy set F . With this definition, an element x ∈ U can be a member of more than one fuzzy set at a time, with different degrees of membership. A. Approach Fig. 2 illustrates our approach. We have the output measurements of two sensors located in two locations kitchen
light 1
meeting room kitchen
light
0,75
0,25
sensor readings
0
time
X
time
Fig. 2: Fuzzy-based sensor similarity computation. S
10
20
V
15
S 25
δ(S,V) = (15-10) + (25-20) = 10
10
V
11
20 21
δ(S,V) = (11-10) + (21-20) = 2
Fig. 3: Sensor range difference.
and meeting room. Suppose that for each sensor we have built a fuzzy set from its measurements, i.e., we have Fkitchen = {(x, µkitchen (x))|x ∈ R} and Fmeeting room = {(x, µmeeting room (x))|x ∈ R}. Note that we assume the set of real numbers R as the universe of discourse to represent scalar measurements of sensors. For the sake of illustration we assume the shape of the membership functions is a triangle. Now given a set of measurements US ⊂ R of a third sensor S, we want to compute scores of the similarity of S with the sensor in the kitchen and the sensor in the meeting room. If we pick a sample measurement x ∈ US , the membership functions of Fkitchen and Fmeeting room will tell us the degree of membership of x in the two fuzzy sets, which is µmeeting room (x) = 0.75 > 0.25 = µkitchen (x). We therefore say that the value x is more likely read by the sensor located in the meeting room. Based on this approach, we define the similarity score of the sensor S with respect to a sensor V as ΦS (V ) =
1 1 X µV (x) δ(S, V ) |US |
(1)
x∈US
We call δ(S, V ) the sensor range difference between two sensors S and V that is given by δ(S, V ) = |q1S − q1V | + |q3S − q3V |
(2)
where q1S , q3S ∈ US and q1V , q3V ∈ UV are the first and third quartiles of the measurement sets of sensors S and V , respectively. The quartiles of a set of ordered values are the three points that divide the set into four equal groups, each representing a fourth of the population of the values. To obtain the quartiles of the set of measurements of a sensor S, we first sort the measurement values in decreasing order. The first quartile of US , denoted by q1S , is the maximum among the smallest 25% of measurements of US . The second quartile, or also called median, is the value that cuts US in half, i.e., 50% of the measurements of US are smaller than this value. The third quartile, denoted by q3S , is the minimum among the largest 25% of measurements of US . The use of the quartiles makes sure that influence of outliers is eliminated because outlier measurements would be located outside the interquartile range [q1S , q3S ].
a)
S 3 2 1 1
2
3
4
5
6
V
7
2
1
2
1
3
2
3
4
5
6
7
3
4
5
μS, μV
1
1 1
2
2
2
1
V
1
V
3
2
S
3
9
reordering of V
3
Fig. 4: Fuzzy set construction.
8
b)
μV, μS 4 3 2 1
1
2
3
4
5
6
1
7
2
3
Fig. 5: The re-ordering effect. We call [q1S , q3S ] and [q1V , q3V ] the sensor ranges of sensor S and V . Fig. 3 shows an example for sensor ranges of two sensors S and V . The small overlap in the left between the two ranges implies a large δ(S, V ), whereas the big overlap in the right implies a small δ(S, V ). The aim of the sensor range difference is two fold: (i) to quickly rule out sensors of different types or sensors monitoring different objects/environments because those sensors would produce very different ranges of measurement values; and (ii) if there is no clear distinction between sensors (types, or monitored objects), then sensors that produce measurement values within the same or very close ranges would have highest similarity scores. Thus, prior to examining the structure of the measurement curve of sensors, a potentially large number of sensors are already ruled out to narrow down the search space. In summary, the similarity score is the higher, the more the measurement ranges overlap and the more the measurements of sensor S belong to the fuzzy set defined by the output of sensor V . Note that the similarity score of sensors with disjoint measurement ranges is zero. B. Fuzzy Set Construction We will elaborate in this subsection how a fuzzy set is constructed from a given set of sensor measurements. Consider Fig. 4. The left image shows the time series of measurements of a temperature sensor S over a time period ∆t, and the graph in the middle shows the constructed fuzzy set. We denote FS as the constructed fuzzy set and US as the set of measurements of S. We want to find a membership function µS (x) that represents the series of measurements of the sensor over time. We denote xSmin and xSmax ∈ US the minimum and maximum values among the measurements of sensor S, respectively. Considering an interval ∆x = [x − r, x + r] ⊂ [xSmin , xSmax ] for r > 0, we are interested in how many measurements x ∈ US fall into [x − r, x + r] over ∆t because this captures the behaviour of the object that our sensor is measuring: does temperature tend to be within the range ∆x? Put in another way, the density of the population of sensor measurements in ∆x describes the likelihood of temperature to be within ∆x. By letting r → 0 and by sliding ∆x over [xSmin , xSmax ] we can calculate the likelihood for each temperature value x in the measurement range. µS (x) is then defined as this likelihood of x ∈[xSmin , xSmax ]. The work in [18] presents a way to compute how densely a data point is surrounded by other data points in close proximity. We borrow this idea to compute the density of sensor measurements within an interval [x − r, x + r] around
a measurement value x, and call it the neighbour density of x: S
ndg (x) =
X
e
−
h
2dE (x,y) r
i2
(3)
y∈US
where dE (x, y) is Euclidean distance between two values x and y. Due to the exponential function, measurement values which are outside of [x − r, x + r] have little influence on ndg(x). Note that the measurement values of a sensor S can be represented as a discrete function of time S(ti ), i = 0..|US |, thus Eq. 3 can be rewritten as: |US | S
ndg (x) =
X
e
−
h
2dE (x,S(ti )) r
i2
(4)
i=1
We then normalize ndg S (x) to values between 0 and 1 using min-max normalization. µS (x) is then defined as the normalized version of ndg S (x). We call this membership function the neighbour density function. The obtained fuzzy set is FS = {(x, µS (x))|x ∈ US }. For a visual explanation of our approach, consider Fig. 4 again, which shows the neighbour density function of the temperature sensor in the middle. The peak in region “2M” results from a dense distribution of measurements within region “2L”, while the low values in region “1M” are explained by a sparse distribution of measurements within region “1L”. C. Injective Mapping Problem Although the neighbour density function in Eq. 4 is able to represent the series of measurements of a sensor S over time by a compact fuzzy set, it does not guarantee an injective mapping between the series of measurements and the computed fuzzy set. This issue may lead to exceptional cases where two dissimilar sensors are considered similar due to them having the same computed fuzzy set. We observe that by reordering measurement values of a sensor on the time axis, one will obtain the same fuzzy set. Some of these reorderings will probably not appear in reality because the resulting measurement curve would have “jumps” which do not reflect real-world phenomena as they are typically “smooth”, i.e., they do not suddenly change from one state to another distant state but do gradually change between close states. For example, the temperature within an office typically does not suddenly jump from 18 to 50 degree Celsius. Such “jumps” often indicate some fault (e.g., physical damage,
battery depletion, etc). Fig. 5-a illustrates this effect where a reordering in the measurement values of sensor V results in an identical fuzzy set to the computed fuzzy set of sensor S. However, there are reorderings that preserve smoothness therefore they may very well occur in practice, e.g., by flipping the sensor measurement curve over a line parallel to the yaxis. Fig. 5-b illustrates this, where the measurement curves of sensor S and V look different but one of them could be obtained by flipping the other over the line x = 3. The resulting fuzzy sets of the two sensors are identical. However, reordering the measurement values on the time axis typically changes the discrete derivative S 0 (t). Motivated by this fact, we propose to incorporate information about the discrete derivative into the construction of the fuzzy set to deal with the reordering effect. )−S(ti ) as the discrete derivative We define S 0 (ti ) = S(ti+1 ti+1 −ti of S at ti . We then denote US 0 = {x0 = S 0 (ti )|i = 1..|US |−1} as the set of discrete derivatives of S. The fuzzy set of the discrete derivatives of S can be obtained using Eq. 4, and is denoted as FS 0 = {(x0 , µS 0 (x0 ))|x0 ∈ US 0 }, where each 0 µS 0 (x0 ) is the min-max normalized value of ndg S (x0 ). We redefine the similarity score of the sensor S with respect to a sensor V in Eq. 1 as ΦS (V ) =
|US | 1 1 X µV (S(ti )) × µV 0 (S 0 (ti )) δ(S, V ) |US | i=1
(5)
Eq. 5 says that the more the measurements and discrete derivatives of sensor S belong to the fuzzy sets FV and FV 0 of sensor V , respectively, the higher is the similarity score. In the language of fuzzy logic, this is equivalent to the “and”operator [17]. In summary, our proposal helps mitigate the reordering effect because of the following two reasons: • For the same set of measurements, any reordering would generate different discrete derivative, thus resulting in different derivative fuzzy sets and in different similarity scores. • For any two different sets of measurements that have the same discrete derivative, the resulting value fuzzy sets and similarity scores from Eq. 5 would be different. There is, however, an exceptional case in which Eq. 5 produces the same similarity score even though the two sets of measurements as well as the two corresponding discrete derivatives are different. Considering two sensors S and V , this case happens if and only if US = UV 0 and UV = US 0 due to commutative property of the multiplication in Eq. 5. In reality, however, it is extremely unlikely that both US = UV 0 and UV = US 0 hold true at the same time. Thus, we have an effective heuristic approach for an injective mapping of sensor time series to a pair of fuzzy sets. D. Fuzzy Set Approximation Since the storage overhead for a fuzzy set is proportional to the size of the measurement range of the sensor, it may be expensive to store a fuzzy rule, or more specifically the fuzzy set and its membership function. Furthermore, this cost
is multiplied by the number of sensors which is expected to be large in the IoT vision. To reduce storage overhead, we propose to represent the neighbour density function by a set of line segments that approximate the curve of the function. An illustration is given in Fig. 4, where in the middle we have the neighbour density function whose linear approximation is shown in the right side of the figure. To approximate the membership function µS (x) of a sensor S, we first define a derivation threshold dth , compute µS (x)’s first derivative d1 at x1 (x1 is the second smallest value in the measurement range of S), and mark the point A1 := (x1 , µS (x1 )). We then iterate over points (xi , µS (xi )) on the curve and compute µS (x)’s first derivative di , until di − d1 > dth . We assign x2 := xi , A2 := (x2 , µS (x2 )), and store the line A1 A2 as the approximation of µS (x) for the interval [x1 , x2 ]. After that, we assign A1 := A2 and d1 := di , and continue to iterate over points on the curve in the same fashion until we reach the point (xSmax , µS (xSmax )). The resulting set of line segments is the desired approximation of µS (x). Due to the exponential weighting of distances in equation 3, fuzzy sets typically have a smooth curve and can be represented by few line segments. As each line segment (except the first one) can be defined by two integer values, the memory footprint of the fuzzy set is small and typically in the order of few tens of bytes. With the construction and approximation of fuzzy sets from sensor data, comparison between a pair of sensors is efficient as it requires only linear computation, and takes in the order of few tens of microseconds even when implemented in Java (see Sect. V-D). V. E VALUATION In this section we evaluate the performance of our sensor similarity search. As a result of searching for a given sensor, a list of sensors ranked by decreasing similarity score is obtained. Similar sensors should be ranked highly (i.e., on top of the list), while dissimilar sensors should be ranked low (i.e., at the bottom of the list). Unfortunately, “similar” is highly subjective and depends on the perception of the user. One user may consider two sensors to be similar, while another user may not. Hence, it is difficult to obtain a ground truth for evaluation. To resolve this issue, we manually group sensors based on their location as nearby sensors should produce similar output if the measured physical quantity has a low spatial variation. For example, all temperature sensors in a room should produce similar output and may thus form a group. This way, we obtain groups of sensors G1 , G2 , .... We now pick a sensor s from a group Gi and search for similar sensors. We would expect that all sensors from the same group Gi are ranked highest. However, the result may be imperfect, i.e., sensors from Gi might be ranked lower than sensors from other groups. Therefore, we need a metric to quantify the accuracy of a rank list, which we describe next before we present the evaluation setup and results.
L1
DOA=0
L2
DOA=0.6
L3
DOA=0.63
L4
DOA=1
Fig. 6: Illustration of the DOA metric. Fig. 7: Grouping in NOAA and IntelLab data sets. A. Degree of Ranking Accuracy Figure 6 shows possible rank lists obtained as a result when searching for a sensor s from a group Gi . The check marks indicate matching sensors, i.e., sensors from the same group Gi , while crosses indicate non-matching sensor from other groups. The best possible result is list L4 as all matching sensors are ranked highest. The worst result is list L1 . We now define a metric that maps a rank list to a scalar value between 0 (worst result) and 1 (best result). For each matching sensor, we compute the ranking error, i.e., the number of nonmatching sensors ranked higher. We then compute the average ranking error of all matching sensors, which equals 0 in the best case, and equals the number of non-matching sensors in the worst case. To normalize to the interval [0, 1], we divide by the number of non-matching sensors. By subtracting the resulting value from 1, we obtain the desired metric. Thus, we define the degree of ranking accuracy (DOA) of a rank list L as follows: DOA(L) = 1 −
1 CL (NL − CL )
×
NL X
eL (i)
(6)
i=1
where NL is the length of rank list L, CL is the number of matching sensors in L, and eL (i) is the ranking error of a matching sensor at rank i, i.e., the number of non-matching sensors ranking higher than i. If i is a non-matching sensor, then eL (i) := 0. Fig. 6 shows the value of the metric for different rank lists. B. Experiment Setup To evaluate our similarity search, we implement a simulation tool in Java that is able to replay recorded measurements of multiple sensors, execute search operations over these sensors, and compute the resulting ranking accuracy according to the above metric. We use three data sets with recorded sensor values from real-world deployments for the evaluation. As described earlier, we group sensors in each of the data sets based on their location, such that sensors in a group should observe similar (but not identical) output. The first is the NOAA data set4 which contains the output of sensors monitoring ocean and atmosphere (e.g., barometric pressure, wind speed, air temperature, conductivity, water velocity) that are deployed along the coast lines of various places in North America. We use 23 barometric-pressure sensors from
Fig. 8: Grouping in MavHome data set and Working prototype.
this data set and group them into 5 groups, namely Alaska (3 sensors), West-Coast, Great-Lakes, East-Coast, and Hawaii (5 sensors each) as shown in Fig. 7-left. The second is the IntelLab data set5 which contains recorded measurements of sensor nodes equipped with four different sensors, namely temperature, light, battery voltage, and humidity. These sensors were deployed in the Intel Berkeley Research Lab between February 28th and April 5th, 2004. We select a set of 12 humidity sensors and group them into three groups, namely Lecture-Hall (4 sensors), Dining-Room (4 sensors), and Meeting-Room (4 sensors) as shown in Fig. 7-right. The third is the MavHome SmartHome sensor data set6 that contains recorded measurements of sensors monitoring daily living activities of people at home. The sensor types include light, humidity, heat, and motion sensors. The data set was recorded from January 3 to February 2, 2005. We select a set of 8 light sensors and group them into 2 groups based on their location: “Living-Room” (5 sensors) and “Bedroom” (3 sensors) (see Fig. 8-left). To perform the evaluation, we sequentially pick one sensor after another from each of the two test sets, search for sensors similar to that one, obtain a rank list, and compute the DOA value. We call this series of operations a search trial. For each sensor, we use the last 24 hours of data which is representative as the data tends to repeat every day. This approximately equals 1500, 200, and 500 data points in the IntelLab, NOAA, and MavHome data sets, respectively. Note that – as outlined in Fig. 1 – the search engine periodically crawls sensors for updating the fuzzy rule database. Thus, we perform the evaluation described in the above paragraphs for 20 days. During these days, fuzzy rules are periodically updated once per day while search queries arrive at the 5 http://db.csail.mit.edu/labdata/labdata.html
4 http://tidesandcurrents.noaa.gov/gmap3
6 http://ailab.wsu.edu/mavhome/index.html
Fig. 9: Average degree of accuracy (NOAA).
Fig. 10: Average degree of accuracy (IntelLab).
gateway randomly at any time of a day. C. Accuracy Fig. 9, Fig. 10, and Fig. 11 show the resulting average DOA values when searching for each of the sensors in the NOAA, IntelLab, and MavHome data sets over the course of 20 days, respectively. Also, a box plot aggregating the results is shown next to each figure. As observed in the figures, our sensor similarity search obtains a high degree of accuracy as the average DOA is above 0.97 for NOAA and MavHome data sets, and above 0.94 for IntelLab data set. The boxplots show a stable performance of our approach with a small inter-quartile range, i.e., 0.025 for the NOAA data set, 0.083 for the IntelLab data set, and 0.0 for the MavHome data set. There are, however, a few outliers such as search trials number 22 and 23 in Fig. 9, and number 4 in Fig. 10. The reason for this is that environmental conditions change over time, and even though sensors in each group are deployed
Fig. 11: Average degree of accuracy (MavHome).
Fig. 12: Best case and worst case (IntelLab).
close to each other, they may experience significant variations due to micro-climates (in the NOAA data set) or due to sensors being close to the heating or air conditioner (in the IntelLab data set). To further investigate how environmental conditions affect performance, worst case and best case performance are included in Fig. 12 for the IntelLab data set. Our mechanism performs the best (100% accuracy) when there are clear climate differences among the regions, and performs worst when (micro)climate conditions are similar among different regions. For example, the Intel Lab is an indoor environment with no clear boundary between regions, therefore humidity in the meeting room and the lecture hall is sometimes very similar, thus causing a low degree of accuracy. The light usage in a smart home, however, does not only depend on environmental conditions but on habits of the people living in the house, which differs clearly between living room and bedroom. This explains why evaluation of MavHome data set results in the highest accuracy among the three data sets (see Fig. 11). D. Performance and Scalability We investigate the time needed to compute a similarity score for a pair of sensors as this is the fundamental operation performed by the search engine. We use the approach in [19] to minimize the impact of garbage collection and justin-time compilation in the Java VM on computation time measurement. For a similarity score computation, we obtained an average computation time of 222µs for the IntelLab data set, 28µs for NOAA, and 70µs for MavHome. The difference stems from the fact that the number of measurements per day in NOAA (200) and MavHome (500) is much smaller than for the IntelLab data set (1500). That is, we can compare against 4505 to 35714 sensors per second. The computer used in our experiment has an Intel Core i5 CPU that runs at a clock rate of 2.4Ghz. It is worth noting that, even though the number of measurements per day of NOAA and MavHome sensors is much smaller than that of IntelLab sensors, the accuracy is high for all three data sets as can be seen in Figs. 9, 10, and 11. This can be exploited to reduce the computation overhead by incrementally computing similarity score of increasing accuracy. As a search request arrives, we first compute an approximate similarity score according to Eq. 5 for a small subset of the measurements US of the given sensor, for example, by only using every 10th sample from the time series. In a second pass, more samples are added, say every 5th sample, and so on. This way, a first approximate search result can be very quickly presented to the user which is continuously refined the longer the user waits. We applied this approach to the IntelLab data set by computing the similarity score on a subset of the date that contains only every 6th sample, (i.e., 250 data points per day). This results in exactly the same DOA as the DOA obtained
for the full set of 1500 data points per day, but reduces the computation overhead to one sixth. Finally, please note that similarity search can be efficiently parallelized on a cluster of computers (as used by many Internet search companies) by partitioning the set of sensors, respectively their indexed fuzzy sets, and distributing them to the computers in the cluster. VI. P ROTOTYPE To further support experimentation with our approach in realistic environment, we implemented a prototype on an experimental facility developed within the WISEBED project7 . The facility consists of a projector mounted on top of a table that projects a video of a smart home onto the table. Using ray-tracing techniques, a simulation engine renders the interior of a house including realistic illumination from the moving sun shining through windows and artificial lighting. Sensor nodes with light sensors are placed in the projected rooms that sense the illumination as they simulated day goes by and form a wireless mesh network. Fig. 8-right shows a photo of the prototype with two project rooms, namely “Library” (the region at top left of the photo) and “Meeting Room” (the region at bottom right of the photo), and four sensor nodes, two of them placed in the library, and other two in the meeting room. The projected plots next to the sensors show the recorded data from the light sensors. The sensor nodes compute fuzzy sets as described earlier in the paper and periodically send them to the gateway computer where they are indexed. The user can then pose a query to find sensors that are similar to a given sensor. In the experiment shown in Fig. 8-right, we annotate sensors with their room, i.e., two sensors (ID:70d5 and ID:7061) are annotated with “Library”, and one sensor (ID:7115) is annotated with “Meeting Room”. Now we deploy another sensor in the meeting room (ID:71fa) and search for similar sensors. As expected, the resulting rank list contains the other sensor in the meeting room (ID:7115) on top. VII. C ONCLUSION AND O UTLOOK We are witnessing the formation of a Web of Things, where the output of sensors connected to the Internet is published and mashed up with data and services on the Web to create novel real-world applications. A fundamental service in the resulting Web of Things is search for sensors. Instead of relying on manual annotations (which are often incorrect, inconsistent, or incomplete), we propose sensor similarity search, where based on the past output of a sensor, sensors with similar output are found. We designed an efficient approach to compute a similarity score for a pair of sensors. All sensors compute fuzzy sets that represent their past output using only few tens of bytes. These fuzzy sets are indexed in a data base. Given the output of another sensor, similarity scores are computed for each indexed sensor, sensors are ranked by this score and returned to the user. Using sensor data from three realworld deployments, we could show the high accuracy of our 7 http://wisebed.eu/site
approach. As proof of concept, we built a working prototype to demonstrate the functionality of our service and to support experimentation in realistic environments. Building upon those results, we will explore scalable search algorithms to support searching among large numbers of sensors in the Web of Things. Eventually, we also plan to perform a user study to assess the accuracy of our approach. VIII. ACKNOWLEDGEMENT This work has been partially supported by the European Union under contract number ICT-2009-258885 (SPITFIRE) and by the Federal Ministry of Education and Research of Germany (Forderkennzeichen 01BK0905, Real-World GLab). R EFERENCES [1] D. Evans, “The Internet of Things: How the Next Evolution of the Internet Is Changing Everything,” White Paper, Cisco Internet Business Solutions Group, April, 2011. [2] F. Mattern and C. Floerkemeier, From the Internet of Computers to the Internet of Things, ser. LNCS. Springer, 2010, vol. 6462, pp. 242–259. [3] A. Salehi, M. Riahi, S. Michel, and K. Aberer, “GSN, Middleware for Streaming World,” In Proc. 10th Int. Conf. on Mobile Data Management, 2009. [4] S. Nath, J. Liu, and F. Zhao, “SensorMap for Wide-Area Sensor Webs,” IEEE Computer, 2008. [5] A. Broering, F. Bache, T. Bartoschek, and C. P. van Elzakker, “The SID Creator: A Visual Approach for Integrating Sensors with the Sensor Web,” 14th AGILE Int. Conf. on Geographic Information Science, April 2011, Utrecht, Netherlands. [6] B. Christophe, V. Verdot, and V. Toubiana, “Searching the Web of Things,” IEEE Intl. Conf. Semantic Computing, 2011. [7] B. M. Elahi, K. Roemer, B. Ostermaier, M. Fahrmair, and W. Kellerer, “Sensor Ranking: A Primitive for Efficient Content-based Sensor Search,” IPSN ’09, San Francisco, CA, USA. [8] D. Pfisterer, K. Roemer, D. Bimschas, H. Hasemann, M. Hauswirth, M. Karnstedt, O. Kleine, A. Kroller, M. Leggieri, R. Mietz, M. Pagel, A. Passant, R. Richardson, and C. Truong, “SPITFIRE: Towards a Semantic Web of Things,” IEEE Communications Magazine, Nov 2011. [9] P. Darasb, T. Semertzidis, L. Makrisb, and M. G. Strintzisa, “Similarity Content Search in Content Centric Networks,” Proc. Intl. Conf. on Multimedia, MM ’10. [10] Z. Wang, M. D. Hoffman, P. R. Cook, and K. Li, “Vferret: Content-based Similarity Search Tool for Continuous Archived Video,” CARPE’06. [11] J. M. Bahi, A. Makhoul, and M. Medlej, “Data Aggregation for Periodic Sensor Networks Using Sets Similarity Functions,” IWCMC, 2011. [12] J. Beringer and E. Huellermeister, “Online Clustering of Parralel Data Streams,” Data Knowl. Eng., 2006. [13] M. Gauger, olga Saukh, M. Handte, and P. J. Marron, “Sensor-based Culstering for Indoor Applications,” SECON’08, 2008. [14] L. E. Holmquist, F. Mattern, B. Schiele, P. Alahuhta, M. Beigl, and H.-W. Gellersen, “Smart-Its Friends: A Technique for Users to Easily Establish Connections between Smart Artefacts,” Proc. Ubicomp, 2001. [15] J. Lester, B. Hannaford, and G. Borriello, “”Are you with me?” - Using Accelerometers to Determine if Two Devices are Carried by the Same Person,” In Proc. 2nd Int. Conf. Pervasive Computing, 2004. [16] C. Truong, K. Roemer, and K. Chen, “Sensor similarity search in the web of things,” IoT-SoS 2012, San Francisco, USA. [17] L. A. Zadeh, “Outline of A New Approach to the Analysis of Complex Systems and Decision Processes,” IEEE Trans. on Sys., Man and Cybern., vol. SMC-3, 1973. [18] S. L. Chiu, “Extracting Fuzzy Rules from Data for Function Approximation and Pattern Classification,” Fuzzy Information Engineering A Guided Tour of Applications, pp. 1–10, 1997. [19] B. Boyer, “Robust Java Benchmarking: Part 1 and Part 2,” IBM’s developerWorks, Technical Library, 2008.