Journal of Network and Systems Management, Vol. 9, No. 2, 2001
Fuzzy Logic-Based Diagnosis of Traffic Anomalies in Voice Networks Milena Butto` ,1 Maurizio Naldi,2,4 and Andrea Neri3
Network Traffic Management includes all the procedures set up for recognizing and solving traffic anomalies, i.e., any mismatching situation between traffic demand and network capacity that leads to an impairment in network performances. The resolution of traffic anomalies has generally received considerably more attention than the recognition phase. In this paper a diagnostic tool, based on the use of fuzzy logic, is proposed to recognize traffic anomalies (overloads and failures) on the basis of measurements currently available on commercial switches. The tool is composed of five separate inferential blocks, arranged over three hierarchical levels. The probability of correct diagnosis in the two opposite cases of no anomaly and moderate anomaly, evaluated by simulation, is shown to be over 97% for nodes and high usage trunk groups and over 90% for final trunk groups. KEY WORDS: Network traffic management; fuzzy logic; diagnostic tools.
1. INTRODUCTION
In the public switched network the term “Traffic Anomaly” stands for any mismatching situation between traffic demand and network capacity that leads to an impairment in network performances. A traffic anomaly is generally the consequence of unexpected events such as overloads, triggered by social (e.g., national or religious holidays, sporting events, political crises) and natural (e.g., earthquakes, floods) phenomena, or unrecoverable failures hitting the switching and transmission equipment. In the presence of such an imbalance between demand and capacity the network is compelled to work at a utilization level much higher 1 WIND
Telecommunications, Network Architecture and Traffic Engineering Department, Rome, Italy. 2 Universita ` di Roma “Tor Vergata,” Dip. di Informatica Sistemi Produzione (DISP), Via di Tor Vergata 110, 00133 Roma, Italy. 3 Compaq Computers, Rome, Italy. 4 To whom correspondence should be addressed. E-mail:
[email protected] 161 1064-7570/ 01/ 0600-0161$19.50/ 0 2001 Plenum Publishing Corporation
162
Butto` , Naldi, and Neri
than that for which it was engineered. This causes the intervention of the overload control mechanisms resident in the switch, designed to avoid disruptions of the network efficiency under normal loading conditions, with the unpleasant side effect of a sudden fall of the network grade of service [1–3]. Many Network Operators routinely monitor their network to perceive the presence, type, and intensity of a traffic anomaly. This analysis phase, which we name the recognition phase, is followed by the decision as to the appropriate countermeasure (the traffic anomaly resolution phase). The countermeasures fall in either of the two categories of protective controls (by which the operator restricts the access to the network, so to reduce the load to acceptable levels) and expansive controls (by which alternative routes are sought after for the excess traffic, resulting in a re-routing). The set of procedures put into effect (under real time constraints) for the purposes of recognition and resolution of the traffic anomalies goes under the collective name of Network Traffic Management (NTM) [4, 5]. Following the definition by ITU (International Telecommunication Union), the aim of NTM is “to enable as many calls as possible to be successfully completed” [6]. Since their early conception the NTM procedures have evolved remarkably, being the subject of much literature. Among the analyzed issues we find the determination of the optimal amount of processed information, the complexity of the algorithms to extract knowledge on the network state, and the trade-off between centralized and distributed solutions [7–11]. The resolution phase problem has generally been approached as a constrained optimization problem, where the objective function is linked to the traffic handling capability of the network, the variables are the available routes and the traffic intensity of the streams routed through them, and the constraints are given by the trunk sizes and the importance attached to specific services and/ or traffic destinations [12]. As an alternative to this approach, the use of fuzzy logic has been proposed to select the best expansive control in a dynamic routing policy [13, 14]. Much less effort has instead been devoted to the recognition of anomalies. The methods proposed in the literature limit themselves to examine each network element separately without arriving at a network-wide inference. A limited set of traffic parameters are monitored for each node, (see Bostica et al. [15]; and Briccoli [16]) and abnormal deviations from their typical values are detected through statistical criteria. This approach has two disadvantages. First, taking network management decisions on the basis of single element measurements leads to choices that may be locally sound but harmful for the network as a whole; hence, some correlation is needed among measurements conducted over a set of related network objects. Secondly, the variety of traffic anomalies and network conditions makes the definition of a statistical model a very difficult task; a more robust approach based on a minimal set of assumptions is therefore needed. In order to overcome these limitations alternative techniques have
Fuzzy Logic-Based Diagnosis of Traffic Anomalies in Voice Networks
163
been attempted, notably expert systems [17]; neural networks [24]; and fuzzy logic [18]. In this paper the recognition problem is dealt with by further exploring the use of fuzzy logic. A complete diagnostic tool, based on measurements available on commercial switches and processed by a fuzzy logic inferential engine, is proposed to recognize the presence and type of traffic anomalies. This paper focuses on the anomaly identification (recognition phase) rather than on the countermeasure choice (resolution phase) [13, 14], and considers a wider set of traffic anomalies than [18]. The remainder of the paper is organized as follows. In Section 2 the anomaly categories and their impact on network performances are briefly described. Sections 3–6 describe the tool characteristics, namely its structure (Section 3), the input data (Sections 4 and 5), and the inferential engines (Section 6). The performance of the tool is analyzed in Section 7 through simulation of networks of realistic size and topology. 2. TRAFFIC ANOMALIES AND THEIR IMPACT ON NETWORK PERFORMANCE
The NTM process starts from the measurement data, collected by the switch, and after inferring the network state returns the indication of the proper control to the switch for the actions to be taken. The diagnosis phase is much eased if traffic anomalies are classified so that the diagnosis becomes essentially a recognition task. An established classification of traffic anomalies, based on their nature, consists of two categories: overloads and failures [19]. Overloads are generated by an excessive increase of the customer demand. Failures may concern either the hardware or the software and may be complete (i.e., making a piece of equipment or an application program completely unusable) or partial; in both cases they reduce the traffic carrying capability of the network. Overloads can be further categorized according to their extension. We distinguish among general, local, and focussed overload. A general overload affects the whole network, pushing its utilization level so high as to reach the collapse point; both trunks and switches (especially the transit ones) get congested. In a local overload just the nodes belonging to a small geographic area (and therefore the traffic relations originating from or terminating on them) are affected; the impact on the remainder of the network is negligible. Finally, the overload is focused when it concerns a destination within a restricted portion of the numbering arc (depending on the position of the digits that identify the overloaded destination, this may represent anything from a single customer to a whole country); if the calls come from all over the network, it is a mass call phenomenon. Overloads tend anyway to trigger a positive feedback, as congestion spurs repeated attempts which further increase the load on the switches.
Butto` , Naldi, and Neri
164
The impact of failures depends on the range of traffic relations served by the malfunctioning switch or trunk group: the more the network element is shared by the traffic streams, the wider the impact is on the network performance. For that reason a node failure, especially if it concerns a transit node, has a larger negative influence than the drop of a transmission cable. Hardware failures are perceived more easily than bugs on software applications [20]. As a result of a failure on a network element, an overload appears on another network element, further increased by the presence of repeated attempts. Based on traffic measurements alone, distinguishing between overloads and failures may therefore be hard.
3. THE STRUCTURE OF THE DIAGNOSTIC TOOL
The diagnostic tool is composed of five separate inferential blocks, arranged over three hierarchical levels (see Fig. 1). The use of a hierarchical system, already suggested in the related context of a fuzzy system for dynamic routing [13], allows to increase considerably the number of relationships that can be accounted for in the whole inferential system, as this is actually broken down into manageable pieces. In addition, since many inferential processes may be parallelized, the computational complexity grows slower than the network size. The three blocks at the lowest level deal with single network objects (switches, transmission links, and traffic destinations). As they represent the
Fig. 1. Functional scheme of the diagnostic tool.
Fuzzy Logic-Based Diagnosis of Traffic Anomalies in Voice Networks
165
Table I. Number of Inference Rules Inferential block Switch Transmission link Traffic destination Macro-node Network
No. of inference rules 10 9 11 14 6
interface towards the network monitoring system (responsible for delivering the measurements), they must transform the (numerical) measurements into fuzzy variables. This conversion is accomplished through the use of a membership function. The difference with numerical (or crisp as they are often referred to in the fuzzy logic literature, see [21]) quantities is that a fuzzy variable belongs to a given fuzzy set with a membership value in the range between 0 (no membership) and 1 (full membership), while these two limits are the only values allowed for a crisp variable. In the stages following the crisp-to-fuzzy conversion the diagnostic tool works with fuzzy quantities only. Each inferential block consists of a small number of inference rules (less than fifteen, see Table I) of the fuzzy logic kind, expressed in the following canonical form: If (Antecedent) then (Consequent) where the Antecedent is a logic connection of propositions like {x ∈ A }, x being a fuzzy variable and A a fuzzy set. An example of such inferences is “If {the overload of node call attempts is low} and {the node blocking probability is high} and {the call overflow on alternative trunks is low} Then {the switch is undergoing a fault of medium intensity}”. The truth value of the Consequent proposition is defined by the corresponding membership function, whose value is determined according to the Mamdani criterion [21]: the truth value of the Consequent is equal to the lowest truth value among the ones that appear in the Antecedent propositions. When a number of inference rules lead to the same Consequent, its final truth value is equal to the maximum among the outputs of the relevant rules. The outputs of the three lowest inferential engines are transferred to the second level, whose task is to diagnose the state of a macro-node, i.e., a switch inclusive of all the transmission links and the traffic destinations connected to it. As two adjacent switches share at least one transmission link, the macro-nodes will be partially overlapping. The goal of the diagnostic tool, i.e., to infer the traffic anomaly (if any), is
Butto` , Naldi, and Neri
166
reached at the third diagnostic level, where the partial inferences made on each macro-node are correlated. 4. DESCRIPTION AND FUZZIFICATION OF THE OBSERVABLES
The diagnosis of the traffic anomaly relies on the anomaly itself being visible through a set of observables, i.e., a set of quantities that can be measured and are related to the network conditions. The basic decision has been taken to just use quantities available on the current generation of commercial switches. As these observables represent the input to the first level inferential engine (see Fig. 1), it is natural to subdivide them into the following three classes: Trunk entities, Node entities, Destination entities. Each node monitors its own destinations only. To the first class belong the following five quantities: • • • • •
OFL (Overflow, i.e., the fraction of call attempts lost due to congestion); ASR (Answer-to-Seizure Ratio); DISP (Percentage of available circuits in a trunk); BCH (Number of call attempts in an hour); NBCH (Number of call attempts in an hour per available trunk multiplied by DISP)
Just two quantities are used to describe the node behavior: •
SOVR (Number of call attempts in excess of the design value, normalized to the design value); • BLOCK (Blocking probability). Two additional quantities relate to the destination: • •
ABRD (Answer-to-Bid Ratio at the destination); NBCHD (Number of call attempts to a given destination).
Each of these defined quantities is transformed into a fuzzy quantity to be processed by the inferential blocks. Three fuzzy sets (labeled as “Good,” “Medium,” and “Bad,” each associated to a membership function) have been defined for each observable as fuzzy indications of the state of the network object of interest. The definition of the membership function is done for all the quantities of interest through a unified criterion based on the Grade-of-Service (GOS). In a circuit-switched network the ultimate indicator of the GOS is the congestion probability. The fuzzy sets (Good, Medium, and Bad) are shaped according to the resulting congestion probability: crisp values of different observables corresponding to the same degree of congestion fall into identically labeled fuzzy sets. Two examples of membership functions are reported in Fig. 2.
Fuzzy Logic-Based Diagnosis of Traffic Anomalies in Voice Networks
167
Fig. 2. (a) Membership functions for ASR; and (b) Membership functions for ABRD.
5. SELECTION OF RELEVANT OBSERVABLES
All the quantities described in Section 4 are subject to variations, due either to the random nature of the process under observation (variations which occur even under normal operating conditions) or to deviations from the network normal state (trend variations). Random fluctuations and trend variations have an opposite influence on the correctness of the decision task embodied in the diagnostic tool (which has to decide whether an anomaly is present and what its degree of intensity is). In the end the tool must provide a high probability of detecting traffic anomalies and a low probability of false alarms. While trend variations help us discriminate among the different network states, random fluctuations blur the picture. The observables of Section 4, candidate to be included as input variables in the diagnostic process, must therefore undergo a selection phase to assess the extent of the two kinds of variations for each of them: those observables will be selected for which trend variations prevail over random fluctuations. The stress is on achieving the anomaly recognition rather than simply reducing the number of variables involved. This phase has been accomplished by discrete-event simulation, conducted on networks of medium size (15 nodes). For a number of network conditions (e.g., no anomaly, overload, failure) a sample {X ij } (the first subscript refers to
Butto` , Naldi, and Neri
168
the degree of intensity of the traffic anomaly, the second one to the observable) has been gathered for each observable on the whole network. The sample {X 0j } contains the values of the jth observable under normal conditions. The generic sample {X ij } consists of the elements x ijk (k c 1, 2, . . . , N ) gathered at N time instants. These samples have been statistically analyzed through a variety of metrics to assess the sensitivity (capability of being influenced by the presence of an anomaly) and selectivity (capability to discriminate between different degrees of intensity) properties of the observables. The set of metrics used to this purpose are the following five: • •
weights of the principal components; average distance between samples of the same observable under different degrees of anomaly intensity; • coefficient of variation of the sample of the observable; • sign of variations of the observable under the occurrence of an anomaly; • degree of overlapping between the empirical probability density functions of the same observable under different degrees of anomaly intensity. It is to be noted that the computation of the metrics is carried out separately for each network element (trunks, nodes, destinations). The method of principal components [22] is an established tool to replace a set of random quantities by a reduced number of variables (thus simplifying their subsequent processing), made up of linear combinations of the original quantities; these derived quantities nevertheless preserve most of the information contained in the original sample. The weights by which the original quantities are combined, obtained by maximizing the variance of the linear combination, are a direct indication of their information content (and therefore of their relevance). In our case the quantities to be combined are our observables; the weights of the observables fingerpoint the most relevant ones. The metric I 1j for the jth observable is therefore its weight in the linear combination. The second metric I 2j , defined as
I 2j c
1 N
| | | | (x ijk − x 0jk )| | | | i | k |
∑∑
(5 .1 )
allows us to evaluate the capability of the jth observable to discriminate among different degrees of intensity of an anomaly. At the same time we want the dispersion of each sample around its mean value, due to random fluctuations, to be as small as possible. This can be measured by the coefficient of variation (standard deviation-to-mean ratio):
Fuzzy Logic-Based Diagnosis of Traffic Anomalies in Voice Networks
I 3j c
∑
f
∑k (x ijk − x ij )2 x ij
i
169
(5.2)
where x ij c 1/ N ∑k x ijk . As trend variations have to be recognizable, we expect that the occurrence of a traffic anomaly leads to a one-way variation of the observable, i.e., that when an anomaly occurs the observable either increases always or decreases always. Our fourth metric is therefore I 4j c
∑ ∑ sgn(x i
ijk
− x 0jk )
(5.3)
k
if we expect the observable to increase under the presence of the anomaly, and I 4j c
∑ ∑ sgn(x i
0jk
− x ijk )
(5.4)
k
in the reverse case. The sgn function is
sgn(z) c
{
1 0
z>0 z≤0
(5.5)
Having at our disposal the samples of the same observable under different network conditions, we can build the empirical probability density functions (pdf ) of an observable for each degree of anomaly intensity. If these pdf’s were all strictly separated, the value of the observable would immediately tell us if the anomaly is present. Unfortunately there is a certain degree of overlapping, which may lead to a decision error and can be measured by the fifth metric I 5j , defined as the sum of the error probabilities under the two hypotheses (no anomaly and anomaly present). For each anomaly i the metric I ij computed for each network element provides a ranking of our observables, with reference to the network element of interest, so that the ranking for a given node will be generally different from that obtained for another node or for a trunk. In the case of metrics 1, 2, and 4 the most relevant observables are those with the largest metric value, while the reverse is true for metrics 3 and 5. Each metric value is further normalized so to output a value aij (i c 1, 2, . . . , 5) in the range [0, 1]. The results obtained separately by the five metrics are linearly combined to obtain an overall metric Aj of the goodness of the jth observable
Butto` , Naldi, and Neri
170
Table II. Relative Weights of the Metrics i
bi
1 2 3 4 5
0.2 0.35 0.09 0.18 0.18
5
Aj c
∑ b .a i
ij
(5 .6 )
ic1
where the weights bi used in our analysis, as determined by subjective assessment, are reported in Table II. After this analysis the following observables have been selected to be used in the first level of the diagnostic tool: • • •
SOVR, BLOCK, and OFL to diagnose the node state; DISP, NBCH, and OFL to diagnose the state of a trunk group; ABRD, BCHD, and SOVR to diagnose the state of a destination.
6. THE INFERENTIAL BLOCKS
The core of the diagnostic tool is represented by the fuzzy inferential engine which applies a set of rules to the measurements in order to diagnose the state of the network. A key advantage of the use of fuzzy logic is that the inference rules can be easily defined to include all the knowledge acquired by experts of the field. In the case of Network Management the natural way to learn how the network reacts to a specific traffic anomaly is to directly observe the network behavior when the anomaly takes place. However, anomalies are rare events, so that collecting a thorough set of samples of the network reaction to a varied set of anomalies would be a long-lasting task. Luckily, the direct experience coming from the real world observation can be enriched and complemented by reproducing the network behavior through models; discrete-event simulation can be used to this purpose [23]. Most of the results presented in this paper have therefore been obtained and verified by simulation. Given the very low probability of anomalies occurring in pairs, the basic assumption has been made that traffic anomalies don’t occur in pairs (here we refer to source anomalies, each source anomaly being susceptible of originating several secondary anomalies).
Fuzzy Logic-Based Diagnosis of Traffic Anomalies in Voice Networks
171
6.1. First Diagnostic Level
At the first diagnostic level inferences are made on the state of the network objects (nodes, trunks, and destinations) separately. At this stage no attempt is made to correlate informations regarding two different network objects. The state of each object is described through a fuzzy variable which supplies an indication of both the nature of the problem (if any) and its intensity. Again, the classification into gravity levels is carried out according to the effect on the object performance. As an example, the possible outputs of the inferential block for a node are reported in Table III. Describing an object behavior through its performance requires a set of performance parameters, which are different for the different objects. For a node, in virtue of its functional complexity and of the many subsystems involved in the call set-up phase, this set could be quite large. We can however limit ourselves to the most meaningful ones, i.e., those most influencing the node throughput and the congestion spread. The performance index for a node is therefore the call loss probability due to insufficient processing capability or buffer capacity. As the direct measure of this performance index is not always available, an indirect evaluation can be adopted through mathematical expressions, though approximate, taking into account the different node architectures, the input load and processing features [25]. For a trunk group, traffic performances can instead be evaluated through the probability of a call being lost due to trunk resource congestion. This value varies in accordance to how the trunk group is used in the routing plan: in hierarchical networks a first choice group suffers a larger congestion than a final one. The same fuzzy value to describe the trunk group state may therefore be associated to different congestion values. For the destination an indicator of performance is its availability, expressed Table III. Set of Values of the Fuzzy Variable Describing the State of a Node Fuzzy value No problem Medium overload High overload Medium failure Bad failure
Corresponding node behavior (state) The node performance is within the limits set in the network phase The node is affected by an overload causing a performance decrease of medium intensity The node is affected by an overload causing a performance decrease of high intensity A failure hits the node causing a performance decrease of medium intensity A failure hits the node causing a performance decrease of high intensity
Butto` , Naldi, and Neri
172
Table IV. Inference Rules to Diagnose the State of a Node Output
Input variables Rule
SOVR
BLOCK
OFL
S node
1 2 3 4 5 6 7 8 9 10
Good Good Good Good Medium/ Bad Medium/ Bad Medium Medium Bad Bad
Good Medium Bad Bad Medium Bad Good Medium/ Bad Good Medium/ Bad
Any Any Medium/ Bad Good Good Good Any Medium/ Bad Any Medium/ Bad
No problem No problem No problem Medium failure Medium failure Bad failure Medium overload Medium overload High overload High overload
by the probability that a call, reaching the border of the network (local exchange or gateway), goes into conversation. The availability depends on a few factors, e.g., the distance between the observation point and the destination itself: the greater the distance the lower the availability. Again, the same fuzzy value may correspond to different availability values. The set of inference rules used to diagnose the state of a node is reported in Table IV. Three variables (SOVR, BLOCK, and OFL) are employed to infer the state of a node, expressed through the fuzzy variable S node. The variables SOVR and BLOCK refer to the node itself; OFL is measured on the trunk group connecting the node under examination to its transit node or on the trunk group suffering from the largest congestion if the node under examination is itself a transit node. S node is obtained as a logical AND of the three input variables; whenever two values appear for an input variable, they are combined through a logical OR. As an illustration Rule 3 in Table IV reads like IF((SOVR is Good )AND(BLOCK is Bad ) AND((OFL is Medium) OR(OFL is Bad)) THEN (S node is No problem). The output S node can take one of the fuzzy values shown in the last column in Table IV, corresponding either to the correct functioning of the node or to an anomaly (failure or overload) of various degrees of intensity. A necessary condition to be sure of the proper working of the node is the presence of a Good value for SOVR; dissatisfying values for BLOCK and OFL (as appearing in Rule 3) do not alter the picture, as they can be ascribed to random fluctuations. A failure is instead signaled by an increased blocking; the overflow (represented by OFL) keeps within limits as the additive flow due to repeated attempts is balanced by shorter holding times (Rules 4–6 in Table IV). An increased loss of
Fuzzy Logic-Based Diagnosis of Traffic Anomalies in Voice Networks
173
Table V. Inference Rules to Diagnose the State of a Trunk Group Output
Input variables Rule
DISP
NBCH
OFL
S group
1 2 3 4 5 6 7 8 9
Good Good Medium Bad Good Good Medium Medium Bad
Good Medium Good/ Medium Good Medium/ Bad Bad Bad Good/ Medium Any
Any Good Good Good Medium/ Bad Good Any Medium/ Bad Medium/ Bad
No problem No problem No problem No problem Overload Overload Overload Failure Failure
calls on trunks (bad OFL) coupled with an excess of call attempts (bad SOVR) characterizes an overload (Rules 7–10 in Table IV). The diagnosis rules for a trunk group are shown in Table V. Here a traffic anomaly is directly observable through the call loss ratio: if OFL is not Good, then the trunk group is suffering from either an overload (if the availability DISP is Good and the number of call attempts NBCH has increased) or a failure (if the number of call attempts is at normal levels but the availability is low). A problem at a destination is signalled by at least one of the parameters pertaining to the destination (ABRD and BCHD) being other than Good (see Table VI). It is to be noted that a trouble may be present even if BCHD is Good (see Rules 3, 7, and 9), due to the large statistical variability of BCHD measurements. Overloads can be distinguished from failures by observing the number of attempts Table VI. Inference Rules to Diagnose the State of a Destination Output
Input variables Rule
ABRD
BCHD
SOVR
S dest
1 2 3 4 5 6 7 8 9 10 11
Good Good Medium Medium Bad Bad Medium Medium Bad Bad Bad
Good Medium/ Bad Good Medium/ Bad Medium Bad Good Medium/ Bad Good Medium Bad
Any Any Bad Medium/ Bad Bad Medium/ Bad Good/ Medium Good Any Good/ Medium Good
No problem Overload Overload Overload Overload Overload Failure Failure Failure Failure Failure
Butto` , Naldi, and Neri
174
at the node connected to the destination: if SOVR is not Good an overload is diagnosed. 6.2. Second Diagnostic Level
The second diagnostic level correlates the fuzzy variables of the elementary network objects to diagnose the behavior of a wider portion of the network. At this stage the notion of macro-node is introduced. A macro-node is a node augmented of the incoming/ outgoing trunk groups and of the destinations directly connected to the node itself. The state of each macro-node is represented by the fuzzy variable S macro, which can assume the following values: • • • • • •
No problem Node Overload Node Failure Destination Failure Destination Overload Trunk Group Failure
The state of a macro-node is assessed through the rules listed in Table VII. While the states of the destination and of the node are valid input variables, a limited subset of the trunk groups included in the macro-node are taken into consideration to perform the diagnosis task. They are the trunk group affected by the worst availability (worst DISP), and that connecting the node with its transit node or, if the macro-node of interest is itself a transit node, that with the lowest overload. The former is indicated by S group(u) and the latter by S group(s). Rules 3 is splitted in two, which hold for a local exchange and for a transit exchange respectively, on the basis of the experience that an overload on a transit exchange has a greater impact on the network. 6.3. Third Diagnostic Level
The overall diagnosis for the network is reached at the third diagnostic level, where the input variables are the states of all the macro-nodes. The set of network states is the same as that adopted for the macro-nodes. Here, however, the possibly contrasting diagnoses reached for the single macro-nodes have to be reconciled, because of the assumption of a single anomaly at one time. The state of some macro-nodes will therefore be considered as the consequence of the state of some other macronodes: a High overload at a destination node can backpropagate and cause an equally High overload on some origin nodes. In particular, the diagnosis “No problem” is formulated when all the macro-nodes show no problem (method of rule disjunction): NoProblem c Minl (NoProbleml ),
Output
Input variables Rule
S dest
1 2 3.1 3.2 4 5 6 7 8
No problem No problem No problem No problem No problem No problem No problem Failure Failure
9 10 11
Overload Overload Overload
12 13 14
Failure Failure/ overload Failure/ overload
S node No problem Medium/ bad failure Medium overload Medium overload Medium overload High overload Medium/ bad failure Medium/ bad failure No problem/ medium overload No problem Medium/ bad failure Medium/ high overload High overload Any Any
S group(u)
S group(s)
S macro
problem problem/ overload problem/ overload problem/ overload problem/ overload problem/ overload problem/ overload problem/ overload problem/ overload
No problem/ overload Overload No problem No problem Overload No problem/ overload No problem No problem/ overload No problem/ overload
No problem No problem No problem Node overload Node overload Node overload Node failure Dest. failure Dest. failure
No problem/ overload No problem/ overload No problem/ overload
No problem/ overload No problem/ overload No problem/ overload
Dest. failure Dest. overload Dest. overload
No problem/ overload Failure No problem/ overload
No problem/ overload No problem/ overload Failure
Dest. overload Trunk group failure Trunk group failure
No No No No No No No No No
Fuzzy Logic-Based Diagnosis of Traffic Anomalies in Voice Networks
Table VII. Inference Rules to Diagnose the State of a Macro-Node
175
Butto` , Naldi, and Neri
176
l being the generic macro-node. For all the other network states the method of rule conjunction is instead applied so that the most severe diagnosis reached on the set of macro-nodes is assumed for the whole network, e.g., NodeOverload c Maxl (NodeOverloadl ). The complete set of rules to infer the state of the network, by assigning values to the fuzzy variable S network, is the following (the truth degree of each Antecedent results from the aforementioned conjunction rules): 1. If (S macro is No problem)THEN(S network c No problem) 2. If (S macro is Node failure)AND{NOT[(S macro is Dest failure)OR(S macro is Dest overload)]} AND [NOT(S macro is Trunk Group Failure)]THEN(S network is Node failure) 3. If (S macro is Node overload ) AND {NOT [(S macro is Dest failure) OR (S macro is Dest overload )]} AND [NOT(S macro is Trunk Group Failure)] THEN (S network is Node overload ) 4. If (S macro is Dest overload ) AND [NOT(S macro is Trunk Group Failure)] THEN (S network is Dest overload ) 5. If (S macro is Dest failure) AND [NOT(S macro is Trunk Group Failure)] THEN (S network is Dest failure) 6. If (S macro is Trunk Group Failure) THEN (S network is Trunk Group Failure)
Rules 2 and 3 take into account the spread of congestion (spatial correlation between anomalies). Rules 4 and 5 aim at removing hidden ambiguities in the diagnosis. 7. PERFORMANCE OF THE DIAGNOSTIC TOOL
The diagnostic tool described in the foregoing sections has undergone a performance evaluation through simulation. Several networks of medium size (10–20 nodes) have been considered, all sharing the same basic hierarchical topology: a full mesh with a single transit node (tandem switch), with a routing plan consisting of two choices, the first one being the direct link and the second one through the tandem switch. The high connectivity (larger than 70%) is a major hurdle for the diagnostic tool, since it favors the spread of traffic anomalies. The occurrence of a single anomaly (an overload or a failure) has been simulated for each network through the use of an established in-house simulation tool [23]. The probability of having two anomalies at the very same time has been considered negligible. Our diagnostic tool has then been applied to the measurement data tracing the network behavior before and during the anomaly occurrence. The performance of the diagnostic tool has been evaluated through the
Fuzzy Logic-Based Diagnosis of Traffic Anomalies in Voice Networks
177
estimation of the probability of each diagnosis in the set of the possible outputs of the diagnostic tool. This probability will depend on the degree of intensity of the anomaly. At the opposite ends of the range of the anomaly intensity indicator (corresponding to the cases of normal conditions and of full intensity anomaly respectively) we obtain the false alarm probability and the miss probability respectively. In the following we present some sample results concerning the following anomalies: • • • • •
overload on a terminal node; failure of a terminal node; failure of a high usage trunk group; failure of a final trunk group; overload on a destination.
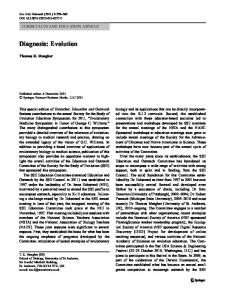
Let’s examine these cases one by one. In the case of overload on a terminal node the degree of intensity is represented by the overload level, i.e., the excess percentage of call attempts with respect to the design value for dimensioning the switch processor. The possible diagnoses output by the diagnostic tool are no anomaly, overload, and failure. In Fig. 3 the probability of each of these diagnoses (estimated
Fig. 3. Diagnosis probability under overload on a terminal node.
178
Butto` , Naldi, and Neri
Fig. 4. Diagnosis probability under failure of a terminal mode.
as the ratio between the number of times that each diagnosis is emitted and the total number of simulated cases) is reported when the overload level increases from 0 (no anomaly) to 25%. The false alarm probability, equal to the complement to 1 of the probability of the “no anomaly” diagnosis when there is no overload, is a very low 2.3%. When an overload appears its recognition is very fast: at an overload level of 10% the probability of detecting the overload is as high as 98.5%. Diagnosis errors are negligible for overloads larger than 25%. The chance of an overload being disguised for a failure is low, since it is always less than half the probability of a “no anomaly” output. If the same terminal breaks down we can assess the degree of the intensity of this anomaly as the throughput (carried traffic) reduction that this failure entails. A range 0–30% of throughput reduction is considered in Fig. 4. The false alarm probability here is 1%, even lower than in the cases of overloads, but the misdiagnosis probability falls slowly and reaches 6.3% only for a throughput reduction of 20%. For throughput reductions larger than 25% the diagnosis can be considered nearly error-free. Discrimination against overloads is very good: the probability of an “overload” diagnosis is always lower than 3%. Let’s examine now failures on trunk groups. Now we must distinguish if the failure concerns a high usage trunk group (Fig. 5) or a final one (Fig. 6), as the effects on the network are quite different. However in both cases the
Fuzzy Logic-Based Diagnosis of Traffic Anomalies in Voice Networks
Fig. 5. Diagnosis probability under failure of a high usage trunk group.
Fig. 6. Diagnosis probability under failure of a final trunk group.
179
Butto` , Naldi, and Neri
180
Fig. 7. Diagnosis probability under overload on a destination.
anomaly can be ranked according to the overflow, i.e., the percentage of attempts lost due to unavailability of trunk resources. The false alarm probability is just 3% for high usage trunk groups, but roughly 10% for a final trunk group. The performance of the diagnostic tool is better for a high usage trunk group over the whole range of overflow levels. In fact the overflow threshold for which the miss probability gets lower than 10% is 20% for a final trunk group but 15% for a high usage trunk group. The discrimination between overloads and failures is anyway perfect (the probability of an overload diagnosis is always negligible) for both kinds of trunk groups even at the largest overflow levels. The diagnosis probability in the case of an overload on a destination is depicted in Fig. 7. Here the overload intensity is evaluated through the Answerto-Bid Ratio (ABR) at the destination: the lower the ABR the worse the anomaly. At either end of the range of ABR values examined (45–75%) the misdiagnosis probability is lower than 20%. 8. CONCLUSIONS
A diagnostic tool, whose inference engine is based on fuzzy logic, has been presented to detect, and recognize the cause of, traffic anomalies in a circuitswitched network.
Fuzzy Logic-Based Diagnosis of Traffic Anomalies in Voice Networks
181
The performance of the diagnostic tool has been evaluated through simulation under a range of traffic disturbances. The probability of declaring an anomaly when the network is instead working properly is very low (1–2%) for anomalies (overloads or failures) concerning a node or a high usage trunk group. The tool is more susceptible to emit a false alarm in the case of a final trunk group or an overloaded destination. When a traffic anomaly is indeed present, it is detected with low error probability even for small-to-moderate anomaly intensity levels. Again, the worst performance are obtained for final trunk groups or for overloaded destinations. Discrimination against other anomalies (i.e., declaring an overload when a failure is present, or viceversa) is very good for nodes and for high usage trunk groups. On the overall, the high quality of the diagnoses output by the diagnostic tool is confirmed for the anomalies concerning nodes and high usage trunk groups; some room for improvement is present for the performance for final trunk groups and overloaded destination. An added feature of the diagnostic tool is the possibility of easily enriching its set of inference rules.
REFERENCES 1. L. A. Gimpelson, Network management: Design and control of communications networks, Electrical Communication, Vol. 49, No. 1, pp. 4–22, 1974. 2. P. J. Burke, Automatic overload control in a circuit-switched communication network, Proceedings of the National Electronic Conference, pp. 667–672, 1968. 3. J. M. Akinpelu, The overload performance of engineered networks with nonhierarchical and hierarchical routing, Tenth International Teletraffic Congress, Montreal, June 1983. 4. J. Filipiak, Real time network management, North Holland, 1991. 5. L. H. Campbell and H. J. Everitt, A layered approach to network management control, Journal of Network and Systems Management, Vol. 1, No. 1, pp. 41–55, March 1993. 6. ITU-T Recommendation E.410, International network management—General information, Geneva, October 1996. 7. S. Kheradpir, W. Stinson, J. Vucetic, and A. Gersht, Real-time management of telephone operating company networks: Issues and approaches, Journal on Selected Areas in Communications, Vol. 11, No. 9, pp. 1385–1403, December 1993. 8. D. G. Haenschke, D. A. Kettler, and E. Oberer, Network management and congestion in the U.S. telecommunication network, IEEE Transactions on Communications, Vol. COM-29, No. 4, pp. 376–385, April 1981. 9. M. Butto` and G. Giacobbo Scavo, Network management policies: Which aims and how to pursue them, Proceedings of the Network Management and Control Workshop, Tarrytown, New York, 1989. Also in CSELT Technical Reports, Vol. 18, No. 3, pp. 167–171, June 1990. 10. Special issue on Advanced traffic control methods for circuit-switched telecommunication networks, IEEE Communication Magazine, Vol. 2, No. 10, 1990. 11. F. Langlois and J. Regnier, Dynamic congestion control in circuit-switched telecommunication networks, 13th International Teletraffic Congress, Copenhagen, pp. 127–132, June 1991.
182
Butto` , Naldi, and Neri
12. R. Warfield and D. McMillian, A linear program model for automation of network management, Journal on Selected Areas in Communications, Vol. 6, No. 4, pp. 742–750, May 1988. 13. Y. Tanaka, K. Miyakoshi, and M. Akiyama, Dynamic routing by the use of hierarchical fuzzy system, IEICE Transactions, Vol. E74, No. 12, pp. 4000–4005, December 1991. 14. P. Chemouil, J. Khalfet, and M. Lebourges, A fuzzy control approach for adaptive traffic routing, IEEE Communications Magazine, Vol. 33, No. 7, pp. 70–76, July 1995. 15. P. Bostica, M. Butto` , and A. Tonietti, Statistical methods for detecting overloads in a trunk group, Ninth International Teletraffic Congress, Torremolinos, October 1979. 16. A. Briccoli, Comparison of regulation methods for traffic overloads in SPC systems, Ninth International Teletraffic Congress, Torremolinos, October 1979. 17. P. Chemouil and D. Stern, A diagnosis expert system for network traffic management, Networks, Kobe (Japan), 1992. 18. E. Boutleux and B. Dubuisson, Fuzzy pattern recognition to characterize a system evolution. Application to a model of the French telephone network, Annales des Telecommunications, Vol. 51, No. 9–10, pp. 509–520, 1996. 19. F. Garcia-Ayllon, A. Santos, J. Rodriguez-Molowny, and F. Fernandez, Characterization of network anomalies and their detection, CSELT-Telefonica Joint Group on NTM, Working paper, July 1994. 20. D. J. Houck, K. Meier-Hellstern, F. Saheban, and R. A. Skoog, Failure and congestion propagation through signaling controls, 14th International Teletraffic Congress, Antibes, pp. 367–376, June 1994. 21. T. J. Ross, Fuzzy logic with engineering applications, McGraw Hill, 1995. 22. I. T. Jolliffe, Principal Component Analysis, Springer-Verlag, 1986. 23. F. Malabocchia, M. Menozzi, M. Negro, P. Panicciari, and M. Paciotto, The network management simulator: Network environment specifications (in Italian), CSELT Technical Reports, December 1990. 24. E. Didelet, B. Dubuisson, and D. Stern, A neural technique approach to network traffic management, 14th International Teletraffic Congress, Antibes Juan-les-Pins (France), pp. 1321–1330, June 1994. 25. B. Eklund and D. Rapp, Load study of the AXE10 Control System, Ericsson Review, No. 4, 1982.
Milena Butto` graduated in Mathematics from the University of Turin. In 1969–1995 she worked for CSELT. In 1996 she joined the Teletraffic Engineering Department of Telecom Italia, responsible for the Studies Section. Since 1998 she has been with WIND Telecomunicazioni, where she is Head of the Network Architecture and Traffic Engineering Department. Maurizio Naldi received the Dr. Ing. degree in Electronic Engineering in 1988 and the Ph.D. in Telecommunications Engineering in 1998. In 1989–1991 he was with Selenia. He then joined Italcable and in 1995, the Teletraffic Engineering Department of Telecom Italia. In 1998 he moved to WIND Telecomunicazioni. Since 1997 he has been Associate Rapporteur in the ITU Study Group 2. Since 1992 he has been on the faculty at the University of Rome “Tor Vergata”. Andrea Neri received the Dr. Ing. Degree in Electronic Engineering in 1998. He now works for Digital Equipment Corporation.