control to the distributed collector field of a solar power plant. The major characteristic of a solar power plant is that the primary energy source, solar radiation, ...
459
IEEE TRANSACTIONS ON FUZZY SYSTEMS, VOL. 3, NO. 4, NOVEMBER 1995
Fuzzy Logic Control of a Solar Power Plant Francisco R. Rubio. Manuel Berenguel, and Eduardo F. Camacho
Abstract- This paper presents an application of fuzzy logic control to the distributed collector field of a solar power plant. The major characteristic of a solar power plant is that the primary energy source, solar radiation, cannot be manipulated. Solar radiation varies throughout the day, causing changes in plant dynamics and strong perturbations in the process. A special subclass of fuzzy inference systems, the TP (triangular partition) and TPE (triangular partition with evenly spaced midpoints) systems, is used to obtain adequate control signals in the whole range of possible operating conditions. The fuzzy logic controller has been tested in the real plant and results obtained are shown. A comparison with other control approaches widely used in the plant is performed using a nonlinear computer model of the field.
I. INTRODUCTION
S
INCE Mamdani [15] published his experiences using a fuzzy logic controller (FLC)on a test-bed plant of a laboratory, there have been many applications of this type of controller to a diversity of processes such as warm water plants [9], rotative clinker-cooker furnaces for cement production [lo], [ll], automatic train operation [20], cargo ship steering [12], robotics [17], [18], and others. An extensive introduction to the historical development, state, and concepts involving fuzzy control systems can be found in [13] and [14]. A great many advantages of FLC’s have been mentioned in literature. One relevant advantage is the possibility of converting a linguistic control strategy based on experience and expert knowledge into an automatic control strategy. Another advantage is that FLC’s can easily be implemented. Moreover, it has been demonstrated [19] that by using fuzzy inference systems with triangular-partition rule bases with evenly spaced midpoints (TPE systems) like those presented in this paper, the amount of computation required for processing input is independent of the number of rules. The methodology of fuzzy controllers seems to be the most adequate in cases where the process is difficult to control and there is wide experience in operating the plant, due to the possibility of incorporating such knowledge in terms of qualitative rules. This is the case of the control scheme presented here, an application of fuzzy logic control to a distributed collector field of the solar power plant at Almeria, Spain. The distributed collector field consists of a series of parabolic mirrors that reflect solar radiation onto a pipe where oil gets heated while circulating. The objective of the control system in a distributed collector field is to maintain the outlet Manuscript received January 13, 1995; revised April 1, 1995. This work was supported by CICYT under Grant TAP934408 and TAP95-0370,and CIEMAT. The authors are with the Departamento de Ingenieria de Sistemas y AutomAtica-Universidad de Sevilla, Escuela Superior de Ingenieros, Avda. Reina Mercedes s/n, 41012 Sevilla, Spain. IEEE Log Number 9414354.
oil temperature at a desired level in spite of disturbances such as changes in the solar irradiance level (caused by clouds), mirror reflectivity or inlet oil temperature. Since solar radiation cannot be adjusted, this can only be achieved by adjusting the flow of oil, and the daily solar power cycle characteristic is such that the oil flow has to change substantially during operation. This leads to significant variations in the dynamic characteristics of the field, such as the response rate and the time delay, which cause difficulties in obtaining adequate performance over the operating range with a fixed parameter controller. A wide knowledge of the process behavior has been gained, as the plant has been controlled with very different control strategies [3]-[7], [16], during the last 10 years. Results obtained with other control approaches seemed to suggest that very good results could be obtained by using the FLC methodology. The paper is organized as follows. In Section 11, a description of the distributed solar collector field is given. Section I11 is dedicated to presenting the FLC used to control the plant. Section IV presents results obtained when applying the FLC to the distributed solar collector field and a comparison with other control approaches widely used in the plant. Conclusions are given in Section V.
11. DESCRIPTION OF THE SOLARPOWERPLANT This paper is concerned with the application of fuzzy logic to the control of the distributed solar collector field ACUREX of the Solar Power Plant at Tabemas, in Almeria, Spain, which involves the collection of solar energy and its transference to a fluid piped through the system. The energy collected is transferred to a storage tank, which can be tapped when conditions demand, then to either a steam generator for electrical power generation or the heat exchanger of a desalination plant. The distributed collector field, as shown in Fig. 1, mainly consists of a pipeline through which oil is flowing and onto which the sun’s rays are concentrated by means of parabolic mirrors, which follow the sun by rotating on one axis, to heat the oil. It consists of 480 modules arranged in 20 lines which form 10 parallel loops. A simplified diagram of the solar collector field is shown in Fig. 2. The field is also provided with a sun tracking mechanism which causes the mirrors to revolve around an axis parallel to that of the pipeline. Each of the loops mentioned above is formed by four 12module collectors, suitably connected in series. The loop is 172 meters long, the active part of the loop (exposed to concentrated radiation) measuring 142 meters and the passive part 30 meters. The system is provided with a three-way valve which allows the oil to be recycled in the field until its
1063-6706/95$04.00 0 1995 IEEE
IEEE TRANSACTIONS ON FUZZY SYSTEMS, VOL 3, NO. 4, NOVEMBER 1995
460
AMPLITUDE PLOT
1OD
m
U
-
n
E
Fig. 1. Distributed collector field.
10"
10'
STORAGETANK
10"
io2 frequency (rad/s)
10 ''
PHASE PLOT
Fig. 2. Schematic diagram of collector field.
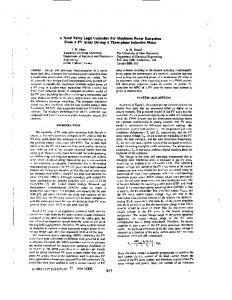
outlet temperature is adequate to enter into the storage tank. A detailed description of the solar field is provided by [XI. The collector uses a parabolic surface to concentrate a direct normal beam onto the receiver tube, which is located at the focal point of the parabola. The fluid is pumped through the receiver tube and picks up the heat transferred through the receiver tube walls. The field is also provided with a sun tracking system which causes the mirrors to revolve around an axis parallel to that of the pipe. A fundamental feature of a solar power plant is that the primary energy source, while it is variable, cannot be manipulated. The intensity of solar radiation from the sun, in addition to its seasonal and daily cyclic variations, is also dependent on atmospheric conditions such as cloud cover, humidity, and air transparency. Observations made from step responses of the plant show that the behavior of the field can be modeled by a loworder model as shown in [4], but results obtained performing PRBS (pseudo random binary sequence) tests to obtain the frequency response of the plant under different operating conditions (Fig. 3 shows the frequency response of the nonlinear distributed parameter model under four operating conditions) show that the system possesses antiresonance characteristics [l], [5], in the control bandwidth.
frequency (radk) Fig. 3. Freqnency response. of the field for different operating conditions.
Fig. 4 shows the theoretical (without taking into account thermal losses) and real Erequency response at one of these operating points. As can be seen, the amplitude decreases at certain frequencies but it does not reach zero because the field thermal losses dampen the frequency'response. The resonance modes produce downfalls in the outlet temperature and kickback type of behavior when classical controllers based on low order models of the field are used. The distributed solar collector field can be modeled by low-order frequencies are excited [4]. Acceptable behavior is obtained with conservative classical PI controllers, but when hard demands are made, oscillations in the outlet temperature appear (a wrong tuning in the controller parameters produces great variations in the control signal that excite the antiresonance modes). In [4], the behavior of the controlled system using PI controllers is improved by using an adaptive mechanism. Very good results are obtained but some kind of appear in the system response due to the antiresonance modes.
EEE TRANSACTIONS ON FUZZY SYSTEMS, VOL. 4, NO. 4, NOVEMBER 1995
461
111. Fuzzy LOGICCONTROLLER (FLC)
1on
1O'I
1 0" 10"
1o.2 frequency (rads)
10"
Fig. 4. Real and theoretical frequency responses.
The plant can be described by a set of nonlinear distributed parameter equations describing energy and mass balance. A nonlinear distributed parameter model was developed so that the control scheme could be tested by simulation. Under some conditions 121, 131, the temperature in the field can be given by the following equations
= I n O D- HIG(Tm - T,) - LHt(Tm - T f )
where the subindex m refers to the metal and f to the fluid. The rest of the parameters are as follows: p Density. C Field capacity. A Transversal area. T Outlet temperature. I Solar radiation. no Optical efficiency. H1 Overall thermal loss coefficient. D Mirror width. Ht Coefficient of metal fluid transmission. G Exterior diameter of the pipe line. L Inner diameter of the pipe line. 4 Oil flow rate. These equations are only applicable to the active zones of the field, that is, those parts of the pipeline where solar radiation is collected. Parts of the field, passive zones, exist where it is not possible to collect solar energy due to geometrical conditions as is the case of the joints between the modules. These zones constitute a considerable part of the field and they are characterized by having nil irradiance and different loss constants. The above equations were used to simulate the system in a computer dividing one of the loops into 100 pieces and using a model of concentrated parameters for each piece. The model was contrasted to the real data obtained from the field [2], 131. The parameters of the model were adjusted so that they reproduced the behavior of the system.
An FLC is commonly described by a set of fuzzy rules that constitute the control protocol. With these rules, the interconnected relationships between measurable variables and control variables can be expressed. In Fig. 5 three parts can be seen which constitute the design parameters of the FLC: the block fuzzifier; the control block (fuzzy rule base and inference procedure), and the block defuzzifier. The fuzzification interface converts the numerical values of the input variables into linguistic variables (fuzzy sets). The conversion requires scale mapping that transforms the range of values of input variables into corresponding universes of discourse. The rule-based fuzzy control algorithm provides definitions of linguistic control rules which characterize the control policy. In this case, the block includes decision making logic, which infers fuzzy control actions employing fuzzy implication and the inference rules mentioned. The defuzzification block converts the inferred control action, which interpolates between rules that are fired simultaneously, to a continuous signal. The expert knowledge usually takes the form
IF (a set of conditions are satisfied) THEN (a set of consequences can be inferred). The set of conditions (fuzzy sets) belongs to the input domain and the set of consequences to the output domain. The fact that various rules can be fired simultaneously is due to the conversion of values obtained from sensors to linguistic terms, assigning a membership function ,UA to each one. If triangular-partition rule bases are used [19], the input and output universes are subdivided using triangular membership functions of the form
, ~ ~ ) / (-a a,-1) , az+l)/(az+l - a,)
if a,-l 5 z 5 a, if at 5 z 5 az+l otherwise (1) being the membership values of A , # 0 only at the interval (u,-l,a,+l). Point a, is the unique element that has membership value 1 at A, (midpoint of A,). A triangular decomposition of a universe consists of a sequence of triangular fuzzy subsets A I ,. ,A , such that the leftmost and rightmost fuzzy regions satisfy , U A ~= 1 and P A , = 1 at its midpoints (we are assuming that the triangular decomposition forms a fuzzy partition of the underlying universe, that is, P A , ( U ) = 1 for every U belonging to the universe). A decomposition of the input and output domains that satisfies these requirements is called a TP (triangular partition) system. The inference process can be made more efficient by requiring the membership functions to be isosceles triangles with bases of the same width. These fuzzy inference systems with evenly spaced midpoints are called TPE systems. The inference mechanism in a TP or TPE system is very straightforward and efficient. As is demonstrated in [19], considering SISO (single-input single-output) systems [the extension to MIMO (multi-input multi-output) system is straightPA,(x) =
cr=l
(z - a (-z f
L
IEEE TRANSACTIONS ON FUZZY SYSTEMS, VOL. 3, NO. 4, NOVEMBER 1995
462
forward] if A, and A,+1 are two fuzzy sets (with midpoints a, and a,+l, respectively,) providing nonzero membership for z, the appropriate action for any input at an interval [a,, a,+l] using weighted averaging defuzzification is given by
z=
PA,(Z)CT
PAt
+ I A , + 1 ( x ) c s -- ~ ( C S+ I”A,+i ($1
C 0
N I T N R p
o u CT)
f az+lci- - %cs
%+I -
a2
(2) with cs and c, being the midpoints of C, and Cr (fuzzy regions in the output space). Equation (2) shows that only two completely determined constants, (es - cT)/(a,+i - a,) and (az+lcr - aic,)/(a,+i a%),are required to obtain the control action, allowing a fuzzy inference system in tabular form to be represented. The amount of computation required for processing input is independent of the number of rules with a P E system. The tabular information can be stored in a manner that permits direct addressing, avoiding searching procedures to find the appropriate “rules” in the inference table. A fuzzy associative memory (FAM) can be used instead of the table. A FAM is a k-dimensional table where each dimension corresponds to one of the input universes of the rules. The zth dimension of the table is indexed by the fuzzy sets that comprise the decomposition of the ith input domain. The FAM representation may be modified to produce a numeric inference (NI) table. This way, the indexes will represent the correspondingmidpoints of the set. The entries in the table are the midpoints of the consequent of the associated rule.
L T L S
E R
Fig. 5. Fuzzy logic inference scheme.
I Tin
Fig. 6. Fuzzy logic control scheme.
(xn)
temperature produces a change in the outlet temperature after a variable delay time (depending on the flow). One simple approach which reduces the copplexity of the model is to make use of the known operating characteristics of the field. Shudies have been made which incorporated approximate transfer functions in the feedforward term but the benefits provided were no considered to justify the added complexity or unceriainty involved. So, to account for the disturbances, a series feedforward controller was introduced [4], calculated Iv. APPLICATION OF THE FLc TO THE A C m X F&LD directly from steady-state relationships (steady-state energy The FLC exposed in previous section has been used to balance), which makes an adjustment in the flow input, aimed control the distributed solar collector field ACUREX. The FLC at eliminating the change in outlet temperature caused by has been applied in an incremental form, that is, the signal the variations in solar radiation and inlet temperature. The obtained from the FLC is the increment needed in the control calculation employed is signal to provide a desired behavior (the output universe is 0.78691 - 0.485(~ - 151.5) - 80.7 related to control increments). Uf = To define input and output signals of the FLC, some aspects ( U - T1n) have to be taken into account. where ufis the oil flow, U is the temperature set-point given by The control signal used is the oil flow. The outlet tem- the FLC, Z, is the inlet oil temperature and I is the effective perature of the plant, however, is also influenced by changes solar radiation. The feedforward is placed in series with the in system variables such as solar radiation and fluid inlet K C . temperature. Hence dynamically the outlet temperature To The control scheme is shown in Fig. 6. The error between can be expressed as a nonlinear function f of oil flow af, the output of the plant and the set point signal (e) and its solar radiation I and inlet temperature Tin. The linearized increment (Ae) are considered to be the inputs for the fuzzy model is based on partial derivatives (of the change in outlet controller. The output variable of the fuzzy controller is the temperature AT, in respect to changes A u f , AI, and AT,,) increment in the control signal (reference temperature for the feedforward controller). The fuzzy controller could directly give the control signal, but it has been chosen in incremental form to introduce integral effect in the control action and to reduce the fuzzy partition of the output domain. The partial derivatives can be considered as transfer functions TP and TPE systems have been chosen for the inference relating the variation in outlet temperature ATo to variations mechanism. Results obtained with other control strategies in oil flow A u f , solar radiation A I , and oil inlet temperature indicated that good results and some degree of robustness AT,,, respectively. could be achieved by using an FLC with TP-TPE systems. The mathematicalmodel which accounts for these additional The triangular decomposition of the input universes of influences dynamically, even when linearized, is complex, discourse can be seen in Fig. 7. As can be seen, the exespecially when considering that the variation of the inlet tremes of the input universes of discourse (corresponding
IEEE TRANSACTIONS ON FUZZY SYSTEMS, VOL. 4, NO. 4, NOVEMBER 1995
463
TABLE I
a s -L -21 -LARGE
-14 4EDIUM
-7
0
SMALL
ZERO
7 +SMALL
14 tMEDlUM
-M
-S
Z
+S
+M
+L
-L
21 +LARGE
Fig. 7. Membership functions of the antecedents (e and ne).
-M -S Z
+S
+M 10-
+L
5
(Auz,j) with a membership function p ~ ~ =~ pet , ? . pae3, where pet and pae3 are calculated by (1). The methodology used in deciding what control action should be taken results in the firing of four rules. The combination of these rules produces a nonfuzzy control action Au, which is calculated using the weighted averaging defuzzification method as mentioned before. Then, the resulting control action can be calculated by
s o -5
-10 20
E
dE
Fig. 8. Fuzzy control surface.
to e and Ae) are [-21,211. Those of the output has been chose to be [-lo, 101 (corresponding to Au), with centers [&lo, f 6 , f4,h 2 , f0.7,0]. The domains under consideration are not normalized. The discretization of the universes of discourse plays an important role in the final behavior of the controlled system. In this case, the discretization has been selected taking into account the operating range of possible oil flows (between 2 and 12 Us), the outlet temperature (with a maximum of 300 degrees), and previous knowledge of the plant dynamics. As is commented below, there exists a great experience in the control of the plant with other control approaches.This fact and the existence of the nonlinear distributed parameter model for simulation purposes allows for a good discretization of the universes of discourse and to test the controller behavior before its real implementation in the plant. This way, few changes where done when implementing the controller in the plant. In this case (two input-single output system), the rules take the form
and as in this case
cf" E;+' p ~
~= ,1, ,we~ have
i L 1 i+1
i
j
A two-dimensional FAM can also be used in this case (Table I). The controller surface obtained from the resulting NI table can be seen in Fig. 8. A. FLC Design Procedure
The first step in the design procedure was to produce the FAM table shown in Table I and the centers of Au as [ f 2 0 , f 1 5 , f 1 0 , f 6 , f 3 , 0 ] . These values were chosen based on previous experience in controlling the plant. The resulting control was simulated with the nonlinear computer model and the results shown in Fig. 9 (dotted line) were obtained. The simulations of the first FLC designed showed an undesired high overshoot. Then, we decided to diminish the centers of the FAM, taking the following new values in the intermediate design: [f13,f 1 0 , f8,f 5 , f 3 , f 1 . 2 , 0 ] . With these values and the help of the nonlinear computer model, results shown IF error is positive large in Fig. 9 (dashed line) were obtained. This result can be AND the change in error is n e g a t i v e s m a l l considered as a good one, but due to the characteristics of the solar plant, the main design objective is to achieve a THEN make the control signal change positive l a r g e response with low overshoot. This way, the centers of the where terms small, large, medium, etc., are used to describe FAM were diminished again, obtaining the definitive ones the fuzzy variables and the control action. As mentioned mentioned above ([*lo, f 6 , f4,f 2 , f0.7,0]). The simulapreviously, because of the partial matching attribute of fuzzy tion which corresponds to these values can also be seen in control rules and the fact that the preconditions of rules do Fig. 9 (solid line). This figure also includes the values of oil flow to show the control effort obtained with each one of the overlap, four rules can fire at the same time. Assuming that the algebraic product operator is used as the designs. These values have been used in the control of the conjunction operator, each rule recommends a control action distributed collector field, as shown in the next paragraph.
JEEE TRANSACTIONS ON FUZZY SYSTEMS, VOL. 3, NO 4, NOVEMBER 1995
464
200.01 195.0
-Y
e
I ._ -
,
,
,
I
.
,
,
,
,
,
,
.
,
,
,
240.01
1
,
,
,
I
,
,
,
,
,
,
I
I
230.0
220.0
190.0
210.0 185.0
0
0
I
180.0
3 I
.ga t
inlet oil temperature outlet oil temperature set point temperature
175.0 180.0
c
-final desian
170.0
..... ......
165.0 -
i
I
first design
1
1
1
11.7
local time (hours)
12.2
12.7
13.2 lccal time (hours)
13.7
14 2
Set point and outlet oil temperatures (C)
I
I
i
960.0 -
7.0
r
I
5.0
____
intermediate design
-final design first design 11.5
120
125
130 135 14.0 local time (hours)
14.5
15.0
Fig. 9. Simulation with different designs of the FLC.
E. Plant Results The proposed control scheme has been tested at the plant. First of all, one aspect in the development of the FLC used here should be stressed, that is the easiness of implementation and the very good results obtained in the first tests pedormed at the plant. This fact can be observed in Figs. 10 and 11. Fig. 10 corresponds to the step-response test carried out the April 26, 1994 (outlet oil temperature, inlet oil temperature, set point temperature, and solar radiation plots are provided). As can be seen, good set point tracking is obtained (even in cases of disturbances produced by small passing clouds at the end of the operation) with a rise time of less than nine minutes in step change of 10 degrees, and a similar response shape in all operating conditions. Fig. 11 (outlet oil temperature, inlet oil temperature, set point temperature, solar radiation, and oil flow, respectively) corresponds to another step-response test (27/04/94), covering a wide range of oil-flow conditions (from 5 to 7.5 Us). As can be seen, very good results are obtained in all cases without oscillations in the system response. These were the first two
11.7
12.2
12 7
13.2 local time (hours)
137
14.2
Fig 10. Test carried out with the FLC on Apnl 26, 1994.
tests performed in the real plant. As can be seen results were obtained with the initial design of the FLC. These curves show a small offset (less than 1.5 degrees) in the system response. The FLC has been developed using the error signal ( e ) and its increment (Ae), and the controller signal obtained is the control increment (which incorporates integral effect). This way of implementationindicates that the system response should have null steady-state error. One possible explanation for the appearance of the offset in the output signal is the use of a wrong value of the mirrors' reflectance (used in calculating the effective solar radiation) in the feedforward controller. Mirror reflectance is measured every 10 days and so, if dust has accumulated on the mirror surfaces since the previous measure, the real value of mirror reflectance can differ from the one last measured, used by the feedforward controller. This fact leads to an error in the outlet signal of the feedforward controller (oil flow demanded on the pump) that depends on the effective solar rahation. Theoretically, as the feedforward controller is placed in the control loop, this error should be corrected, but the integral term action is not fast enough to do so.
IEEE TRANSACTIONS ON FUZZY SYSTEMS, VOL. 4, NO. 4, NOVEMBER 1995
465
255.0 245.0 235.0
inlet oil temperature outlet oil temperature set point temperature
165.0
-
145.0 "
"
12.0
12.5
"
"
"
13.0 13.5 14.0 local time (hours)
"
14.5
I
"
15.0
;'
-,i'
135.0l
15.5
...................................
.
155.0
140.01 11.5
.--------
175.0 -
"
"
"
"
"
"
"
Set point outlet and inlet oil temperatures (C) Set point, outlet and inlet oil temperatures (C)
950.0
960.0
900.0 950.0
i-----**T---il 1 -I
940.0
Q-
930.0
Q
g
P k
a
800.0
-
0
920.0
750.0 -
910.0
a
890.0
700.011.9 650.0
880.0 11.5
12.0
12.5
13.0 13.5 14.0 local time (hours)
14.5
15.0
12.4
12.9
13.4
13.9
14.4
14.9
15.4
15.9
local time (hours)
15.5
7.0
h
7.0
-r
6.5
2-
6.0
5.5
I
5.01 11.5
'
'
12.1
"
12.6
'
'
'
'
13.2
'
"
13.7
'
"
'
14.3
' 14.8
'
"
I
4.0l 11.9
"
12.4
"
12.9
"
13.4
"
13.9
"
14.4
"
14.9
"
15.4
'
. 9
local time (hours)
I
15.4
local time (hours)
Oil flow (l/s)
Fig. 11. Test carried out with the F W on April 27, 1994.
Fig. 12. Test carried out with the FLC on June 22, 1994.
The dependance on effective solar radiation can be observed in Fig. 11, in which the offset signal (outlet temperatureset point temperature) is positive when the solar radiation is increasing and negative when it is decreasing, achieving
a value near zero at the solar midday. Even though this small offset is not important in terms of heat transference, some variations in the initial implementation were performed to achieve faster responses without offset. The values used in the inference table were slightly modified and two new rules
466
IEEE TRANSACITONS ON FUZZY SYSTEMS, VOL 3, NO t4, NOVEMBER 1995
q
3W 0
255.0
.....
280 0
h
260 0
-e
I
0 m m I
3
2400
s
3
2200
-g -
Q
2 m +
8 2
2000
245.0
0
-
I
-
180 0
a 0
/
160 0
/
fuzzy controller
0
I '
/ I
I
I 4 0 0'
.
, 10.5
,
,
.
11.5
,
.
,
,
13.5
12.5
, 14.5
15.5
235.0 1
local time (hours)
Set point outlet and inlet oil temperatures (C) 950.01
,
,
,
,
,
,
,
,
,
,
Set point - outlet oil temperatures (C) ,
900 0
900.0
870.0
850 0
$
2
N
-
840.0
$- 810.0
8000
-
7500
780.0
s
V
e 3
1
CB0.0
$
7000
750.0
ul
m
7m.o
650 0
t
600.0 550.01 9.5
"
10.5
11.5
,
I
.
I
12.5 13.5 lxal time (hours)
,
I
14.5
.
690.0
'1
m.0
I 15.5
630.0
!
10.7
112
11.7
122
127
132
13.7
142
local time (hours)
Solar radiation (W/m2)
Solar radiation (W/m2)
L r3
9.0
8.0
.0
'
2
2 3'0 09 5
105
115
125
13.5
14.5
7.0
6.0
15.5
local time (hours)
Oil flow (l/s)
Fig. 13. Test carried out with the F'LC on December 21, 1994.
were added in the FLC implementationto increase the integral action. These rules take the form IF abs ( e k ) > 2 AND e k > 0 AND e k - 1 > 0 AND . . . AND ek--4 > 0 THEN auk = auk 4, where e k is the
+
actual error signal, e k - 1 the previous one, and so on. Auk is the actual control increment, abs indicates the absolute value, and 4 = 4 ek-%/100. The same rule changing the greater than sign for less than sign was also implemented.
IEEE TRANSACTIONS ON FUZZY SYSTEMS, VOL. 4, NO. 4, NOVEMBER 1995
using the FLC with these atmospherical and environmental conditions are shown in Fig. 14. The operation corresponds to a clear day with the perturbation produced by one passing cloud. Fig. 15 shows a comparison to a fixed PI controller and the mentioned gain-scheduling GPC controller. The fixed PI controller behaves well for the conditions corresponding to those used for design purposes, but for other conditions, the performance deteriorates. The behavior of the FLC and the gain-scheduling GPC is very similar with similar rise times. The small overshoot (less than one degree) of the FLC can be avoided simply by appropriately modifying the elements of the table, but it has not been done because small overshoots are permitted in the system operation.
255.0
-0 VI
e
E
E“
2 ._ -
2
245.0
r m 0
-
c
P 4-
-fuzzy controller
VI
_ - - _gain-scheduling GPC fixed PI controller 235.0
?
10.7
11.2
11.7
12.2 12.7 local time (hours)
461
13.2
13.7
14.2
Fig. 15. Comparison between control approaches.
V. CONCLUSION A fuzzy controller has been applied to a distributed collector field of a solar power plant. The process is characterized by high perturbations and changes in dynamics caused by clouds and operating conditions. The fuzzy controller showed itself to possess a high degree of robustness producing very good results in spite of changes in solar radiation, inlet oil temperature, and operating conditions. The commissioning time of the controller was very small and acceptable modes of behavior were obtained from the first tests.
Results obtained by performing these modifications are shown in Figs. 12 and 13, which shows the outlet oil temperature, inlet oil temperature, set point temperature, solar radiation, and oil flow. The test of Fig. 12 provides the response during a whole day’s operation on June 22, 1994. At the start of the operation, the inlet oil temperature changes because the oil is recirculated until it reaches the same temperature as the tank, and a step-procedure is implemented ACKNOWLEDGMENT to reach the first operating set point. Once the field reached 235”C, step changes of 15°C were given to the reference. The authors would like to acknowledge Prof. J. Aracil of the As can be seen, fast responses were obtained (rise time of E.S.I. of Seville for his helpful comments and suggestions as about seven-eight minutes) with small overshoots (less than well as many helpful suggestions by the reviewers which have two degrees) and the offset was also eliminated. The control been incorporated into the manuscript. The authors would also system was also able to reject the disturbances caused by like to thank P. Balsa from the PSA for his help in carrying changes in the solar radiation in the inlet oil temperature that out the tests. was changed during the experiment. Fig. 13 corresponds to a test carried out the December 21, REFERENCES 1994. As can be seen very good results has been obtained [l] M. Berenguel and E. F. Camacho, “Frequency-based adaptive control under all operating conditions in spite of the heavy perturbaof systems with antiresonance modes,” in Proc. ACASP ’95 Symp., tions produced by changes in the solar radiation (200 watts/m2 Budapest, Hungary, vol. 1, pp. 195-200, 1995. [2] M. Berenguel, E. F. Camacho, and F. R. Rubio, “Simulation software drops) caused by clouds and in the inlet oil temperature (45°C package of the acurex field,” E.S.I. of Seville, Spain, Internal Rep., 1993. increment). [3] E. F. Camacho, F. R. Rubio, and J. A. Gutierrez, “Modeling and
C. Comparison to Other Control Approaches As has been mentioned, one of the reasons for applying FLC to the solar power plant was the very good results obtained with other control approaches and in principal with a gain-scheduling GPC. So, to compare the behavior of both controllers, simulations with the nonlinear distributed parameter model described by the equations of Section I1 [2,] [3], were performed. Due to the fact that solar radiation and inlet oil temperature conditions cannot be reproduced exactly, it is very difficult to compare the behavior of the proposed FLC to that of other types of controllers (in this case a gain-scheduling GPC) in the real plant. To provide an indication of the improved performance obtained, however, the solar radiation and the inlet oil temperature conditions for a test on the plant of a fixed PI controller were used for a simulation study. Results obtained
[4] [5] [6] [7] [SI [9] [lo] [11]
simulation of a solar power plant with a distributed collector system,” in Proc. Int. IFAC Symp. Power Syst. Modeling Contr. Applicat., Brussels, 1988. E. F. Camacho, F. R. Rubio, and F. M. Hugues. “Self-tuning control of a solar power plant with a distributed collector field,” IEEE Contr. Syst. Mag., pp. 72-78, Apr., 1992. E. F. Camacho, M. Berengnel, and F. R. Rubio, “Application of a gain scheduling generalized predictive controller to a solar power plant,” Contr. Eng. Practice, vol. 2, no. 2, pp. 227-238, 1994. E. F. Camacho, M. Berenguel, and C. Bordhs, “Adaptive generalized predictive control of a distributed collector field,” IEEE Trans. Contr. Syst. Tech., vol. 2, no. 4, pp. 462-467, 1994. E. F. Camacho and M. Berenguel, “Applicationof generalized predictive control to a solar power plant,” in Proc. 3d IEEE Con& Contr. Applicat., vol. 3, Glasgow, UK, 1994, pp. 1657-1662. A. Kalt, “Distributed collector system plant construction report,” IEMSSPS Operating-Agent, DFVLR, Cologne, 1982. M. Kickert and R. H. Van Nauta Lemke, “Application of a fuzzy controller in warm water plant,” Automatica, vol. 12, pp. 301-308, 1976. P. J. King and E. H. Mamdani, “The application of fuzzy control systems to industrial processes,” in Proc. IFAC World Congr., Boston, MA, 1974. M. P. Larsen, “Industrial application of fuzzy logic control,” in Fuzzy Reasoning and Its Applications, E. H. Mamdani and B. R. Gaines, Eds. New York Academic, 1981, pp. 335-342.
468
[12] J. R. Layne and K. M. Pasino, “Fuzzy model reference learning control for cargo ship steering,” IEEE Contr. Syst. Mag., pp. 23-34, Dec. 1993. [13] C. C. Lee, “Fuzzy logic in control systems: fuzzy logic controller-Part I,” IEEE Trans. Syst., Man, Cybem., vol. 20, no. 2, pp. 404-418, 1990. [14] -, “Fuzzy logic in control systems: fuzzy logic controller-Part TI,” IEEE Trans. Syst., Man, Cybem., vol. 20, no. 2, pp. 419-435, 1990. [15] E. H. Mamdani, “Application of fuzzy algorithms for control of a simple dynamic plant,” in Proc. Inst. Elect. Eng., vol. 121, 1974, pp. 1585-1588. [16] F. R. Rubio, R. Carmona, and E. F. Camacho, “Adaptive control of The ACUREX field,” The IEMSSPS Solar Thermal Power Plants, vol. 2, P. Kesserlring and C.S. Selvage, Eds. New York Springer-Verlag, 1982,
IEEE TRANSACTIONS ON FUZZY SYSTEMS, VOL. 3, NO 4, NOVEMBER 1995
pp. 5.2.1-5.2.18.
[I71 E. M. Scharf, N.J. Mondie, and E. H. Mamdani, “A Self-organizing algorithm for the control of a robot arm,” Queen Mary College Umversity of London, Technical Rep., 1983.
[Is] E. M. Scharf, “Fuzzy logic could redefine robot control,” Robotica, pp. 11-13, Feb. 1985.
[19] T. Sudkamp and R. J. Hammell II, “Interpolation, completion, and learning fuzzy rules,’’ IEEE Trans. Syst., Man, Cybem., vol. 24, no. 2, 1994. [20] S. Yasunobu, S. Miyamoto, T. Takaoka, and H. Ohshiroa, “Application of predictive fuzzy control of automatlc train operatlon controller,” in Proc. lECON ’84, 1984.