Number: 12 Year: 2016, Pages: 149-158
ISSN: 1304-7981
Received: 15.05.2016 Accepted: 15.09.2016
http://jnrs.gop.edu.tr
Invited Editor: Mahmut Hekim Area Editor: Cem Emeksiz
Measurement and Evaluation of Electromagnetic Pollution Levels in Ünye District of Ordu
Çetin KURNAZa,1 (
[email protected]) Murat Cem BOZKURTb (
[email protected]) a
Ondokuz Mayis University, Engineering Faculty, Department of Electrical and Electronics Engineering, 55139, Kurupelit, Samsun, Turkey. b Ordu University, Ünye Vocational Higher School, Ünye, Ordu, Turkey.
Abstract – In parallel with the technological developments and substantial growth in the use of wireless communication services over the last few years, the number of base stations has therefore increased. This increment causes more inevitable exposed electromagnetic radiation (EMR) levels. Thus, measurement and evaluation of exposed EMR levels emitted by base stations have become more crucial than before for human health. For this reason, in this study electromagnetic radiation (EMR) measurements were conducted on four different days in Unye which is one of the most populated districts of Ordu. Two of the measurements were performed before the deployment of fourth Generation (4G) system while the rest two done after the deployment using PMM 8053 EMR meter. Short term measurements were collected at 47 different locations while the 24 hours long measurement was recorded at a chosen location. According the total 189 measurement results, the maximum electric field strength (E) is 4.52 V/m. Even though the measured E levels are below the limits that are determined by the International Commission on Non-Ionizing Radiation Protection (ICNIRP) and Information and Communication Technologies Authority (ICTA); it is can be considered as high for the countries where the lower limits are applied. It can also be concluded from the results that deployment of 4G system causes an increment about 9% in EMR levels.
Keywords Electric field strength; Electromagnetic radiation (EMR), Electromagnetic (EM) measurement; Base station, 4G.
1. Introduction Electromagnetic (EM) waves are radiated from many sources, both natural and man-made, that produce electromagnetic pollution. Radio and TV transmitters, base stations, power 1
Corresponding Author
Journal of New Results in Science
12 (2016) 149-158
150
lines, transformers, electrical household appliances medical equipment and etc. cause EM pollution. The use of electromagnetic waves increases due to the technological developments; therefore, people are exposed unavoidably to higher levels of electromagnetic waves in their daily lives. The substantial growth in the use of mobile communication services also causes an increase in the exposed EMR levels. In cellular systems that are a form of the wireless communication systems, users communicate each other over base stations. Increasing demand for communicating from any place, multimedia usage push cellular system operators to install more base stations as each base station works within a limited geographical region and for limited number of users [1-2]. There are around 100 thousand base stations in Turkey right now, but with the establishment of 4G systems on 1 April 2016, the estimated number of base stations will be around 130 thousand. Because each base station is an EMR source, the increase in the number of base stations result in a long-term, probably lifelong exposure. Base stations operate at frequencies below 300GHz, which is within the non-ionizing spectrum. However the potential health effects they may cause is an important research topic [3]. There are international standards and limits on effects of EMR on human health. Commonly accepted limits in many countries including European Union and USA are recommended by ICNIRP [4], which is recognized by the World Health Organization (WHO). Turkey applies the limits which are determined in accordance with ICNIRP’s limits [5]. Measuring and evaluating the EMR emitted by base stations and cellular systems, and controlling their compliance with standards/limit values are at great importance for human health and help to take precautions. Therefore many recent researches have been carried out on this subject [6-12]. The goal of this study is hence to determine the EMR levels in Unye which is the most populated (120000) district of Ordu based on the short and long term EMR measurements conducted at differently populated parts of Unye using PMM 8053 EMR meter [13]. The short term measurements were performed four times (twice before and twice after the deployment of 4G) at 47 different locations. Considering that the measurements results may be affected by the factors such as number of users, base station usage density, the distance from the base station and the existence of line of sight path, measurements were repeated on four different days at the same locations. In order to evaluate the EMR levels caused by a base station; measurements were recorded during 24 hours at a fixed location.
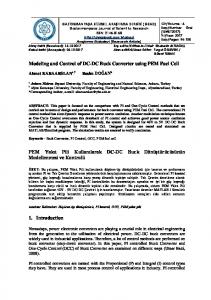
2. Measurement of Electric Field Strength Many recent researches have been focused the possible detrimental effects of EMR on human health. There are international standards and limits on effects of EMR on human health. The limits are recommended by the International Commission on Non-Ionizing Radiation Protection (ICNIRP), which is recognized by the World Health Organization (WHO), and based on the assumption of 24-hour exposure [4]. In Turkey, regulations are recommended by Information and Communication Technologies Authority of Turkey (ICTA), and the limits are determined in accordance with ICNIRP’s limits. The limits of electrical field strength (E) are shown in Table I based on ICNIRP and ICTA guidelines on exposure limits [4-5], while the changes in E limits with frequency are given in Fig. 1.
Journal of New Results in Science
12 (2016) 149-158
151
TABLE I. Reference levels for general public exposure to time-varying electric fields for ICNIRP and ICTA E (V/m)
Frequency range (MHz) 0,010 – 0,15 0,15 – 1 1 – 10 10 – 400 400 – 2000 2000 - 60000
ICNIRP 87 87 87/f 1/2 28 1,375f 1/2 61 f is frequency in MHz
ICTA 65,25 65,25 65,25/f 1/2 21 1,03f 1/2 45,75
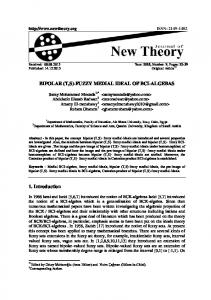
Fig 1. The ICNIRP and ICTA guideline for public exposures as a function of carrier frequency According to Table I and Fig. 1; the limits are 30,9 (V/m) for 900 MHz base stations, 43,69 (V/m) for 1800 MHz base station, 45,75 (V/m) for both 3G systems which is 2100 MHz, and 4G systems that operates at 2600 MHz. These values are the total limit values for a medium, the 1/4 of the limit values for a single device for injunctive relief taking environment and human health into account. The limits are given for exposure averaged over a 6 minute interval. Each country has its own determined limits. The USA and some European countries use limits determined by the ICNIRP, while other European countries like Switzerland and Italy use 1/10 of the ICNIRP’s values as a limit. In this study, short and long term EMR measurements were conducted in Unye district of Ordu on different days and different locations, and then the necessary evaluations were made. In Fig. 2. each numbered red dot indicates the measurement location roughly. The measurements were performed considering cellular systems usage density, line of sight, distance from a base station, before and after the deployment of 4G. The measurements before 4G (M1, M2) were taken on 18 November and 12 December 2015, while for after 4G (M3, M4) were recorded on 1 August and 21 August 2016.
Journal of New Results in Science
12 (2016) 149-158
152
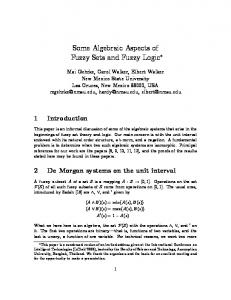
Fig. 2. Measurement locations The EMR measurements were conducted using PMM 8053, and the example images of the measurement process are shown in Fig. 3. PMM 8053 can measure the total E in the band between 100kHz - 3GHz with EP-330 isotropic electric field probe [13]. Sensor measurement range of a PMM 8053 is 0.3 V/m - 300 V/m, the maximum, the minimum and spatial and temporal averages of E (V/m), magnetic field strength (A/m) and power flux density (W/m2), can be measured. Since the EMR level may vary with time and location, measurements were performed at 47 different locations and on four different days. In each measurement, the maximum E (Emax) and average E (Eavg) were recorded. Based on the international standards and ordinances released by ICNIRP and ICTA, the average E value at a location was recorded after six minutes long measurement [5].
Fig. 3. EMR measurements with PMM 8053
Journal of New Results in Science
12 (2016) 149-158
153
3. Measurements Results In Fig. 4.a the maximum E (Emax) that recorded four times at 47 different locations are illustrated, while the average E (Eavg) are shown in Fig. 4b. In figures the measurement time axis represents the four different measurements (M1, M2, M3, and M4) conducted on different dates. It is seen from the results that, E is related to factors such as measurement location, distance from the base station, and existence of line of sight path, base station output power, and the number of active users. The Emax is 4.52 V/m and recorded in the third measurement at location 19 (L19). For the same location the rest three recorded Emax are 0.65V/m, 0.56 V/m and 2.37 V/m respectively. The reasons of the differences between the measurements may be the deployment of 4G base stations, the change in the instantaneous mobile communication traffic. Statistical properties of all measurement data are summarized in Table II briefly.
Fig. 4. a) Maximum (Emax) b) Average (Eavg) Es versus locations
Journal of New Results in Science
12 (2016) 149-158
154
TABLE II. Statistical properties of the measured data
M1 M2 M3 M4
M1 M2 M3 M4
Max. 3.66 3.39 4.52 2.54
Emax (V/m) Mean 1.28 1.03 1.30 1.22
Std. 0.86 0.83 0.91 0.54
Max. 2.57 2.44 1.78 1.37
Eavg (V/m) Mean 0.64 0.54 0.68 0.58
Std. 0.62 0.63 0.40 0.32
The changes in Emax and Eavg values with before and after the deployment of 4G are given in Fig.5. The average Emax is 1.155 V/m before 4G, which with approximately 9% increment reaches to 1.26 V/m after 4G. For the case of Eavg corresponding values are 0.59 V/m and 0.63 V/m with an increment of 7%. Considering both Emaxs and Eavgs; the deployment of 4G causes significant increase in E levels.
Fig. 5. a) Emax, b) Eavg values for before and after 4G After the completion of short term E measurements which collected four times at 47 locations before and after 4G, long term measurement was conducted at L18 during 24 hours with a sampling period of 4 seconds. The distance between L18 and the base station is approximately 15 m, and there is a LOS path between them. Fig. 6 shows the measurement point at L18.
Journal of New Results in Science
12 (2016) 149-158
155
Fig. 6. Long term EMR measurements at L18 The results of 24 hours long measurements are given in Fig.7. The measurements were started at 14.00 and stopped at 14.00 on the next day. As seen from the figure that, the measured E levels change with time depending on usage density of the base station. The E levels recorded between the hours 14:00 – 24:00 of the first day and between the hours 08:00 – 14:00 of the next day are higher than those recorded between the hours 01:00 – 08:00 during which the number of users and usage density were comparatively lower.
Fig. 7. E levels during a day for 18th location
The maximum E value recorded during the 24 hours measurement is 2.34 V/m, while the average and standard deviation of E are 1.65 V/m and 0.29 V/m respectively. The histogram and the generalized probability density function of 24 hours E measurement results are illustrated in Fig. 8.
Journal of New Results in Science
12 (2016) 149-158
156
Fig. 8. The histogram and the density function of 24 hours E measurements In order to identify the change in E with time better, different curve fitting methods are applied to data that recorded at L18. The resulting equation for fifth degree Gaussian is given in Eq. 1. while the fitted curve obtained through Eq.1 is shown in Fig. 9.
E(t) 1,137e
( t 218,3)/907,7
2
1,336 e
( t 4589)/856,2
1,258 e
( t 5871)/639,9
2
0,2993 e 1,796 e
( t 1027)/561,9
( t 1968)/2117
2
2
2
(1)
The R-squared value for the fitted curve is 0.7422, and the RMSE (root mean square error) is 0.1487. The use of this equation helps to determine the change in E levels with time easily.
Fig. 9. The distribution of measurement data along with the fitted curve
Journal of New Results in Science
12 (2016) 149-158
157
4. Conclusions In this study, short term E measurements were performed at 47 different locations while the long term measurement was recorded at a specific location in Unye district of Ordu. The short term measurements were taken as twice before and twice after 4G. It is seen from the measurement results that E levels may vary with the measurement location and time, and the maximum recorded Emax is 4.52 V/m while the maximum Eavg is 2.57 V/m. The results also demonstrate that the deployment of 4G yielded up to 9% increase in E levels. It can be concluded from the long term measurements that base station usage density causes significant change in E levels with time.
References A. Mousa, “Electromagnetic radiation measurements and safety issues same cellular base stations in Nablus”, Journal of Engineering Science and Technology Review, vol. 4, no. 1, pp. 35-42, 2011. [2] O. Genç, M. Bayrak, and E. Yaldız, “Analysis of the effects of GSM bands to the electromagnetic pollution in the RF spectrum”, Progress in Electromagnetics Research, vol.101, pp.17-32, 2010. [3] R. W. Y. Habash, “Bioeffects and Therapeutic Applications of Electromagnetic Energy”, CRC Press, 2007. [4] ICNIRP Guidelines, “Guidelines for Limiting Exposure to Time-Varying Electric, Magnetic, and Electromagnetic Fields (up to 300GHz)”, International Commission on Non-Ionizing Radiation Protection, Health Physics vol.74, no.4, pp.494-522, 1998. [5] Information and Communication Technologies Authority of Turkey, “Ordinance change on By-Law on Determination, Control and Inspection of the Limit Values of Electromagnetic Field Force from The Electronic Communication Devices According to International Standards”, Law no.29497, 9 October 2015 [6] Ç. Kurnaz, “An Emprical Modelling of Electromagnetic Pollution on a University Campus”, The Applied Computational Electromagnetic Society Express Journal, vol.1, no.2, pp.76-79, 2016. [7] B. K. Gül, Ç. Kurnaz, and B. K. Engiz, “Measurement and Evaluation of Electromagnetic Pollution in Ondokuz Mayıs University Kurupelit Campus in Samsun, Turkey”, Third International Conference on Advances in Information Processing and Communication Technology, pp.80-84, Rome, Italy, 2015. [8] S. Miclaus, and P. Bechet, “Estimated and Measured values of the Radiofrequency Radiation Power Density around Cellular Base Stations”, Environment Physics, vol. 52, no. 3–4, pp. 429–440, 2007. [9] L. Seyfi, “Measurement of electromagnetic radiation with respect to the hours and days of a week at 100kHz–3GHz frequency band in a Turkish dwelling”, Measurement, vol.46, no.9, pp.3002-3009, 2013. [10] P. Baltrenas, and R. Buckus, “Measurements and analysis of the electromagnetic fields of mobile communication antennas”, Measurement, vol.46, no.10, pp.39423949, 2013. [11] M. Koprivica, V. Slavkovic, N. Neskovic, A. Neskovic, “Statistical Analysis of Electromagnetic Radiation Measurements in the Vicinity of GSM/UMTS Base Station Installed on Buildings in Serbia”, Radiation Protection Dosimetry, pp.1-14, 2015, doi: 10.1093/rpd/ncv372. [1]
Journal of New Results in Science
12 (2016) 149-158
158
[12] T. Karadag, M. Yüceer, and T. Abbasov, “A Large-Scale Measurement, Analysis And Modelling of Electromagnetic Radiation Levels in the Vicinity of GSM/UMTS Base Stations in an Urban Area”, Radiation Protection Dosimetry (2015), pp. 1–14, doi:10.1093/rpd/ncv008. [13] PMM 8053, www.pmm.it/docs/8053en1001.pdf (September 15, 2016)