GARUDA: A System for Large-Scale Mining of Statistically Significant Connected Subgraphs 1
Satyajit Bhadange1 Akhil Arora2∗ Arnab Bhattacharya1 Dept. of Computer Science and Engineering, Indian Institute of Technology, Kanpur, India 2 Text and Graph Analytics, Xerox Research Centre India, Bangalore, India 1
{satyab,
arnabb}@cse.iitk.ac.in
ABSTRACT Unraveling “interesting” subgraphs corresponding to disease/crime hotspots or characterizing habitation shift patterns is an important graph mining task. With the availability and growth of large-scale real-world graphs, mining for such subgraphs has become the need of the hour for graph miners as well as non-technical end-users. In this demo, we present GARUDA, a system capable of mining large-scale graphs for statistically significant subgraphs in a scalable manner, and provide: (1) a detailed description of the various features and user-friendly GUI of GARUDA; (2) a brief description of the system architecture; and (3) a demonstration scenario for the audience. The demonstration showcases one real graph mining task as well as its ability to scale to large real graphs, portraying speedups of upto 8–10 times over the state-of-the-art MSCS algorithm.
1.
INTRODUCTION
The rapid proliferation of graph data starting from social and web networks to road networks, knowledge graphs, biological interaction networks, and chemical compounds has increased the demand for graph mining and querying techniques. Given a graph database of small/moderately sized graphs or a single large graph, the aim of graph querying systems is to find (sub)graphs similar to the query graph [6, 8]. In contrast, graph mining, with the aim to automatically find subgraphs, without any input query graph, that are “interesting” according to some criteria defined by the application [2, 3], is a relatively complex task. While there exists considerable research on mining patterns from graph databases [5, 7], attempts on mining (sub)patterns from a single large graph are comparatively lesser [2, 3]. Moreover, a large fraction of the developed techniques [5] have focused on simple monotonic objective functions (e.g., frequency), while techniques incorporating more complex functions such as p-value, z-score, etc. are relatively less. This is mainly due to the fact that the anti-monotonicity property cannot be employed under the latter to devise effective pruning strategies. Thus, despite the rich body of literature on graph mining featuring ∗
Corresponding Author: Akhil Arora
This work is licensed under the Creative Commons AttributionNonCommercial-NoDerivatives 4.0 International License. To view a copy of this license, visit http://creativecommons.org/licenses/by-nc-nd/4.0/. For any use beyond those covered by this license, obtain permission by emailing
[email protected]. Proceedings of the VLDB Endowment, Vol. 9, No. 13 Copyright 2016 VLDB Endowment 2150-8097/16/09.
2
[email protected]
several interesting formulations, a common limitation is their inability to mine statistically significant connected subgraphs from a single large underlying graph. Significant Subgraph Mining. In this field, we recently proposed the first-ever and only technique, MSCS, to mine top-k statistically significant connected subgraphs from a single large vertex labeled graph [2]. Since the number of possible subgraphs is generally exponential in the size of the graph and techniques employed to mine from a single large graph can be easily extended to that for graph databases (usually comprising multiple small graphs) but not vice versa, MSCS handles a more generic and harder setting. Formally, given an undirected unweighted vertex-labeled graph with the vertex labels following a background distribution (discrete/continuous), the aim is to unravel subgraph(s) whose vertex labels deviate significantly from the expected distribution. The deviation is measured using the chi-square statistic that computes the (squared and normalized) difference between the expected number of labels and their observed values. The chi-square statistic is independent of the size of the subgraph and captures the statistical significance (higher chi-square necessarily means lower p-value and vice versa) when the labels on the vertices are assumed to be independent. More generally, the MSCS algorithm can mine the top-t set of significant subgraphs. Most graph mining applications starting from hotspot detection, frequent subgraph detection, spam detection, network anomaly detection to characterizing habitation and disease spread patterns also assume vertex labeled graphs and can be modeled using statistical significance as highlighted in [2]. Mining Significant Connected Subgraphs (MSCS). The MSCS technique for mining statistically significant connected subgraphs from a single large graph, proposed by us in [2], has three main steps. First, a supergraph is constructed from the original graph by collapsing vertices along contracting edges. An edge is contracting if its two end vertices have the same label (for the discrete case) or the combined chi-square value of its two end vertices is greater than the individual values (for the continuous case). If the original graph is dense enough (m & O(n log n) where m and n are the number of edges and vertices respectively), the resulting supergraph is small (proof in [2]). Otherwise, as an optional second step, the supergraph is reduced further to make it small enough. Once the supergraph is reduced to a small enough size, a brute-force algorithm is applied to find the connected subgraphs with the largest chi-square values. The overall flow is shown in the middle block of Fig. 1. While the first step, i.e., supergraph construction, does not affect the optimality of the quality of the result (proof in [2]), the subsequent step of supergraph reduction introduces approximation. Supergraph construction, which runs in time linear in the size of the graph (O(m + n)), is an important step of the MSCS algorithm
1449
Algorithm 1 PAMSCS: Parallel Super Graph Construction
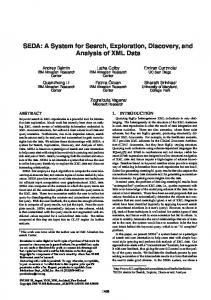
Figure 1: Architecture of the GARUDA system. as shown in [2]. Hence, to enhance the scalability, we targeted this step and made a parallel implementation (PAMSCS) of the same. We describe the details in Section 2. Demonstration Features. We have incorporated MSCS in a prototype implementation, GARUDA, using GraphX [4] on Apache Spark. GARUDA runs as a web-service featuring a GUI to enable users mine large-scale real-world graphs. The various features are visually and interactively showcased during the demonstration, as described in detail in Section 3. These include (a) effective analysis and visualization of real-world graphs, (b) flexibility to the end-user to upload personalized graphs, analyze them and download the results, (c) create random graphs using various models, and employ various filters for mining subgraphs, and (d) study effects of graph parameters on the mining results by synthetically generating graphs of varying parameters. To the best of our knowledge, we are the first to build and demonstrate such a system. GARUDA is functional and accessible as a web-application1 . Additionally, a complete video of GARUDA in operation is available at the project website [1].
2.
GARUDA SYSTEM
The complete architecture of the GARUDA system is shown in Fig. 1.2 GARUDA comprises of three layers: (1) A data processing layer housing the core storage and computational capabilities responsible for scalability and performance; (2) A novel MSCS layer dictating the logic for mining significant subgraphs; and (3) An interaction layer responsible for delivering the results to the end-user through an interactive and flexible visualization via a web-service and a back-end database. The highlight of the GARUDA system is that it is a free service for graph miners and domain experts with facilities to scalably perform analyses on their personal graph data with effective visualizations. GARUDA intelligently congregates the novel and state-ofthe-art significant subgraph mining algorithm (MSCS) of [2] with one of the most scalable and popular graph engines, GraphX [4] on Apache Spark to produce PAMSCS. Through GARUDA, the algorithms leverage the distributed in-memory architecture of Spark and, thus, facilitate the use of modern machinery to portray superior performance over the asymptotic efficiency and scalability offered by the algorithms in [2].
2.1
Parallel Super Graph Construction
As mentioned in [2], the super-graph construction method acts as one of the most important steps in the entire process of mining statistically significant connected subgraphs. The reason for this 1 2
www.cse.iitk.ac.in/users/sigdata/GARUDA/garuda demo This and other figures look better in color on digital displays.
Input: Input Graph G = (V, E) Output: Super-Graph Gs = (Vs , Es ) 1: Make a copy of the original graph; Gs (Vs , Es ) ← G(V, E) 2: for all edges e = (u, v) ∈ Es do in parallel 3: if e is non-contracting then 4: Delete e from Gs 5: for all vertices v ∈ Vs do in parallel 6: Initialise v.cid ← v.id 7: if ∃ neighbor w of v such that w.cid < v.cid then 8: v.cid ← w.cid 9: for all vertices v ∈ Vs do in parallel 10: if v.id 6= v.cid then 11: Delete v from Gs 12: for all edges e = (u, v) ∈ E do in parallel 13: if u.cid 6= v.cid then 14: su ← w ∈ Vs such that w.id = u.cid 15: sv ← w ∈ Vs such that w.id = v.cid 16: Add super-edge es = (su , sv ) to Gs
17:
return Gs (Vs , Es )
is three-fold: (1) the super-graph construction step is extremely fast as it runs in time linear in the size of the graph; (2) the results mined from the super-graph possess correctness guarantees on quality; and (3) with dense-enough graphs, the super-graph size is small thereby allowing the na¨ıve brute-force algorithm to be feasible directly on the super-graph without the need of the complex reduction step, as indicated in Fig. 1. The density of the input graph plays a central role in the scalability and optimality of the mining task. The threshold of density beyond which the supergraph size becomes small is O(n log2 n) [2]. Since many real networks such as knowledge graphs and social networks fall in this category, improvement in the super-graph construction step significantly contributes in making the state-of-theart MSCS algorithm scalable and feasible. To this end, we have developed a parallel algorithm for super-graph construction (Algorithm 1). The overall algorithm is called PAMSCS. The algorithm starts off by deleting edges that are not contracting (defined as in Section 1) from a copy of the graph (lines 1-4). The connected component id v.cid for every vertex v is then assigned to be the lowest id among itself and all its neighbors (lines 5-8). Next, all the vertices whose cid does not match with its vertex id id are deleted (lines 9-11). Thus, for each connected component, only a single vertex (the one with the lowest id) remains. After that, the algorithm processes each edge e ∈ E of the original graph G in parallel (lines 12-16). If the end vertices u and v of an edge e belong to different components, then they become part of the supervertices su and sv respectively (lines 13-15). The super-vertices su and sv are the vertices in Vs such that su .id and sv .id are same as u.cid and v.cid respectively. The super-edge es between su and sv is finally added to the super-graph Gs (line 16). In the original MSCS algorithm, the super-graph construction was linear in the size of the graph, O(m + n) for a graph with n vertices and m edges [2]. Algorithm 1 improves the running time to O(m + n)/p where p is the degree of parallelization. Since in practice, many graphs are dense enough (i.e., m & O(n log n)), the number of output super-vertices are small, and in some cases, constant. (The proof is in [2] and is beyond the scope of this paper.) Hence, the time complexities of the other stages of MSCS can be subsumed, thereby enabling the entire mining process to run in expected linear time.
2.2
Extension to Generic Filters
The GARUDA system is not restricted to finding the top-t set of significant subgraphs, i.e., the subgraphs possessing the top-t highest chi-square values, alone. We have added the capabilities for addressing a few more variants of graph mining such as: (a) find-
1450
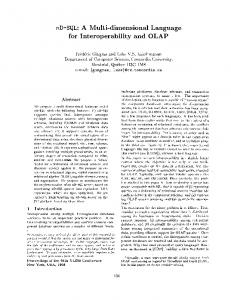
(a) Choosing options. (b) Output: Significant subgraphs. (c) One particular subgraph. Figure 2: Analysis of real-world graphs: The North-East Biodiversity Dataset. ing all the connected subgraphs whose chi-square values are greater than or equal to a user-defined threshold τ , and (b) finding top-t significant connected subgraphs by considering only those subgraphs with at least a user-defined size threshold, s, number of nodes. These problems are important in their own right. For example, in a disease spread network, the government may want to identify all the regions that have a high disease occurrence or, in other words, a large chi-square greater than a threshold. Similarly, while mining large complex chemical compounds, only those parts that have at least a threshold number of atoms may be meaningful.
3.
DEMONSTRATION
As part of the demonstration, we will engage the audience with a variety of visual scenarios crafted to highlight (1) the MSCS algorithm, (2) our interactive and visual web-service (using d3.js library) which significantly enhances the ability to analyze real datasets, (3) the effect of various graph properties on the mining process, and (4) the superior performance introduced as a result of the GARUDA system. The North-East Biodiversity data provided by the Indian Space Research Organisation (ISRO) [2], and real graphs taken from the SNAP repository (https://snap.stanford.edu/ snap/) are used as examples to explain these scenarios.
3.1
Real Data
Similar to any mining task, statistically significant subgraph mining is an exploratory analysis with the aim to output interesting mined patterns to an end-user (possibly a domain expert). Therefore, the capability for a simple, intuitive and effective visualization is considered to be one of the key pillars of any such system. With statistically significant subgraph mining being applicable in a host of areas ranging from bioinformatics and protein-protein interaction networks to characterizing disease spreads, the requirement of intuitive visualizations is unquestionable. One such real dataset is the ISRO North-East Biodiversity data [2], produced as a result of a survey in North-East India, to understand the trends of depletion of natural and bio-reserves due to poaching or other causes. It comprises of 1202 spatial points having 4 types of quantized information: (i) Bio-diversity richness index, (ii) Disturbance index, (iii) Medicinal property, and (iv) Economical property. User Interaction: Many hidden characteristics, such as biodiversity hotspot detection, relationships between a highly bio-diverse region, the type of vegetation found there, etc. can be inferred directly. We extend these inferences to a deeper level by mining statistically significant subgraph patterns that cannot be extracted by other standard means such as frequent subgraph mining, hotspot
detection, etc. Fig. 2 provides a visualization scenario. After executing the PAMSCS algorithm on the dataset, Fig. 2c portrays a pattern with 62 nodes and 364 edges where most of the nodes possess the label of High Biodiversity and Very High Disturbance. This is an unusual phenomenon, as according to ecologists, these properties are usually anti-correlated. Moreover, our discussions with ISRO scientists revealed that this activity is indeed a display of deviation from the expected since the disturbance has been into effect very recently and has been responsible for destroying much of the high biodiversity in this region. In fact, automatic mining of such regions would enable the government to take preventive actions while also saving on manual survey costs and analyses. Interestingly, the frequency of these labels together is just 4% in the dataset and, therefore, none of the frequent subgraph mining techniques could have mined it since they cannot operate at such low frequency thresholds. The results are rendered in an easy to understand visualization to a domain expert, thereby showing the utility of GARUDA.
3.2
Interactivity and Flexibility
As described in Section 3.1, systems built on exploratory tasks like graph mining should possess the capability of interactivity and flexibility, as it renders the task of portraying the results to the enduser (possibly a domain expert) easy and efficient. Therefore, such features are considered to be the key pillars for any demonstration system. To this end, GARUDA enables the end-user to perform analyses on personalized graphs by providing the capability to upload graphs in a simple format. GARUDA also provides the end-user the flexibility to choose one of the generic filters, as described in Section 2.2, to refine the mined subgraphs. These filters enhance the ability to analyze real datasets further. Finally, GARUDA allows control over the number of returned results t, by taking the same as input from the user. It also lets the user download the results. User Interaction: As indicated in Fig. 3, users are given the facility to upload their own graphs. Moreover, users can also easily choose one of the generic filters along with a number t for refining the set of returned results by the algorithm.
3.3
Effect of Varying Graph Parameters
We next portray the effect of varying different graph properties (Fig. 4). On a graph with fixed number of nodes n and (discrete) labels l, the following happens with the increase in density: (1) The size of the super-graph decreases exponentially, and reaches a constant l, when m & l.n log n. (2) Owing to this effect, the amount of time required for reducing the super-graph also decreases exponentially. (3) Since the reduction algorithm always reduces the super-graph to a fixed constant, the time required to run the na¨ıve
1451
Figure 3: Interactivity and flexibility of GARUDA.
3.4
Scalability
The experiments for PAMSCS were run using GraphX on an Apache Spark cluster consisting of 3 worker nodes each comprising of 4 cores (2.4 GHz) and 16 GB RAM running code written in Scala. The required files were stored on Hadoop file system (HDFS) consisting of 1 namenode and 3 datanodes. The simulations for the sequential algorithm were done using a C++ code on a (2.4 Ghz) machine with 32 GB RAM running Linux Debian 6.0.7. In this scenario, we compare the performance of the parallel algorithm, PAMSCS, for super-graph construction with the sequential MSCS. PAMSCS leverages the in-memory distribution provided by Apache Spark. The running time of the parallel version is fairly high on small datasets such as HepPh and DBLP (number of nodes