Manual uc-000. Issued: October 1998. GASFLOW: A Computational ...... aZ 3. 2.4. The Internal Energy Transport Equation. The equation of change for total internal ...... T. M. Apostol, MathematicaI Analysis: A Modern Approach to Advanced.
DISCLAIMER Portions of this document may be illegible electronic image products. Images are produced from the best available original document.
LA-13357-M, VOI. I
Manual (FZKA-5994) uc-000
Issued: October 1998
GASFLOW: A Computational Fluid Dynamics Codefor Gases, Aerosols, and Combustion VOLUME 1
The0y and Computational Model
J. R. Travis* J. W. Spore P. Rql* K. L. Lam* T. L. Wilson C. Miiller G. A. Necker B. D. Nichols R. Redlinger*
*Forsckungszentrurn Karlsruhe, Box 3640,976021 Kmlsruhe, Germany.
Los Alamos N A T I O N A L
L A B O R A T O R Y
Los Alamos, New Mexico 87545
CONTENTS
........................................................................................................... NOMENCLATURE .................................................................................................................. EXECUTIVE SUMMARY........................................................................................................ 1 INTRODUCTION............................................................................................................... ACKNOWLEDGMENTS
Page xi
1.1 Background ................................................................................................................ 1.2 Computational Methodology ................................................................................ REFERENCES.....................................................................................................................
2
..........................................................
MATHEMATICAL AND PHYSICAL MODELS 2.1 The Generalized Conservation Equation............................................................ 2.2 The Mass Conservation Equations ....................................................................... 2.3 The Momentum Transport Equations ............................ /. ................................. 2.4 The Internal Energy Transport Equation .......................................................... 2.5 Constitutive Relationships .................................................................................. 2.5.1 Thermochemical and Transport Properties ......................................... 2.5.1.1 Internal Energy and Specific Heats .......................................... 2.5.1.2 Transport Properties ................................................................... 2.5.2 Equation of State ......................................................................................... 2.6 Heat-Transfer and Phase-Change Relationships............................................. 2.6.1 Gas-Structure Heat Transfer..................................................................... 2.6.2 Condensation and Vaporization ............................................................. 2.6.3 Phase Change in the Fluid Mixture-The Homogeneous Equilibrium Model (HEM)....................................................................... 2.6.4 Droplet Depletion or Droplet "Rainout" ............................................... 2.6.5 Structural Heat Conduction..................................................................... 2.6.6 Wall Shear Stress........................................................................................ 2.7 Turbulence Modeling ............................................................................................ 2.7.1 Algebraic Model.......................................................................................... 2.7.2 K--E Model ..................................................................................................... 2.7.3 Turbulence Effects on the Transport Coefficients ............................... . . 2.8 Chemical Kinetics................................................................................................... 2.8.1 One-Step Model .......................................................................................... 2.8.2 Two-step Model.......................................................................................... 2.8.2.1 Induction Parameter Model...................................................... 2.8.2.2 Couplling of Induction Parameter Model with K--E Model ............................................................................................. 2.9 Recombiner Models............................................................................................... 2.9.1 NIS Recombiner Model ............................................................................ 2.9.2 Siemens Recombiner Model.................................................................... V
...
XIII
xix 1
1
4 6 7
7 8 10 11 12 12 13 15 16 16 16 18 20
22
22 23 24 26 27 28 29 29 32 32
33 34 37 39
CONTENTS (cont)
Page
2.9.3 Siemens Correlation for Siemens Type FR-90/1 Recombiner .........40 2.9.4 GRS Recombiner Correlation .................................................................. 41 2.10 Ignitor Model........................................................................................................... 41 2.11 Ventilation System Modeling ............................................................................. 42 2.11.1 Ducts and Pipes ............................................................................................ 2.11.2 Junctions ....................................................................................................... 47 47 2.11.3 Blowers and Fans........................................................................................ 2.11.4 Dampers and Valves.................................................................................. 48 2.11.5 Filters............................................................................................................. 49 2.12 Aerosol Model......................................................................................................... 49 2.12.1 Particle Transport ....................................................................................... 49 2.12.2 Particle Turbulent Diffusion.................................................................... 51 2.12.3 Particle Deposition ..................................................................................... 51 2.12.4 Particle Entrainment.................................................................................. 56 2.12.5 Boundary Layer Thickness ....................................................................... 60 2.12.6 Particle Cloud Model ................................................................................. 60 REFERENCES................................................................................................................... 61 3
........................................................................................
COMPUTATIONAL MODEL 3.1 Beginning of Time Cycle Initialization............................................................. 3.2 Phase A: Explicit Lagrangian Phase for the Multidimensional Finite Control Volumes........................................................................................ 3.2.1 Volume Equation ....................................................................................... 3.2.2 Momentum Equations.............................................................................. 3.2.3 Mixture and Species Mass Equations ..................................................... 3.2.4 Internal Energy Equation .......................................................................... 3.2.5 Gas Mixture Temperature ........................................................................ 3.2.6 Equation of State......................................................................................... 3.2.7 Structural Heat Conduction ..................................................................... 3.2.8 Mass and Energy Transfer......................................................................... 3.2.8.1 Structural Convective Heat Transfer...................................... 3.2.8.2 Structural Convective Heat and Mass Transfer.................... 3.2.8.3 Structural Convective Heat and Mass Transfer with Phase Change in the Fluid Mixture - HEM............................ 3.2.9 Liquid Droplet Depletion or "Rainout" ................................................. 3.2-10 Hydrogen Combustion.............................................................................. 3.2.10.1 One-Step Model ........................................................................... 3.2.10.2 Two-step Model........................................................................... 3.2.11 Hydrogen Recombination ........................................................................ 3.2.12 Ventilation System .................................................................................... 3.3 Phase B: Implicit Pressure Iteration Phase ........................................................ 3.3.1 Three-Dimensional Developments ....................................................... 3.3.2 Ventilation System Developments........................................................ 3.4 Phase C: Rezone Phase ..........................................................................................
vi
67 69 70 70 70 71 72 72 72 73 74 74 75
80 86 87 87 89 90 91 93 93 97 97
CONTENTS (cont)
Page 3.4.1 Multidimensional Developments.......................................................... 97 3.4.2 Ventilation System Developments...................................................... 104 3.5 Turbulence Transport.......................................................................................... 1~ 3.5.1 Algebraic Model ........................................................................................ 104 3.5.2 K--E Model ................................................................................................... 104 105 3.6 Time-Step Controls.............................................................................................. 105 3.6.1 Courant Condlition for Material Velocity............................................ 3.6.2 Diffusional Condition for Mass, Momentum. and Energy.............106 .. .. 106 3.6.3 Ignition Cond.itions.................................................................................. 3.6.4 Pressure Itera tion Considerations......................................................... 106 3.6.5 Maximum Time Step .............................................................................. 107 107 3.7 Particle Computational Model .......................................................................... 3.7.1 Particle Equations of Motion.................................................................. 107 3.7.2 Particle Diffusion...................................................................................... 108 3.7.3 Deposition/Rebound ............................................................................... 109 3.7.4 Entrainment ............................................................................................... 110 3.7.5 Numerical Solution Method ................................................................. 112 REFERENCES................................................................................................................. 113
4
......................................................................................................................
SUMMARY
115
APPENDICES A B
C
The Gauss Divergence ~ i e o r e m ............................................................................... Structural Heat Conduction Algorithm................................................................... Preconditioned Conjugate Residual Algorithm.....................................................
A-1 B-1 C-1
FIGURES
1-1 Typical dry containment.................................................................................................. 1-2 Cross section of the Heiss Dampf Reactor near Frankfurt. Germany .................... 1-3 Example of four independent multiblock computational volumes connected at each of the 3D volume’s external boundaries by a complex . . ventilation system.............................................................................................................
2 3
Schematic diagram for the recombiner box model .................................................. Siemens (Ref . 2-31) and NE (Refs. 2-32 and 2-33) recombiner.............................. Ventilation system for a waste tank farm .................................................................. Change in elevation for two neighboring one-dimensional cells........................ Gradual flow area change from As to AI.................................................................... Definitions for a and r....................................................................................................
35 36 44 45 45 47
2-1 2-2 2-3 2-4 2-5 2-6
vii
5
FIGURES (cont) 2-7 2-8
Illustration of a junction component ......................................................................... Forces acting on a single sphere at rest on a wall with a steady. fully developed turbulent flow..............................................................................................
Page
GASFLOW three-dimensional computational cell. Velocity components are located at face centers[W] west (.x). [E] east (+x). [SI south (.y). [N] north (+y). [B] bottom (.z). and [TI top (+z) ................................. 3-2 A two-dimensional mesh slice showing the u and v staggered momentum control volumes associated with cell (i. j. k)..................................... 3-3 Geometry for one-dimensional structural heat conduction.................................. 3-4 Slab and sink discretization........................................................................................... 3-5 Wall discretization.......................................................................................................... 3-6 Schematic diagram of van Leer second-order advection algorithm when face velocity is positive....................................................................................... 3-7 Schematic diagram of van Leer second-order advection algorithm . . when face velocity is negative.................................................................................... 3-8a A monotonicity condition shown by plotting the slope distribution of
48 57
3-1
(slope of i lies outside the zero slope values for i .1 and i + 1).......................... 3-8b A monotonicity condition shown by plotting the slope distribution of $J (slope of i is reduced to zero when its mesh value reaches an extreme) ........................................................................................................................... 3-8c A monotonicity condition shown by plotting the slope distribution of @ (slope of i is reduced to zero when it doesn’t agree with the trend of the adjacent slopes) .......................................................................................................
68
69 73 73 74 99 100
102 102 103
Diagram of structural heat conductor elements and nodes ................................. B-2 . . Slab and sink discretization......................................................................................... B-2 Wall discretization........................................................................................................ B-2 Interior Elements (1 I j I N). Cartesian Coordinates-Backward Euler Method ............................................................................................................................. B-3 B-5 Configuration for a wall. or two-sided heat-conduction problem...................... B-5 B-6 Configuration for a cylindrical heat-conducting element .................................... B-7 B-7 Configuration for a two-sided cylindrical heat-conducting element.................B-9
B-1 B-2 B-3 B-4
viii
TABLES
Page
2-1 Stress tensor components for a Newtonian fluid (Cartesian coordinates)........................................................................................................................ 11 2-2 Stress tensor components for a Newtonian fluid (cylindrical coordinates) ........11 2-3 Gas properties at temperature equaling 298.15 K [extracted from the JANAF (Ref . 2-7) Tables].................................................................................................. 13 2-4 Constants used in the K--E turbulence model ............................................................. 28 2-5 Siemens recombiner constants of FR-90/1 .................................................................. 40 2-6 L/D values for 90" bends ................................................................................................. 45 2-7 L/D values for miter bend .............................................................................................. 46 2-8 L/D values for standard elbow....................................................................................... 46 3-1 Comparison of standard A.LE and GASFLOW ALE features ..................................
B-1 Coefficients and Terms fo:r Heat-Conduction Algorithm....................................
ix
68
B-12
x
*
ACKNOWLEDGMENTS
The authors would like to thank John Dukowicz for his help in the implementation of the Conjugate Residual algorithm. We thank Maurizio Bottoni, Allen Notafrancesco, Asimios Malliakos, and George Niederauer for reviewing the document. We also thank Carolyn Robinson, Ann MascareAas, and Gloria Mirabal for their careful preparation and technical editing of this document.
xi
a
a xii
NOMENCLATURE a
A
A Ar Ar As A b
b
B
C
C
Gordon and McBride coefficient for specific heat polynomial, CHEMKIN coefficients for transport properties, and coefficient for internal energy polynomial Hamaker constant arid generalized polynomial coefficients for internal energy approximation Fractional flow-area vector Archimedes number Recombiner surface area (cm2) Wall or structural suirface area (cm2) Area of fluid cell in contact with GRS recombiner foil (cm2) Coefficient for internal energy polynomial Velocity of control surface (cm/s) Constant for wall shear stress Coefficient for internal energy polynomial and for water saturation curve Relaxation coefficient for phase-change model (HEM) or droplet rainout model (s-1) Concentration of species a (moles/cm3) Energy of combustion (ergs/mole) Fluid drag coefficient Vector structural drag coefficient Frequency (or pre-exponential) factor in Arrhenius law (cm3/mole s) Specific heat at constant pressure (erg/g K) Specific heat at constant volume (erg/g K) Coefficient for internal energy polynomial Particle (sphere) diameter (cm) Hydraulic diameter of duct (cm) Structural drag vector (g/cm s2) Molecular diffusion coefficient of species a into the mixture (cm2/s) Binary molecular diffusion coefficient of species a into species p (cm2/s) Turbulent mass diffusivity (cm2/s) Coefficient for internal energy polynomial Coefficient of restitution Activation energy (ergs/mole) Potential energy well depth on impact (ergs) Potential energy well depth on rebound (ergs) Duct friction factor Force (g cm/s*) Static friction coefficient Acceleration of gravity (cm/s2) Apparent particle penetration depth (cm)
...
Xlll
Structural mass-transfer coefficient (g/cm2 s) Structural mass-transfer coefficient, corrected for effect of water vapor (g/cm2 s) Penetration depth (cm) Structural heat-transfer coefficient (g/s3 K) or (ergs/cm2 K s) Corrected structural heat-transfer coefficientfor effect of water vapor (g/s3 K) Enthalpy for species a (ergs/@ Hydrogen Water vapor Heaviside function or blower head (cm) x- (or r-) direction index specific internal energy (ergs/@ Specific internal energy at reference temperature of 298.15 K (ergs/g) y- (or e-) direction index Mass flux vector for species a (g/cm2 s) z-direction index or thermal conductivity (ergs/cm K s or g cm/K s3) Chemical rate constant (cm3/mole s) Bulk mechanical property = (1-N2)/Y (cm2/dyne) or momentum form loss coefficient Kinetic energy from incident normal velocity (ergs) Kinetic energy from rebound normal velocity (ergs) Turbulence length scale (cm) Effective length of duct (cm) Mass of bulk material or aerosol particles (g) Smallest of fuel, oxygen, burnt fuel mass fractions Mass-transfer rate to and from structural surface (g/s) Molecular weight (g/mole) Mole fraction Unit normal vector Nitrogen oxygen Pressure (Pa) Induction parameter for combustion model Prandtl number Volumetric flow rate into recombiner (cm3/s) Energy flux vector (ergs/cmZ s) Energy lost or gained by the structure due to phase change (ergs/s) Convected energy to structural surface (ergs/s) Radial coordinate Flux ratio Radius of curvature (cm) Gas constant for species a (ergs/mole K) xiv
Re
9l S
Rh2
S" sc
SI
Sm
sa SP
Sp,a t T U
U
ug
uY U*
a
U
ug ugcp
ugPu
ugpuo Ui
u ia Ur Ut V
V V" w X
X
m
xa Y Y Yc
Y
Reynolds number Recombination reactjon rate for hydrogen (g/s) Universal gas constant (ergs/mole K or g cm2/mole s2) Fluid cell surface area (cm2), or blower speed (radian/s) Moving control surface (cm2) Schmidt number Energy source or sink, (ergs/s) Momentum source or sink (g/cm2 s2) Arbitrary source term Mass source or sink resulting from phase change involving structures (gb) Mass source or sink resulting from chemical reactions and HEM (g/s) Time (s) Temperature (K) x- (or r-) direction velocity component (cm/s) Fluid velocity vector (cm/s) Grid velocity vector (cm/s) Velocity component tangent to and a distance y from wall (cm/s) Shear velocity (cm/s:) Velocity into recombiner (cm/s) Gas velocity (cm/s) Gas velocity at center of particle (cm/s) Minimum particle pickup velocity predicted by the semi-empirical model (cm/s) Minimum particle pickup velocity predicted by the single particle model (cm/s)
Incident normal velocity (cm/s) Critical normal rebound velocity ( c m / s ) Particle velocity (cm / s) Rebound normal velocity (cm/s) Tangential velocity (cm/s) y- (or e-) direction velocity component ( c m / s ) Volume (cm3) Moving control volume (cm3) z-direction velocity component (cm/s) Position vector (cm) Cartesian coordinate Mass fraction of speciies a Cartesian coordinate Distance normal to surface and perpendicular to flow direction (cm) Distance from wall to cell center (cm) Young's modulus (djme/cm2) XV
ya Z
20
a
P
6
6X
6Y 6Z At
Ax E
77
8
Molar or volume fraction for species a Cartesian coordinate Separation distance of sphere and substrate (cm) Coefficient of thermal expansion Random number for particle bounce; angle of miter bend (degrees) Wall thermal diffusivity Boundary layer or film thickness (cm) Mesh cell size for fluid cells in x- or r- coordinate direction (cm) Mesh cell size for heat cells in y- or 8- coordinate direction (cm) Mesh cell size for heat cells in z-coordinate direction (cm) Time step (s) Mesh cell size for heat conduction grid (cm) Dissipation of turbulent kinetic energy per unit mass (cm2/s3) Molecular viscosity (g/cm s) and recombiner efficiency Azimuthal coordinate, gas mixture volume, fraction, or gas mixture void fraction Mass-transfer correction factor Heat-transfer correction factor Square root of turbulent kinetic energy per unit mass (cm2/s2) Second coefficient of molecular viscosity (g/cm s) First coefficient of molecular viscosity (g/cm s) Kinematic viscosity (cm2/s) Poisson ratio Geometry coefficient Density (g/cm3) Gas density (g/cm3) Particle density (g/cm3) Turbulence coefficient and standard deviation Relaxation constant Induction time Viscous stress tensor (g/cm s2) Wall or structural shear stress (g/cm s2) Molecular thermal conductivity (ergs/cm K s or g cm/K s3) Turbulent thermal conductivity (ergs/cm K s or g cm/K s3) Rate factor General (arbitrary) scalar or vector function General molecular transport coefficient and turbulence variable Reaction rate (moles/cm3 s)
Superscripts A Lagrangian Phase A computational level B Lagrangian Phase B computational level n Old time level
xvi
n+l %
0
New time level Moving control surface or volume and corrected heat and mass Transfer coefficients for water vapor effect Reference value; or thermodynamic or microscopic density
Subscripts b Bulk fluid property Cell-centered value; or related to combustion, condensation/vaporization; C or convection d Related to mass-transfer coefficient Cell face f Gas g Hydrogen component h2 Water vapor component h2o Water liquid component h2ol x- (or r-) direction index i Recombiner inlet in I Related to the energy conservat,an equation y- (or e-) direction index j z-direction index k Momentum control volume, or related to the momentum m conservation equations Maximum droplet loading of the atmosphere max mixture Refers to fluid mixture Recombiner outlet out Oxygen component 02 Reference; or related to droplet rainout 0 Particle P Reference ref Structure surface; or saturation S Turbulent and total o r apparent t Total heat flux to structures, convection plus phase change total Wall-temperature distribution in structures w Vector component in x- or r-coordinate direction X Vector component in y- or @-coordinatedirection Y Z Vector component in z-coordinate direction Species a Related to the turbulence coefficients E Related to the turbulence coefficients K Related to the turbulence coefficients c1 Related to the mass conservation equations P
xvii
xviii
GASFLOW A Computational Fluid Dynamics Code for Gases, Aerosols, and Combustion
J. R. Travis, J. W. Spore, P. Royl, K. L. Lam, T. L. Wilson, C. Muller, G. A. Necker, B. D. Nichols, and R. Redlinger
ElXECUTIVE SUMMARY Los Alamos National Laboratory (LANL) and Forschungszentrum Karlsruhe (FzK) are developing GASFLOW, a three-dimensional (3D) fluid dynamics field code as a best-estimate tool to characterize local phenomena within a flow field. Examples of 3D phenomena include circulation patterns; flow stratification; hydrogen distribution mixing and stratification; combustion and flame propagation; effects of noncondensable gas distribution on local condensation and evaporation; and aerosol entrainment, transport,, and deposition. An analysis with GASFLOW will result in a prediction of (1) the gas composition and discrete particle distribution in space and time throughout the facility and (2) the resulting pressure and temperature loadings on the walls and internal structures with or without combustion. A major application of GASFLOW is for predicting the transport, mixing, and combustion of hydrogen and other gases in nuclear reactor containments and other facilities. It has been applied to situations involving transporting and distributing combustible gas mixtures. It has been used to study gas dynamic behavior (1) in low-speed, buoyancy-driven flows, as well as sonic flows or diffusion dominated flows; and (2) during chemically reacting flows, including deflagrations. The effects of controlling such mixtures by safety systems can be analyzed. The code version described in this manual is designated GASFLOW 2.1, which combines previous versions of the United States Nuclear Regulatory Commission code HMS (for Hydrogen Mixing Studies) and the Department of Energy and FzK versions of GASFLOW. The code was written in standard Fortran 90. This manual comprises three volumes. Volume I describes the governing physical equations and computational model. Volume II describes how to use the code to set up a model geometry, specify gas species and material properties, define initial and boundary conditions, and specify different outputs, especially graphical displays. Sample problems are included. Volume III contains some of the assessments performed by LANL and FzK. GASFLOW is under continual development, assessment, and application by LANL and FzK. This manual is considered a living document and will be updated as warranted.
XiX
GASFLOW is a finite-volume code based on robust computational fluid dynamics numerical techniques that solve the compressible Navier-Stokes equations for 3D volumes in Cartesian or cylindrical coordinates. The code can model geometrically complex facilities with multiple compartments and internal structures in a computational domain of multiple 3D blocks of cells connected by one-dimensional flow paths. GASFLOW has transport equations for multiple gas species, liquid water droplets, and total fluid internal energy. A built-in library contains 23 gas species and 1liquid water species. GASFLOW can simulate the effects of two-phase dynamics with the homogeneous equilibrium model, two-phase heat transfer (steam condensation and water evaporation) to walls and internal structures, chemical kinetics from catalytic hydrogen recombination and combustion processes, and fluid turbulence. The code can model two-phase heat transfer to and from walls and internal structures by convection and mass diffusion. Wall shear stress models are provided for bulk laminar and turbulent flow. Two turbulence models available: algebraic and K-E, which provide zero- and twotransport-equation models, respectively, that determine turbulent velocity and length scales needed to compute the turbulent viscosity. Terms for the turbulent diffusion of different species are included in the mass and internal energy equations. Chemical energy of combustion involving hydrogen provides a source of energy within the gaseous regions. A one-step global chemical kinetics model based on a modified Arrhenius law accounts for local hydrogen and oxygen concentrations. A two-step chemical kinetics model divides the chemical reaction into two parts: (1) an induction phase, which builds radicals and releases little energy; and (2) an energy release phase, where the radicals recombine. Hydrogen is ignited using a generalized ignitor model that represents both spark- and glow-plug-type designs. A catalytic hydrogen combination with oxygen is modeled using data from both the Nuclear Ingenieur Service and Siemens recombiner box designs. The aerosol model comprises the following models: Lagrangian discrete particle transport, stochastic turbulent particle diffusion, particle deposition, particle entrainment, and particle cloud. These models incorporate the physics of particle behavior to model discrete particle phenomena and allow the code user to track the transport, deposition, and entrainment of discrete particles, as well as clouds of particles. GASFLOW 2.1 models have been extended beyond GASFLOW 1.0 with the following developments:
independent multiblock computational domains; independent multiblocks connected on external boundaries by a ventilation system; a fractional area treatment to model flow areas smaller than a cell face area; accurate internal energy as a function of temperature to fourth-degree polynomials;
gas properties library of thermochemical and transport extended to 30 species;
homogeneous equilibrium model for fluid mixture; droplet depletion or "rainout"; two-phase heat and mass transfer to structural components; both spark- and glow-plug ignitor models; empirical hydrogen combustion limits; hydrogen recombiner models; and transport, deposition, and entrainment of discrete particles. Each version of GASFLOW is tested with a Standard Test Matrix of 126 problems i n four categories: (1) feature tests for the computer science aspects of the code; (2) functional tests for code algorithms, equations, logic paths, and decision points; (3) comparisons with analytical solutions; and (4) comparisons with data. During the development of GASFLOW 2.1, many experiments were modeled and analyzed. All 19 analytical solutions and the following 6 experiments are documented in Volume III: (1) the Bureau of Mines Spherical Test Chamber; (2) the Sandia FLAME Experiment; (3)Battelle Model Containment (BMC) Test GX6; (4)Battelle Model Containment Test HYJET JX7; (5) Heifidampfreaktor (IIDR) Test T31.5; and (6)Phebus Tests 4A, 4B, 6A, and 1OA. All of the problems in the Standard Test Matrix and in the initial set of assessments were executed successfully by GASFLOW 2.1 without modification, and the results are in agreement with the analytical solution or the test data. For example, other assessment analyses of the HDR, BMC, Russian RUT, and LANL TA-55 facilities are documented in the literature. The Bureau of Mines Spherical. Test Chamber (having a volume of 120 L) has been used to investigate the flamma.bility of hydrogen, ammonia, nitrous oxide, and air mixtures under quiescent and turbulent conditions. GASFLOW calculated combustion of mixtures of hydrogen concentrations for 5 to 40 vol % diluted in air, xxi
1:lratios of hydrogen and nitrous oxide in air, and very low hydrogen and nitrous oxide concentrations in air with 1 and 2% ammonia added. Beginning with ambient temperature and pressure, GASFLOW accurately calculated- that the behaviors of both fuel-lean and fuel-rich mixtures for hydrogen are (1)little pressure rise for very low hydrogen concentrations, (2)downward flame propagation and nearly complete combustion for approximately 8% hydrogen, and (3) and maximum pressure for a stoichiometric (29.6% hydrogen) mixture. Good results were obtained for the mixtures where nitrous oxide was added, although the pressure rise rate was conservatively high by up to 20%. In conclusion, the one-step finite-rate chemical kinetics model yields good results but is limited. For more complex combustion problems, a reduced set of chemical kinetics mechanisms or a two-step method based on an induction parameter model should be used. Both improved models are derived from detailed chemical kinetics mechanisms.
The FLAME facility (1.8 m wide, 2.4 m high, 30 m long = 136 m3) at Sandia National Laboratories was used to study flame acceleration and deflagration-to-detonation transition of hydrogen-air mixtures. In experiment F-21, 13% hydrogen was added and mixed with a fan. After 30 min, gas samples indicated stratification ranging from 15% at an upper location to 10% at a lower location. The test was chosen to assess transient mixing and stratification calculations by GASFLOW, beginning with stagnant air and followed by hydrogen injection, *mechanical mixing, and natural stratification. The algebraic turbulence model was used, and results were not very sensitive to the chosen turbulent length scale because mixing was largely achieved by molecular diffusion. GASFLOW showed that the hydrogen jet does not penetrate very far before it becomes a buoyant plume that gradually expands. At 100 s after injection ends, stratification is maximum (approximately 17% at the top and approximately 4% at the bottom) in the early part of the mixing phase, which lasted for 1800 s, or 30 min. When the gas samples were taken, GASFLOW calculated upper and lower volume fractions of 15.4% and 9.8'30, respectively, within the reported uncertainty of 0.5%.
The Battelle Model Containment (BMC) Test GX6 was used to validate the catalytic recombiner model in GASFLOW. This test was conducted using the central cylindrical room R1/R3 and the annular segment compartments R5 through R8; these rooms were sealed off from the remainder of the BMC. Each compartment has a gas volume of 49 m3; the total for test GX6 was 209 m3. A Siemens catalytic recombiner was placed next to the inner wall of R5, not far from the opening to R6. Steam was injected into rooms R5, R6, and R7. Hydrogen was injected into R8. Ten hours of the test was calculated with GASFLOW. The calculated pressure was slightly higher than measured and stayed more level, indicating a combination of too much in-leakage in the calculation and slightly different boundary condition pressures. The drop in pressure at approximately 6 h into the transient, which was caused by terminating the inflow of steam, was calculated to be slightly earlier and larger. This drop indicated that the condensation rate in GASFLOW is slightly larger than is inferred from the test data. The overall agreement is good and captures the dominant trends in the data. Temperature comparisons at several different xxii
locations are excellent and capture dominant trends in the data. In particular, the temperature rise through the recombiner was calculated quite accurately. The BMC Test JX7, also known as HYJET, was used to validate the capability to model small- and large-scale effects of a turbulent jet and convection with containment within one calculation. This test used all of the rooms in the BMC, except the annular segment compartment R7, which has a total gas volume of 600m3. Near the bottom of R6, a helium mass of 9.25 kg was injected vertically under the openings to R5 and to the dome over a period of 200 s. The nozzle had a diameter of 95 mm and an average injection velocity of 42 m/s. The jet from the nozzle extended all the way from the source location into the dome region, where the helium then stratifies as a cloud. Using a model with 50,000 computational cells, GASFLOW calculated the helium concentrations at four sensor locations: in the dome, near the bottom of the central room, and in the upper and lower parts of the ring room. In general, GASFLOW predicts the dominate trends well and predicts the helium stratification consistently with the data. Good agreement was obtained in the central room and in the lower part of the ring room. GASFLOW overpredicted the helium concentration in the dome region; this is attributed to insufficient air entrainment along the jet surface.
HDR Test T31.5, also known as an International Standard Problem, ISP-23, was used to validate the capability to model hydrogen and steam transport and distributions in a large-scale containment during a simulated large-break loss-of-coolant accident. The containment has a steel shell with a height of 60 m, an internal diameter of 20 m, and a free volume of 11,300 m3. The containment has 72 compartments connected with about 200 passageways below the approximately 5000-m3 volume of the open hemispherical-dome region. In this test, a blowdown from the pressure vessel injected 30,000 kg of a steam-water mixture over the first 50 s at the 22-m level. From 21 to 36 min, superheated steam was injected at a rate of 2.2 kg/s. From 36 to 48 min, a light gas (14% hydrogen and 85% helium) was injected. The GASFLOW model for T31.5 used 12,300 computational cells with obstacles and barriers to model all major floors and walls and all compartments. Heat structures were modeled extensively through the containment. An isentropic expansion model was used for the blowdown. GASKOW predicts the dominate trends well for pressure, temperature, and concentration for this complex test. Pressure peaks and rapid pressure equilibrium calculated by GASFLOW throughout the containment agreed quite well with the data. After 5 min, GASFLOW starts predicting a slower pressure decay, reaching a difference of 0.08 bars after about 15min. One explanation is the lack of a film relocation model. The film vaporization model provides a continuous steam source that slows down the pressure decay; however, that should be cut off as dryout occurs. Calculated temperature histories reflect the somewhat higher asymptotic pressures. Calculated values are high by about 10°C in the middle and upper containment and by 20" to 25°C in the bottom containment. Three effects could cause high bottom temperatures; the most likely :is that a significant amount of water collects in the xxiii
bottom, creating an additional heat sink, especially after passing over cold surfaces on the way down. GASFLOW calculations of light-gas concentrations in the spiral staircase and in the dome are in excellent agreement with data. In two places, GASFLOW concentrations vary significantly from the data. One is near the source, where concentration gradients vary strongly and the computational mesh is not fine enough to resolve them well. Another is at the bottom, where the concentration is very low (only about 0.5%). Four steady-state tests (4A, 4B, 6A, and 10A) in the Phebus facility were used to validate the condensation model in GASFLOW. The facility (approximately 5.7 m high and 1.8 m in diameter = 10 m3) has a insulated double skinned wall through which coolant flows to maintain a homogeneous inner wall temperature of approximately 110°C.Inside the top part of the facility is (1) a wet condenser, which consists of three steel rods internally cooled to a specific temperature, and (2) a dry condenser, which is heated to prevent condensation. Initial conditions were air diluted with 39 vol % steam at 110°C and 1.9 bars. Steam sources for this set of tests varied from 1 g/s at 114°C and 1.65 bar to 4g/s at 125°C and 2.3 bar, directly vertically upward from the bottom. A GASFLOW model of 715 computational cells modeled a 60-degree sector. Condensation parameters were set to standard values. The calculated final pressures during the condensation process were found to agree with the data within 1%to 5% for the various cases.
xxiv
1
INTRODUCTION
1.1
Background
Combustion in nuclear facility buildings, such as light-water reactor (LWR) containments, can cause high pressures or temperatures that can, in turn, damage the containment or affect important safety-related equipment. After the Three Mile Island accident (a severe, or degraded-core, accident), it was found that significant quantities of hydrogen had been generated from the chemical reaction between the zirconium cladding (the thin protective covering of the nuclear fuel) and the water vapor. When released into the containment, this hydrogen burned by one or more combustion modes and threatened the containment integrity, internal structures, and safety-related equipment. The principal design basis for containment integrity is peak pressure. Local temperature is important for the safe operation of instrumentation and equipment. Local concentrations of hydrogen, air, and water vapor are the important parameters for determining safe levels of hiydrogen with respect to potential deflagration or detonation. Thus, the primary parameters of interest are pressure, temperature, and concentrations of gas species. A secondary parameter of interest is a concentration of aerosol particles. Containment pressure is usually of interest as a global parameter; however, the detailed spatial distribution of temperatures and concentrations is important for safety analyses. It is common to differentiate between two types of multidimensional fluid dynamics codes. A ”field code’’’uses correlations for wall flow resistance and heat transfer. A ”computational flujid dynamics (CFD) code” calculates the heat and momentum transfer through thle boundary layer at a wall instead of using correlations. Although GASFLOW is capable of calculating flow and heat transfer gradients near surfaces, thereby resolving boundary layers, noding for such calculations is too fine for use with full-size containment structures. Thus, for containment analyses, GASFLOW is characterized as a “field code.’’ Modeling the geometry of a containment building can be difficult. One example is a pressurized water reactor (PWII) containment, such as H. B. Robinson (Ref. 1-l), shown in Figure 1.1. The net free volume in the containment is 2,100,000 ft3. The containment cylinder and dome of steel-lined concrete has an area of 78,000 ft2, of which 58,000 ft2 is insulated, and is 3042 in. thick. The top part of the containment is open, but the lower part is divided into compartments housing steam generators, pumps, reactor, and auxiliary equipment. Interior concrete walls, 12 in. thick, have an area of 165,000 ft2. Interior steel walls and structures, 0.1 to 4.0 in. thick, have a surface are of 185,000 ft2. All of these walls and surfaces serve as passive heat sinks. Active cooling equipment include two spray systems and four fan coolers.
1
Figure 1-1. Typical dry containment Another example is the Heiss Dampf Reactor (HDR) containment (Ref. 1-2), shown in Figure 1-2, near Frankfurt, West Germany. Data from HDR Tests T31.5 and E11.2 were used for GASFLOW assessment. The HDR building is 60 m high and 20 m in diameter. It contains two stairwells, an elevator shaft, several vertical open hatchways, and -70 rooms. This particular containment has roughly 11,300 m3 of free volume, or approximately one-sixth to one-eight the free volume of a typical
2
270"
I I
90"
Figure 1-2. Cross section of' the Heiss Dampf Reactor near Frankfurt, Germany United States (US) or German Konvoi-type pressurized water reactor (PWR) containment. The US Department of Energy (DOE), the US Nuclear Regulatory Commission (NRC), and the German government and nuclear utility industry are supporting research at Los Alamos National Laboratory (LANL) and Forschungszentrum Karlsruhe to develop GASFLOW to evaluate design basis and beyond design basis severe accidents in nuclear reactor containments as well as in other nuclear facility buildings and the consequences on safety-related equipment and the containment
3
structure itself. Current research coordinates model development with validation using experiments performed in Germany, the European Communities, and the US. 1.2 Computational Methodology This report documents the theoretical and computational aspects of GASFLOW, a finite-volume computer code for solving transient, three-dimensional (3D), compressible, Navier-Stokes equations for multiple gas species. The code is designed to be a best-estimate tool for predicting the transport, mixing, and combustion of hydrogen gas in nuclear reactor containments and other nuclear facility buildings and structures. An example of GASFLOWs capabilities is shown in Figure 1-3. Here we show an
arrangement of three cylindrical tanks and one small hexahedral tank connected by a complex ventilation system. The four tanks represent the independent multiblock computational domains, each composed of a single 3D array of cells. The onedimensional (1D) ventilation system connecting the four tanks indicates the coupling of the tanks through attachments at external boundaries on the 3D blocks or at "T"junctions within the 1D network itself. Within the ventilation system, there are components that may be arbitrarily included. These components include fans or blowers, dampers or valves, and filters. With this additional capability, GASFLOW has modeled nuclear waste tank farm behavior and provided safety analyses for the DOE nuclear waste depository sites at Hanford, Washington. GASFLOW is based on the governing physical laws and modeling assumptions that are described in Chapter 2. In Chapter 3, we describe the Los Alamos linearized Implicit Continuous-Fluid Eulerian Arbitrary-Lagrangian-Eulerian numerical methodology (ICE'd ALE) field-model approach that provides the basis of the computational method used to integrate the equations in time and space. Briefly, each computational step is divided into three phases.
(1)
(2)
An explicit Lagrangian phase computes changes in material volume, density, velocity, and internal energy caused by pressure gradients, combustion ignited with a generalized ignitor model, condensation and vaporization within the assumptions of the two-phase homogeneous equilibrium model, a structural two-phase heat transfer, catalytic recombiner hydrogen mitigation, structural heat conduction, and turbulence. An implicit Lagrangian phase calculates pressures at the advanced time level
by solving simultaneously for pressure, density, velocities, and internal energy.
4
7
1000. (Re, is the particle Reynolds number, and Re,= pg d, I U,-Up I / rn, where m is the gas molecular viscosity.) In this case, the drag coefficient is CDz 0.44. Stokes Law, which is derived from the Navier-Stokes equations with many limiting assumptions, is used to calculate the fluid friction drag force when Rep < 1. Here the assumption is that the inertial forces are much less than the viscous forces. For Re, < 1, CD = 24/Rep . The influence of the Reynolds number on the drag coefficient of spherical particles over a wide range (1 < Re, < 1000) is represented as 6
(see Ref. 2-37). This formulation is used in the code. The force from gravity is (2-122)
where g is gravitational acceleration. When a particle is released in air it quickly reaches a terminal velocity, a condition in which the drag force of the air will be exactly equal and opposite to the force of gravity. A particle is said to have curvilinear motion when it follows a curved path rather than a straight-line or oscillatory motion. A particle traveling along a curved streamline in flow around an obstacle will have curvilinear motion and will experience a centrifugal force, which can be expressed as
n 3P -, u: F,=--d 6 p p R
(2-123)
where Ut is the tangential velocity at radius of curvature R. Curvilinear motion is characterized by the dimensionless Stokes number (Stk), which is the ratio of the stopping distance (a measure of the inertial range of a particle) to a characteristic dimension of the obstacle. For geometrically similar particle motion to occur 50
around differently sized obstacles, the flow Reynolds numbers must be equal and the Stokes numbers must be equal. 2.12.2 Particle Turbulent Diffusion
The fluid velocity at the location of a discrete particle is the sum of the mean velocity components and the turbulent velocity components. The turbulent velocity is determined by a stochastic approach suggested by Hotchkiss and Hirt (Ref. 2-38). The idea is to consider the particle as a point source that diffuses for a time A t . The probability of wh.ere the particle is likely to move along a coordinate axis x can be written in the form of a Gaussian probability distribution function 1 n(x,t)= -e20 6
--x 2 - 2
(2-124)
0
-4
where 202 is the dispersion of the probability distribution, CT = is the standard deviation, and D, is the turbulent diffusion coefficient. A random number generator selects the actual location used within the possible distribution. The turbulent velocity component is determined from the randomly chosen location. This process is repeated for each of the three coordinate directions. 2.12.3 Particle Deposition
Particle adhesion is poorly understood and its description is partly qualitative. Hinds states that because it is such a complicated phenomenon there is no complete theory that accounts for all the factors that influence adhesion (Ref. 2-39). The main adhesive forces are the van der Waals force, electrostatic forces, and the surface tension of absorbed liquid films. These forces are affected by the following: the material, shape, and size of the particle; the material, roughness, and contamination of the surface; the relative humidity and temperature of the ambient gas; and the duration of particle-surface contact and initial contact velocity. The theoretical analyses of adhesion forces presented by Hinds (Ref. 2-39) and Dahneke (Refs. 2-40 and 2-41) indicate that the most important adhesion forces are the London-van der Waals forces, the long-range attractive forces that exist between molecules. Hinds explains that these forces arise because the random movement of electrons in any material creates momentary areas of charge concentration called dipoles. At any instant these dipoles induce complementary dipoles in neighboring material, which gives rise to attractive forces. These forces decrease rapidly with separation distance between surfaces; consequently, their influence extends only several molecular diameters away from a surface. Small particles do not always adhere to a surface after impingement. At "low" velocities a particle may lose all of its kinetic energy on impact by deforming itself 51
and the surface. In this velocity range, the greater the deformation the greater the adhesive force. At "high" velocities, part of the particle kinetic energy is dissipated in the deformation process and part is converted elastically to kinetic energy of rebound. At some threshold velocity the rebound energy will exceed the adhesion energy and the particle will bounce off the surface. This can occur for particle sizes that would adhere tightly in a static situation. The harder the particle and surface, the larger the particle, and the greater the velocity, the more likely bounce is to occur. To model particle deposition in GASFLOW, the theory of rebound developed by Dahneke (Refs. 2-40 and 2-41) is used. Dahneke's rebound theory includes an energy balance analysis of the impinging and rebound particle. Consider a particle moving towards a surface, still beyond influence of the surface, with incident normal velocity Ui. The particle kinetic energy due to Ui is KEi. (Kinetic energy due to motion parallel to the surface is assumed conserved throughout the collision, and kinetic energy due to spinning of the particle is neglected.) Upon nearing the surface the particle will fall into the particle-surface potential energy well of depth E. In general, the depth of the potential well may vary during the collision. Possible causes could be contact charging or particle and surface deformation. Thus two potential well depths are defined: Ei is the depth seen by the incident particle, and Er is the depth seen by the reflected particle. To obtain the kinetic energy of the particle at the instant of rebound, the concept of the coefficient of restitution, e, is used. This is defined as the ratio of normal particle velocity at the instant of rebound to normal particle velocity at the instant of contact. The kinetic energy at the instant of rebound is
(2-125) where the sum of KEi and Ei is the kinetic energy of the particle at the instant of contact, and e2 is the fraction of this energy recovered by the particle. If the collision is perfectly elastic, e2 = I. Upon rebound, the particle must exchange kinetic energy for potential energy as it climbs out of the potential energy well. The final kinetic energy of the reflected particle, beyond influence of the surface, is
K E , = (KEi + Ei)e2 -E,.
(2-126)
In terms of particle velocity, U,and mass, m, Equation (2-126) can be equivalently written as
(2-127) L
52
where Uyis the rebound velocity. Dahneke (Ref. 2-40) noted that if one could approximate E = EY = Ei, then E:quation (2-127) would simplify to
(2-128) When there is no rebound, the particle must i l to climb out of the potential energy well, and thus KE, is zero, and 1
(2-129) This equation determines the critical rebound speed, U:; it describes the limiting case between particle capture and rebound. The depth of the potential energy well for a sphere of diameter d and a flat surface adhering to each other is given by Dahneke (Ref. 2-40), quoting as references Bradley (Ref. 2-42) and Hamaker (Ref. 2-43), as
E=---,Ad 122,
(2-130)
where A is the Hamaker constant, zo is the equilibrium separation between the particle sphere and a surface, and d is the particle diameter (see references for more detailed description of terms). The attractive force between the sphere and a surface is (2-131) Combining Equations(2-129) and (2-130) and writing the particle mass in terms of its volume and density, pp, gives
u;=[ A(l-e’)
1 -
]
moppd2e2
(2-132)
.
Dahneke (Ref. 2-41) states that the principal deficiency of the Bradley-Hamaker derivation of the adhesion energy is its failure to consider the repulsive portion of
53
the molecular interactions. Thus, flattening of the sphere tip and deformation of the surface are not considered. Dahneke presents in the 1972 publication (Ref. 2-41) a new theory for the adhesion of particles (spheres) that includes the influence of the repulsive component of force from the elastic flattening of the spheres. The repulsive component of force is expressed in terms of the apparent penetration depth, h, of the impacting sphere into the substrate; the sphere size, d; and the sphere bulk mechanical properties, K = (1 - N2)/ Y, where N is Poisson's ratio and Y is Young's modulus of the particle material. The net force between two impacting spheres (or a sphere and a surface) is written as the sum of the attractive and repulsive forces: 2 m
(2-133)
F=($)[1+:)+(3K)
In order to derive an equation for the maximum adhesive force, Fmax, Dahneke assumes that some flattening will always occur when two spheres (or a sphere and a flat surface) adhere and exploits the fact that F must obtain a minimum at some value of penetration h. He states that the expression for Fmx is of practical importance in calculating adhesive force, since a force greater than F,,, is required to separate two spheres or a sphere from a surface by, for example, centrifuging or blowing, or by dislodgment through inertial forces when a stress in the surface material is reflected to the surface. The maximum adhesive force is (2-134) which occurs at the penetration (2-135) Note that the first term in Equation(2-134) is the adhesive force between two unflattened spheres. The second term is the increase in adhesive force due to flattening of the spheres. Thus, flattening has greater effect for larger particle sizes and softer materials. In order to obtain an expression for the threshold bounce velocity, Uc, including the effect due to flattening, it is first necessary to obtain an expression for the interaction energy. This is obtained directly from Equation (2-133) using the relationship E = JFdh. This yields
54
E=
hg.
[E)(g 3)(15K) I+
h
h2
+
4d%
+
(2-136)
The potential energy well equivalent to the energy required to overcome the maximum adhesive force expressed in Equation (2-134) is obtained by substituting the penetration depth, hfi expressed in Equation (2-135) into Equation (2-136). This gives
'=[e]['+(T)'-( )I+(=[ ) A2K2d
A4K4d2
4.J2d
722zA4
A2K2d
722;
5
2
(2-137)
Combining Equations (2-129) aind (2-137) gives the equation for the critical rebound velocity that determines the threshold particle bounce velocity. The critical rebound velocity is the value of velocity for a 50% probability of bounce. The concept of the threshold velocity or critical rebound velocity U: being defined as 50% likelihood of particle bounce is presented by Hinds (Ref. 2-39) and Paw U (Ref. 2-44). The incident velocity window outside of which the particle either adheres or bounces is somewhat arbitrary. Data presented by Paw U suggest that plus or minus 50% of Ui" is a reasonable assumption for this. That is, for Ui < Ui"(0.5) the particle always adheres, and for Ui > Ui"(1.5) the particle always bounces. With these specified limits the probability of particle bounce for the velocity range 0.5 Ui*< Ui< 1.5 U : is expressed as (2-138) A determination of whether or not specific particles will bounce or adhere can be made by generating a random number, a,with a value between 0 and 1, and testing for
(3-139) L
When this condition is met, the particle will bounce. Dahneke's data (Refs. 2-45 and 2-46) show the trend for the coefficient of restitution, e, to reach a maximum value, in this case 0.96, at the threshold bounce velocity of about 10 cm/s. Almost immediately the ratio of rebound velocity to incident velocity begins to decrease as tlhe incident velocity increases. At an incident velocity of 100 cm/s, e is 0.68; at 400 cm/s, e is 0.15. An approximately 70% decrease in e 55
results in an increase in incident velocity of 100 cm/s. The following equation models this data relatively well:
e = eo(0.60)exp ,
(3-140)
where
exp =
ui -UT 1o.ou;
I
and eo is the coefficient of restitution at the threshold bounce velocity. Particle deposition and bounce are not understood well enough that a totally mechanistic model can be developed. The phenomena simulated in this deposition model are based on theoretical models that are necessarily restricted by a wide range of assumptions and experimental data that are limited to specific conditions. Deposition is in a real sense a stochastic process that follows the general trend of the theoretical and empirical models developed and compared with available experimental data. Because of this, it is a reasonable assumption that some small, unknown percentage of the particles that impact a surface will adhere. To account for this, currently 5% of all particles that impact a surface do adhere. The particles that adhere are randomly chosen. 2.12.4 Particle Entrainment The mechanisms involved in the entrainment of deposited particles from a surface into the suspension fluid are not well understood. Suspension is associated with the aerodynamic detachment of particles for which the principal force holding them onto a surface is the intersurface molecular force (adhesion force).
Suspension is initiated by flows when the fluid velocity equals or exceeds the particle threshold suspension velocity value. As pointed out by Halow (Ref. 2-47), most treatments of particle suspension have provided correlation of a largely empirical nature and, while perhaps describing the available experimental data, do not have a sound enough fundamental basis to permit confident extrapolation of the data to uninvestigated systems and conditions. Most theoretical work has considered the balance of forces acting on a suspension particle, considering the fluid-particle interaction in the shear flows in the viscous sublayer, which are assumed to be steady. A force balance approach modified by experimental data is used in this model. Criteria for determining the fluid velocity at which a particle initially at rest on a surface will become suspended can be determined from a force balance equation that includes gravity, adhesion, fluid lift, fluid drag, and friction forces. A particle adhering to a surface will be dislodged when the removal forces equal or exceed the force of particle adhesion. This model is based on a force balance approach plus 56
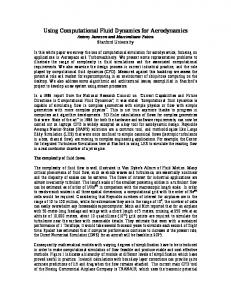
experimental data reported by Cabrejos and Klinzing.* They present a technique for finding the minimum pickup (suspension) velocity of solid particles in horizontal pneumatic conveying. This general semi-empirical correlation is based on the Archimedes number and is valid over a range of particle sizes from 10 to 1000 mm. When the size of the particle is smaller than the thickness of the viscous sub-layer, that is, dp < dl, the forces acting on the sphere are as shown in Figure 2-8, where a horizontal flow is assumed. Gravitational, buoyant, and adhesive forces depend only on the physical properties of the particle and the gas density, and they are independent of the gas stream velocity. The drag and lift forces depend on the gas stream velocity, whereas the frictional force is proportional to the coefficient of sliding friction. The adhesive force is the van der Waals intersurface molecular force.
t -b Friction
Air Stream
t
Lift Buoyancy
1-
$
4
Gravity Adhesion
Figure 2-8. Forces acting on a single sphere at rest on a wall with a steady, fully developed turbulent flow The forces acting on a small sphere, immersed in the viscous sublayer are as follows: (1) Gravitational force:
Fg = dnd p3 p p g ,
* Francisco J.Cabrejos and George E. Klinzing, “IncipientMotion of Solid Particles in Horizontal Pneumatic Conveying,” Dept. of Mech. Engr., University of Pittsburg, unpublished paper (1991).
57
(2) Buoyant force:
(3) Adhesive force:
(4) Drag force:
(5) Lift force:
(6) Friction force:
where Ugcp is the gas stream velocity at the center (y = dp/2) of the stationary particle, which is typically in the viscous sublayer. The shear velocity, Ut, is known, so UgCpcan be computed from dpG U,, =-. 2v
(2-141)
The adhesive and lift forces are from Dahneke (Ref. 2-41) and Saffman (Ref. 2-48), respectively. The small sphere will begin moving when the forces acting on the particle are zero. Applying Newton's second law, motion will take place when (2-142)
58
Substituting the above force equations into the force balance equation gives
(2-143) A Newton-Raphson solver can be used to solve this implicit equation for Ugcp, which is the minimum pickup velocity for the single particle.
This model follows the derivation of the force balance model presented by Cabrejos and Klinzing.* However, they derived the equations for pipe flow. They also used Munroe's equation to model the effect that the pipe would have on large particles and used Blasius' correlation for the friction factor inside a smooth pipe for the effect the pipe would have on small particles, that is, for those totally immersed in the viscous sublayer. The equations presented here are for flow over a flat plate. The shear velocity, Ut, is used to determine the velocity at the small particle center in the viscous sublayer. Cabrejos and Klinzing modified the pickup velocity predicted by these fundamental equations with experimental data. Although this data was obtained in pipe flow, we believe it can be used for a more general flow model. Comparison of minimum pickup velocities predicted by the modified Cabrejos-Klinzing model with experimental measurements of the threshold suspension velocity, for flow over thick beds of a wide range of material sizes and densities (Ref. 2-49), shows good agreement. The predicted pickup velocity is modified by an empirical equation that is a function of the Archimedes number, (2-144)
The magnitude of this correction factor ranges from about 2.5 for high-density, large particles to about 250 for low-density, small particles. Cabrejos and Klinzing show that this semi-empirical model agrees well with experimental data. Combining the single particle model, which predicts a pickup velocity, Ugpuo,with the experimental data for the minimum pickup velocity of a layer of particles gives
*
Francisco J. Cabrejos and George E. Klinzing, "IncipientMotion of Solid Particlesin Horizontal Pneumatic Conveying,"Dept. of Mech. Fhgr., University of Pittsburg, unpublished paper (1991).
59
I
a general correlation. This semi-empirical correlation is believed to be valid over a range of particle sizes from 10 to 1000 pm. It is expressed as
U,
= (1.27Ar 3 + 0.036Ar3
+ 0.45
0.70Ar
5
+ 1.0
(2-145)
The first term on the right-hand side takes into account the effects of particle interactions with the other particles, and the second term accounts for the particle shape. 2.12.5 Boundary Layer Thickness
The boundary layer thickness, Si, is approximated by
6 X
-_1
= 0.370Rx
(2-146)
,
where R, = uyx/n, and x is the distance along the wall from the point at which the turbulent fluid initially contacts the wall. To estimate the magnitude of the boundary layer thickness, assume a 300 cfm flow through a 2 ft by 2 ft duct, which is a flow velocity of about 40 cm/s. Then, 10 m from the duct entrance ( x =10 m) the boundary layer thickness, Si, is about 30 cm. Since the inner layer is approximately 2% of 61,the inner layer is approximately 0.6 cm or 6 mm. For a flow velocity of only 10 cm/s and at a distance of 1.0 m from the duct entrance, the boundary layer thickness is only 5 cm, and the inner layer is 1mm. These examples indicate that generally the deposited particles available for resuspension will be immersed in the inner layer of the boundary layer. 2.12.6 Particle Cloud Model
The particle cloud model permits each discrete computational particle to represent a cluster of particles that can disperse as a Gaussian cloud. The density and size of the particles in the cloud of particles are the same as the computational particle with which the cloud is associated. The particle cloud density, ppc, at a selected point that is a distance Y from the cloud center is given by (2-147)
60
where (2-148)
and
+.Jv.
o=rpci
(2-149)
The term Mpc is the mass of the particle cloud, Dpc is the particle diffusion coefficient of the cloud, rpci is the initial radius of the particle cloud, and t is the elapsed cloud growth time. The radius of the cloud at any elapsed time is rPc= 3 s. The cloud density at any given point is determined Vy the summation of all density contributions of individual particle clouds at that point. REFERENCES 2-1.
G. K. Batchelor, An Introduction to Fluid ‘Dynamics (Cambridge University Press, Cambridge, 1967).
2-2.
P. A. Thompson, Compressible-Fluid Dynamics (McGraw-Hill Book Co., New York, 1972).
2-3. C. W. Hirt, ”Volume-Fraction Techniques: Powerful Tools for Wind Engineering,” Journal of Wind Engineering and Industrial Aerodynamics, 46 & 47,327-338 (1993). 2-4. R. B. Bird, W. E. Stewart, and E. N. Lightfoot, Transport Phenomena, (John Wiley and Sons, New York, 1960). 2-5.
S. R. Turns, An Introducfion to Combustion,(McGraw-Hill,New York, 1996).
2-6. J. D. Ramshaw, ”Self-Consistent Effective Binary Diffusion in Multicomponent Gas Mixtures,” J. Non-Equilib. Thermodyn., 15, 295-300 (1990). 2-7. JANAF Thermochemical Tables, Third Edition, National Bureau of Standards, New York (1985) . 2-8. S. Gordon and B. J. McBride, ”Computer Program for Calculation of Complex Chemical Equilibrium Compositions, Rocket Performance, Incident and
61
Reflected Shocks, and Chapman-Jouget Detonations,” NASA Special Publication SP-273 (1971). 2-9. JANAF Thermochemical Tables, Second Edition, National Bureau of Standards, New York (1971) . 2-10. Keenam, Keyes, Hill, and Moore, Steam Tables (John Wiley and Sons, New York, 1969). 2-11. R. J. Kee,J. A. Miller, and T. H. Jefferson, “CHEMKIN: A General-Purpose, Problem-Independent, Transportable, Fortran Chemical Kinetics Code Package,” Sandia National Laboratories Report, SAND80-8003 (1980). 2-12. S. Mathur, P. K. Tondon, and S. C. Saxena, ”Thermal Conductivity of Binary, Ternary and Quaternary Mixtures of Rare Gases,” Mol. Phys., 12,569 (1967). 2-13. C. R. Wilke, ”A Viscosity Equation for Gas Mixtures,” J. Chem. Phys., 18,517 (1950). 2-14. C. F. Curtiss and J. 0. Hirschfelder, “Transport Properties of Multicomponent Gas Mixtures,” J. Chem. Phys., 17,550 (1949). 2-15. B. E. Launder and D. B. Spalding, ”The Numerical Computation of Turbulent Flows,” Comp. Meth. Appl. Mech. Eng., 3,269 (1974). 2-16. W. M. Rohsenow and H. Choi, Heat, Mass, and Momentum Transfer (Prentice-Hall, Englewood Cliffs, New Jersey, 1961). 2-17. H. Schlicting, Boundary-Layer Theory (McGraw-Hill, New York, 1968). 2-18. R. S. Brodkey, The Phenomena of Fluid Motions (Addison Wesley, Boston, 1969). 2-19. David C . Wilcox, Turbulence Modeling for CFD (Griffin Printing, Glendale, California, 1944). 2-20. T. Cebeci and A. M. 0. Smith, Analysis of Turbulent Boundary Layers (AcademicPress, New York, 1974). 2-21. W. Rodi, Turbulence Models and Their Application in Hydraulics (International Association for Hydraulic Research, Delft, The Netherlands, 1980).
62
2-22. P. Bradshaw, T. Cebeci, and J. H. Whitelaw, Engineering CaEcuZation Methods in Turbulent Flow (Academic Press, New York, 1981). 2-23. J. R. Travis, “A Heat, Mass, and Momentum Transport Model for Hydrogen Diffusion Flames in Nuclear Reactor Containments,” Nuclear Engr. Des., 101, 149 (1987). 2-24. F. Tamanini, E. A. Ural, and J. L. Chaffee, ”Hydrogen Combustion Experiments in a 1/4-scale Model of a MARK 111 Nuclear Reactor Containment,” Factory Mutual Corporation Interim report Y101-1 (May 1987). 2-25. P. Royl, C. Muller, J. R. ‘Travis, and T. Wilson, “Validation of GASFLOW for Analysis of Steam/Hydrogen Transport and Combustion Processes in Nuclear Reactor Containments,” presented at the 13th International Conference on Structural Mechanics in Reactor Technology (Paper No. 611), Porto Alegre, RS, Brazil, August 13-18/1995. Published by Departamento de Engenharia Civil, Faculdade de Tecnologia, Universidade de Brasilia, 70910-900 Brasilia -DF, Brazil, document No. ISBN 85-7025-349-4 Vol. I, p. 211. 2-26. L. Valencia, ”Brandschutzversuche im Containment HDR-Versuchsgruppe BRA Versuche T52.1 /T52.2” (Fire Protection Tests in the Containment HDRTest Group BRA Tests T52.1/T52.2), Kernforschungszentrum Karlsruhe report PHDR-Arbeitsbericht Nr. 5.075/86 (February 1987). 2-27. E. S. Oran, T. R. Young, and J. P. Boris, “Application of Time-Dependent Numerical Methods to the Description of Reactive Shocks,” Seventeenth Symposium (International) on Combustion, the University of Leeds, Leeds, England, August 20-25, 1978 (The Combustion Institute, Pittsburgh, Pennsylvania, 1978), p. 43. 2-28. T. R. Young, “CHEMEQ-A Subroutine for Solving Stiff Ordinary Differential Equations,” Naval Research Laboratory Memorandum Report 4091 (1979). 2-29. B. F. Magnussen and B. H. Hjertager, “On Mathematical Modelling of Turbulent Combustion with Special Emphasis on Soot Formation and Combustion,’, Sixteenth Symposium (International) on Combustion, pp. 719729 (The Combustion Institute, Pittsburgh, 1976). 2-30. B. H. Hjertager, “Numerical Simulation of Turbulent Flame and Pressure Development in Gas Explosions in Fuel-Air Explosions,” SM Study No. 16, pp. 407-426 (University af Waterloo Press, Ontario, Canada, 1982).
63
2-31. T. Kanzleiter, ”Versuche zur Wirksamkeit von WasserstroffGegenmassnahmen in einer Mehrraum-Containment-Geometrie,Band 1 und Band 2,” Battelle Frankfurt abschlussbericht BIeV-R67.036-01 und 02 (November 1991). 2-32. U. Behrens, M. Seidler, and U. Wolff, “Hydrogen Mitigation Using Catalyst Modules,” E. Della Loggia, Ed. Presented at CEC/IAEA/KIAE Seminar on Hydrogen Behaviour, March 4-8,1991. Commission of European Communities document EUR 14039EN (1992). 2-33. K. Fischer, ”Qualificationof a Passive Catalytic Module for Hydrogen Mitigation,” Nuclear Technology, 112,pp. 58-62 (October 1995). 2-34. M. A. Movahed, ”Recombiner Model for Lumped Parameter Codes Validation and Application,” International Workshop on Hydrogen Research for Reactor Safety, Munich, September 19-21, 1994. 2-35. S. G. Markandeya and A. K. Chakraborty, ”Modelling of Catalytic Recombiners for Removal of Hydrogen During Severe Accidents,” Proceedings of the SMiRT-12 Conference, (Elsevier Science Publishers, Vol. C, 1993). 2-36. The Engineering Division, FZow of FZuids through VaZves, Fittings, and Pipe, Technical Paper No. 410 (Crane Company, New York, NY, 1976). 2-37. F. M. White, Viscous Fluid Flow (McGraw-Hill, New York, 1974). 2-38. R. S. Hotchkiss and C. W. Hirt, ”Particulate Transport in Highly Distorted Three-Dimensional Flow Fields,” Proceedings of the 1972 Summer Computer Simulation Conference Vol. 2, pp. 1037-1041 (ANA, San Diego, CA, 1972). 2-39. William C . Hinds, Aerosol Technology (John Wiley and Sons, New York, 1982). 2-40. Barton Dahneke, ”The Capture of Aerosol Particles by Surfaces,” J. Colloid Interface Sci., 37,342 (1971). 2-41. Barton Dahneke, ”The Influence of Flattening on the Adhesion of Particles,” J. Colloid Interface Sci., 40,l (1972). 2-42. R. S. Bradley, Phil. Mag., 13,853 (1932).
64
2-43. H. C. Hamaker, ”The London-Van der Waals Attraction Between Spherical Particles,” Physica (Ulrecht), 4,1058 (1937). 2-44. Kyaw Tha Paw U, “The Rebound of Particles from Natural Surfaces,” J. Colloid Interface Sci., 93,442 (1983). 2-45. Barton Dahneke, ”Measurements of Bouncing of Small Latex Spheres,” J. Colloid Interface Sci., 45,584 (1973). 2-46. Barton Dahneke, ”Further Measurements of the Bouncing of Small Latex Spheres,” J. Colloid Interface Sci., 51/58 (1975). 2-47. John S. Halow, ”Incipient Rolling, Sliding and Suspension of Particles in Horizontal and Inclined Turbulent Flow,” Chem. Engr. Sci., 28,l (1973). 2-48. P. G. Saffman, ’:The Lift on a Small Sphere in a Slow Shear Flow,” J. Fluid Mech., 22,385 (1965).
2-49. J. D. Iversen, J. B. Pollack, R. Greeley and B. R. White, ”Saltation Threshold on Mars: The Effect of Interparticle Force, Surface Roughness, and Low Atmospheric Density,’’ ICARUS, 29,381 (1976).
65
66
3
COMPUTATIONAL MODEL
The computational model and solution algorithm for solving the multidimensional, time-dependent fluid-flow equations follows the ICE'd-ALE methodology first introduced by Hirt et al. (Ref. 3-1) and used later in other computational fluid dynamics efforts at Los Alamos (Refs. 3-1 through 3-7).
The computational domain is defined by regular, 3D arrays of regular parallelepiped cells in 3D computing domains, and 1D arrays of either square cross-sections or cylindrical cross-sections in the piping or duct networks. First, each coordinate axis is divided into intervals that define cell faces in that direction. The location of each interval is identified by its physical mesh coordinate (x, y, or z in Cartesian geometry or Y, 0, or z in cylindrical geometry) apd a corresponding logical coordinate (i, j,or k) called the mesh index. The domain is divided up in the x-direction by planes passing through the x-direction mesh coordinates and normal to the x-axis. Similarly, sets of planes normal to the other directions divide up space in the y -and z- directions. The intersections of the three families of planes define a 3D arrangement of cells ("finite volumes"). Figure 3-1 shows a typical cell, along with conventions for identifying faces and vertices. Values of the scalar variables pf I, and p are computed at cell centers, and the facenormal component of velocity i s computed at cell faces or edges. Initial values for each variable and appropriate boundary conditions are set at all locations. The continuous integral equations of motion described in Section 2 are approximated by finite-volume expressions (discrete algebraic equations) on the computational mesh. Thus, the dynamic state in the problem domain can be approximated by integrating the finite-volume equations in space and time. In the standard ALE method (Ref. 3-l),both fluid and grid (ug)velocities are located at cell vertices. By specifying ug to be different from u, the shape and spatial distribution of the mesh may be changed to model a problem with a deformable boundary. Mass, momentum, and energy are exchanged between cells by averaging vertex velocities to produce a cell-face fluxing velocity. Because GASEOW is designed to compute flows with fixed geometries, this general mesh motion feature is not needed; therefore, we locate fluid velocities directly on cell faces. Other differences between the standard ALE method and the ALE method implemented in GASFLOW are given in Table 3-1. Mesh cells serve as control volumes for cell-centered variables and thus serve as the finite volumes for solving the mass and energy equations. Because velocity components are located at cell faces, a different treatment is needed for the
67
J-. Z
X
Figure 3-1. GASFLOW 3D computational cell. Velocity components are located at face centers: [W] west (-x), [E] east (+x), [SI south (-y), [N] north (+y), [B] bottom (-z), and [TI top (+z); all other variables, the scalar variables, are located at the cell center. Table 3-1. Comparison of standard ALE and GASFLOW ALE features Standard ICE'd ALE Cell-centered p, I, p Vertex-centered u, momentum Total enerev (E) Pressure work is done only in the implicit Lagrangian phase. Control volumes are (1) computational cells and (2) volumes centered on vertices.
GASFLOW l i n e s z e d ICE'd ALE Cell-centered p, I, p Face-centered u, momentum Internal enerm (1) Pressure work is done in both the explicit and implicit Lagrangian phases. Control volumes are (1) computational cells and (2) volumes centered on cell faces. Vertices stay fixed. Parallelepiped cells Volume calculations are straightforward. x-, y-, and z-face fluxing in rezone phase ~~~
Linearized volume treatment in implicit Lagrangian phase
68
j+l/2
0
I j
j42
i+l/2 Figure 3-2. A 2D mesh slice showing the u and v staggered momentum control i-112
i
volumes associated with cell (i, j, k).
momentum equations. A momentum control volume, V,, is defined as half of each of the two cells sharing a common face (Figure 3-2). In this sense, we say that momentum control volumes are "face-centered," although this is strictly true only if both cells are the same size. A momentum control volume for the east face of cell (i, j , k)is V, = (Vi,j,k+ Vi+l,j,J/2. A similar definition is made for the momentum control volumes that straddle the north and top faces. Because we are interested only in the Eulerian solution of the flow equations, a full continuous rezone always will be applied (see Section 3.4, Phase C: Rezone Phase), with the Lagrangian phase being only an intermediate step toward the full solution. Each fluid dynamics time step is broken into three phases as described below and is followed by turbulent transport calculations. 3.1
Beginning of Time Cycle Initialization
GASFLOW allows the user to compute molecular transport properties by a number of methods. The first and simplest is a "nonmechanistic" calculation using constant default or input variables such as kinematic viscosity, thermal conductivity, binary mass diffusion coefficient, and the nondimensional Prandtl and Schmidt numbers. These options are discussed in detail in the User's Manual. Based upon the gas composition of each finite control volume, the mixture transport properties are updated by the procedures outlined in Section 2.5.1.2 (Transport Properties).
69
If the user has specified a turbulence model, then the molecular transport coefficients are updated to the apparent or turbulent values using the methodology described in Section 2.7.3 (Turbulence Effects on the Transport Coefficients). Phase A: Explicit Lagrangian Phase for the Multidimensional Finite Control 3.2 Volumes
In this phase, the densities, velocities, and specific internal energy fields are updated by the effects of all chemical and physical processes. These effects include combustion, catalytic recombination, heat transfer, phase change between liquid film on structural surfaces and within the fluid mixture, body forces, and turbulence effects. 3.2.1
Volume Equation
The change in each computational cell volume associated with the scalar variable, V,, is calculated from the discrete approximation to Equation (2-5) with Qr = 1 and application of the divergence theorem (Appendix A): VA- V" At
=~(d)l;ASf f
.
(3-1)
Superscript A denotes the Lagrangian Phase A, and n denotes the beginning of computation cycle time-level, while subscript f denotes the cell faces of the appropriate control volume. 3.2.2
Momentum Equations
The components of the velocity field then can be found from the discrete approximation of Equation (2-13):
In addition to the resistance to flow through reduced flow areas, areas that are smaller than the computational cell-face area, the structural drag vector, D,, can represent the resistance of internal structures such as pipes, I-beams, catwalks, and such configurations that are impossible to resolve on any practical mesh. These internal structures play an important role as heat sinks and, to a lesser degree, as momentum sinks. However, we do attempt to model their momentum effects by the expression
70
where the subscript rn refers to the staggered momentum control volumes associated with the velocity field. Note that fractional A is dependent on the orientation of the structures. For example, there is little resistance to flows parallel to the gratings of the catwalks lbut quite a different resistance to flows normal to the gratings. The drag coefficient, CD, for reduced area flows is computed from an orifice correlation (Ref. 3-8). 1
1+0.707+(1-A)?- A
I'
(3-4)
,
or can be determined empirically or selected from tables of drag coefficients of common shapes. Equation (3-2) with Equation (3-3) can be solved for the advanced time-level "At momenta as
r
pillA =
Lf
1 1
.
.
f
J
I
(3-5)
which provides a computationally fast, local implicitness that provides additional robustness to Phase A and the GASFXOW algorithm. When the mixture density field is updated to the same time-level, as will be shown below, the velocity field can be determined. 3.2.3 Mixture and Species Mass Equations
The mass change for each species because of combustion, phase change, and interspecies diffusion is calculated as follows:
(3-6) When Equations (3-2) is summed over all species, we derive the Phase A mixture mass equation:
The " A I time-level on the various source and sink terms will become evident as those models are developed in the sections below. 71
e
3.2.4 Internal Energy Equation
The change in the total internal energy can be written from Equation (2-14) as I
A A
A
-p"lnv" = - p " C ( u*A&ASf+s;recombinnri*ion V"+ At f
%h20TA
(
)Vn-z(q.A);ASf
S~h20,condensationlvaporization+ S ~ h 2 0 , m i n u r e
f
+
All source terms will be derived and discussed in subsequent sections. 3.2.5
Gas Mixture Temperature
The gas-mixture temperature, T A , is computed by inverting a polynomial of up to the 4th degree, which is similar to Equation (2-18) but cast in a slightly different form A , + T A A l + ( T A ) 2 4 + ( T A ) 3 A 3 + ( T A ) 4 =AO4
(3-9)
such that the polynomial coefficients contain all the know quantities from Equations (3-6) and (3-8). These coefficients will become evident in later developments. The user specifies in the input the degree of the polynomial, from linear to quartic. Our development here will assume the quartic because it contains all the ingredients of the lesser degree polynomials. 3.2.6
Equation of State
Finally, the updated pressure is determined from the equation of state [Equation (225)] as follows:
(3-10) where the gas volume fraction is
(3-11)
72
3.2.7 Structural Heat Conduction
A heat conducting solid of depth X D is discretized by N heat conducting elements (1I j IN). Material properties (p, cP, and IC)are independent of temperature in these derivations but thermal conductivity can be different in each element (composite layer). Nodes, also numbered 1through N,are located on the positive side of the conducting elements. Node zero denotes the surface node on the negative side; node N denotes the surface node on the positive side as shown in Figure 3-3.
To
Ti
TNI
T2
TN
+ X
xo
x1
XN-1
x2
Figure 3-3. Geometry for 1D structural heat conduction For purposes of problem definition, heat conducting structures are divided into three categories: slabs, sinks, and walls. Slabs and sinks have only one element in contact with fluid (element No. 1). More accurate spatial resolution of temperatures is generally wanted near the fluid/structure interface; hence, the smallest element is normally element 1 with increasing element sizes away from the interface. Walls have both surfaces in contact with a fluid. Comparable discretization of each structural type is shown in Figures 3-4 and 3-5.
Figure 3-4. Slab and sink discretization
73
Figure 3-5. Wall discretization New time-level temperatures at all but the boundary nodes are computed from an implicit finite-difference approximation to Equation (2-52). Details are presented in Appendix B in the following equation:
-
= A
((1- 0)( ,T :, - T”) + O(Tzl - ,+I)), l+,/Ax,
- (( 1- O)(T,” - T)’: + O(Tn+’- T;’))kjAxw
1-
(3-12)
Three methods are provided for the evaluation of this equation: (1)the temporal fully implicit first-order backward Euler method ( 0= l), (2) the temporal 1 unconditionally stable second-order Crank-Nicholson method ( 0 = -), and (3) the 2
temporal fully explicit first-order backward Euler method ( 0 = 0). The explicit method is not recommended for containment analyses in which many temporal and spatial scales are encountered. Different boundary conditions, including specified temperature, specified heat flux, as well as an adiabatic surface, are provided in the solution of Equation (3-12). These details are discussed in Appendix B. Equation (3-12) and two boundary-condition-dependent equations for nodes 0 and N are a linear system of N equations for the unknown temperatures Tf”’that are found from a tridiagonal matrix solution algorithm. 3.2.8 Mass and Energy Transfer 3.2.8.1 Structural Convective Heat Transfer
Whenever the temperatures of structural surfaces and the adjacent gas differ there will be heat exchange by convection. In the case when neither water component is included in the calculation, all species densities remain unchanged during this calculation. The resulting change in energy of the gas appears as source terms in the Phase A energy Equation (3-8)with Equation (2-27),
74
(3-13)
and as a heat flux boundary condition in the structural heat conduction Equation (3-12). The uncorrected (there is no water component in this case) heat transfer coefficient is computed from Equation (2-29). Making use of Equation (2-18) g'ives a polynomial of up to degree 4,
a
a
(3-14)
a
which must be inverted to find the new mixture temperature. This equation demonstrates the combination of terms that make up the coefficients presented in Equation (3-9). Once the mixture temperature is found the source term in the energy equation can be computed from (3-15)
and, therefore, the energy convected to or from any given surface is
- 4s.convection =
4s.toral-
3.2.8.2
( - T:)
(3-16)
*
Structural Convective Heat and Mass Transfer
When the water vapor component is specified with user input, phase change on structural surfaces may occur. .Inthis case, the water vapor species mass Equation (3-6)with Equation (2-42) is Ph",,VA-PL0," At
- S~k20,condenrtationlvaporizationv"= (3-17)
and the energy Equation (3-8) with Equations (2-27) and (2-44) becomes
pAIAVA - pnznvn At
A -A
- ' h 2 0 ~ LLp,&o,condcnsmionlvapo~i~~ionVn + StconvectionVn
A Sl,condensation/ vaporization
V" =
75
+
%h2oT
A
A
Sp,h20,condenrotionlwporization
vn+ C h s ~ s -( ~T ;~ ) + S
(3-18)
The enhanced or corrected heat and mass transfer coefficients are computed as described in Sections 2.6.1 and 2.6.2, and the surface saturation density is evaluated by the formulation given in Section 2.6.2. The solution procedure for Equations (3-17) and (3-18) requires several passes through the mesh. For example, the term on the right-hand side of Equation (3-17) checks to see if surface dryout occurs (the liquid film is depleted); this must be determined without knowing the advanced time-level water vapor density. One could employ a iterative scheme, but we have found a much faster solution procedure: we make a predictive pass through the mesh and then, based upon the predictive information, a correction pass is performed. First, a fully local implicit evaluation of Equation (3-17) is executed without regard to surface dryout to find a predicted density, pilo,by reducing Equation (3-17) to (3-19)
The solution for the predictor water vapor density, pLo, is (3-20)
S
VA + A t x hiAs S
The corrective step makes use of the predicted density, p[20,in the following way:
76
condensation
-
where
~
(
~
C S
~
(
~
-Ps,saturation 4 0
) - max
(3-21)
- Ps,saturation ) is the usual Heaviside function 4
0
(3-22)
Note that the first term on the right-hand side of the equation acts as a source of water vapor because evaporation of the liquid film is occurring, whereas the second term on the right-hand side is a1 loss of water vapor mass due to condensation of water vapor in the mixture. Since the second term could result in negative water vapor density, it can be treated implicitly with the water vapor source term being treated as a constant. The corrected water vapor density is then computed as follows:
The actual source term is then computed as follows:
(3-24)
77
where the mass transfer for each surface is
(3-25)
The liquid film thickness, a,", for each surface is finally updated using the mass transfer computed by Equation (3-25): (3-26) The energy equation (3-18) can be evaluated to determine the mixture temperature by inverting the following equation: x(p,"a,)- -p"Z"V" 1 VA
-x
- At
hsAsT,"+
VA s
78
Once the mixture density and temperature are found, we can determine each of the energy source terms found in Equation (3-18) as follows: Rho'
A
V" =
A
Sp,ho,comiemationlvaporization
(3-28)
'1,convection A
(3-29)
v" = C h s ~ s (-~T ; ~ ) S
A
SI,condemation/ vaporization
vn=
(3-30) The total energy, qs,totaI, delivered to a given surface is qs,total
- 4s.convection + qs,comiensation/vaporiaztion --
79
(3-31)
3.2.8.3
Structural Convective Heat and Mass Transfer with Phase Change in the Fluid Mixture - HEM
When the water vapor and liquid components are specified with user input, phase change on structural surfaces may occur plus phase change with the fluid mixture may also occur. In this case, the water vapor species mass Equation (3-6) with Equations (2-42) and (2-45) is At
- S~h20,condensationlvaporizationv &'AspE:Y
-?ma[-VnC.max
2At
9
hd* As (p&o A
n
A
-k Sp,h20.minureVn
=
-Ps,satumtion
-Piz0l 129
(3-32)
Psaturation ('9
Pmturation
the water liquid species mass Equation (3-6) is
(T?Psaturation )
and the energy Equation (3-8) with Equations (2-27), (2-44), and (2-49) is
80
(3-33)
S l , c o d e m a t i o n / vaporiwtionVn
+ '1,convection
A
vn+
Rh20T A (sp,&o.condematiod A
vaporization
+ Sp,hzo,minure A
A
)vn+Chs~s(~: -T~)+ S
(3-34) (Pto
-- ps,saturaiion
A limiter of 1/2 is invoked in the right most term in Equation (3-32) and (3-33) to prevent the liquid density from going negative. The enhanced or corrected heat and mass transfer coefficients are computed as described in Sections 2.6.1 and 2.6.2, the surface saturation density is evaluated by the formulation given in Section 2.6.2, and the saturation density in the fluid mixture is computed from Equation (2-48) in Section 2.6.3. The solution procedure for Equation (3-32) is very similar to the solution procedure shown in the previous section which required several passes through the mesh. For example, the first term on the right-hand side of Equation (3-32) checks to see if surface dryout occurs (the liquid film is depleted), whereas the second term accounts for phase change within the fluid mixture. We again implement a procedure to make a predictive pass through the mesh, and then, based upon the predictive information, a correction pass is performed. First, a fully local implicit evaluation of Equation (3-32) is executed without regard to surface dryout to find a predicted density, pi2o,by reducing Equation (3-32) to the following:
The solution to this equation is
81
The corrective step makes use of the predicted density, pLo, in the following way:
At
Using the same reasoning as in the previous section, we note that the first term on the right-hand side of the equation acts as a source of water vapor because evaporation of the liquid film is occurring, whereas the second term on the righthand side is a loss of water vapor mass due to condensation of water vapor from the mixture. The third term is the exchange of mass between the liquid and vapor phases, which can be either a source or sink in this equation. Since the second and third terms could result in negative water vapor density, they can be treated implicitly with the water vapor source term being treated as a constant. Solving Equation (3-35) for p;, yields
82
evaporation
ptoVn- Ai
+
2 S
[ I - H(P:zo - Ps,sat)]. m a [
6,"AsPZ2At
'
h i 4 (PL0 - P s , s a t )
]
S
y
f
.
(3-38)
The actual source terms are then computed as follows:
(3-39) The mass transfer between phases in the mixture is
Just as in the previous section, the actual mass transfer to or from any given surface is
83
(3-41) The liquid film thickness, 6f,for each surface is finally updated using the mass transfer computed by Equation (3-41): (3-42)
The energy Equation (3-34) can be evaluated to d e a m i n e the mixture temperature by inverting the following equation: 1
~ ( p ~ a- -pnInV" a ) a
VA
-z At
VA s
hsAsT,"+
+
84
1I
l a
- Ps,saturation
!I
=o .
(3-43)
)
Once the mixture density and temperature are found, we can determine each of the energy source terms found in Equation (3-34) as follows:
(
' ~ ~ o , c o n d e n s a t i o n , W P o r ~ t i+ o n' ~ h 2 0 , m i x t u r e ) V n
=
-Rh20TA
'1,convection A
(3-45)
Vn=~hsAs(T~-TA) S
A
'1,codnsationlvaporization
vn=
(3-46) The total energy, qs,total,, delivered to a given surface is %,total
- qs,convection + qs,codnsationJva~rization-
85
J (3-47)
3.2.9
Liquid Droplet Depletion or "Rainout"
When the water liquid component is specified with user input, water droplets may be allowed to rain out if the accumulation of liquid water mass exceeds a specified loading value. The liquid water species mass Equation (3-6) with Equation (2-50) is Pl;20rVA -P k o r V " - ';,h201, At
rainout
v"=
ro,
1
(3-48)
and the energy Equation (3-8) with Equation (2-51) is
Equation (3-48)is only solved if the liquid density exceeds a specified value. If that should be true, then the advanced time-level liquid water density is (3-50)
which allows an easy evaluation of the rainout mass term
86
(3-51) The time-advanced mixture temperature is computed from Equation (3-49) as EMBED "Equation" \ * mergeformat
- P"'"
V" V" F - At 7Chzol,mxture
*
A (Ph,ol,max - p h 2 0 1 ) a b o l
1
(3-52) which allows a straight forward evaluation of the rainout energy term 'trainour
v" = v"Ch201,mixture
*
(pb01,ma~ - P t o l ) * I( T A )
.
(3-53)
3.2.10 Hydrogen Combustion 3.2.10.1 One-Step Model
For the current one-step chemical kinetics model [Equation (2-74)], we see that three species-hydrogen, oxygen, and water vapor-are involved in this fundamental chemical balance. The mass Equation (3-6) for each of these species is pt2V A-p; V" - sp44,combustionV" At
POZV-P:2v"At A
A
$0,
,co*ustron
V"
(3-54)
Pt2V A- K2V" - '~h,o,co*ustion V" At and the Energy equation (3-8)is 87
(3-55) We use Equations (2-75), (2-78), (2-80), and (2-84) to obtain the right-hand sides of the above equations, with (3-56)
If the mixture is fuel lean, ch2< 2. co,,we solve Equation (2-82) and arrive at (3-57) and if the mixture is fuel rich, chz> 2 co2,we solve Equation (2-83) and arrive at e
(3-58) which gives the mass source terms for Equation (3-54)
(3-59)
and the energy source term
(3-60) Note that the solutions for the reaction rate, ($, in both Equations (3-57) and (3-58) contain the rate constant described by Equation (2-80), which is only a function of the mixture temperature. When computing the chemical kinetics of this model, the temperature is held constant, but it is this rate constant that provides the key to modeling ignitors. When an ignitor is activated, Equation (2-111) in Section 2.10 is evaluated with a temperature of 2000K, which effectively ignites the flammable mixture.
88
3.2.10.2 Two-step Model
For this model, as for the one-step model, the three species hydrogen, oxygen, and water vapor are involved in the chemical balance. The mass equation [Equation (36)] for each of these species is
(3-61) PO2V -P:2v" - S;bn,cornbustion V" At A
A
and the energy equation [Equation (3-8)] is
When the induction parameter is greater than 1, meaning that energy is released, the mass source term for Equalion (3-54) for hydrogen is calculated in two different ways depending on the regime the combustion is in.
If the local turbulent Reynolds number is smaller than a critical value, the combustion takes place in a quasi-laminar regime. Hydrogen is burned in a stepwise linear way. The rate depends on the energy release time and the subcycle time step:
If the local turbulent Reynolds number is greater than a critical value, the combustion takes place in a fully turbulent regime. Assuming the Damkoehler number (ratio of induction time to turbulent time) is greater than the ignition/extinction criterion, the mass source term for hydrogen is calculated as follows: -(c;
2.A ,
- C i 2 ) = -.
rt
' h n
-
The resulting mass source terms for oxygen and water vapor are
89
and the energy source term A
'1,combustion
-
= 'c'
(3-66)
In case the Damkoehler number is smaller than Die ,no hydrogen is burned, so the mass and energy source terms are zero. If the energy is released in a quasi-laminar regime in a stepwise linear way, the combustion time step is determined by dividing the minimum value of the energy release time by the number of time steps used for energy release: Atcombustwrl
-
-relstep tre1,min
-
(3-67)
The value of velstep can be input by the user; the default is 1.
If the combustion time step is very small and would determine the time step of the next cycle, the combustion will be subcycled with this time step to allow for a larger time step in the fluid dynamics routines. 3.2.11 Hydrogen Recombination
For the hydrogen recombination chemical kinetics, three species-hydrogen, oxygen, and water vapor-are involved in the fundamental chemical balance. The mass Equation (3-6) for each of these species is
A
A
P0,V -P:2vn - Si02 ,recombinationV" At
and the energy Equation (3-8) is pAIAVA- p " I T - $recombination V" At
.
(3-69)
90
Each of the recombiner models currently modeled in GASFLOW are described in Section 2.9 [Equations (2-94), (2-99), (2-106), and (1-109), where a reaction rate b, was of hydrogen. developed for the consumptio~~ In each of these cases, the change of hydrogen concentration is computed from Equation (3-57) in the form
or the recombination source terms for the species mass equations
(3-71)
and the energy source term (3-72) 3.2.12 Ventilation System
The 1D duct Phase A solution is the same as the multidimensional Phase A solution for a finite control volume as described above, with the following exceptions: (1) each 1D duct cell has two neighboring cells, so the summation over cell faces for a 1D duct cell is over the left and right cell face; (2) junction cells can have from one to six cell faces, and therefore the summation over cell faces is over the number of ducts connected to the junction cell; (3) inclusion of wall shear into the momentum equation;
(4) inclusion of the change in elevation to appropriately account for the change in the gravity body force between the 1D duct and junction cells,
(5) inclusion of flow loss coefficients (i.e., user provided flow loss coefficients, filter model flow loss coefficients, damper model flow loss coefficients, area change loss coefficients, and curved duct loss coefficients); (6) inclusion of momentum source term to represent the blower/fan performance; and 91
(7) incorporation of the momentum flux terms for 1D ducts and junctions into the Phase A solution to improve computational stability.
The finite control volume equations are consistent between the 3D and 1D solutions in GASFLOW. The turbulent loss coefficients and wall shear loss coefficient in the 1D duct models are combined into a single total loss coefficientand included into the momentum equation using Equation (3-5) with CD replaced with the total loss coefficient. The total loss coefficient is given as, K, = Kd + Kl + K f i+K,+ K c +-fi ,
(3-73)
Dh
where Kd is the damper loss coefficient, Kd is the user input loss coefficient, I$ is the filter turbulent loss coefficient, K, is the loss coefficient associated with an area change, K, is the loss coefficient associated with a curved duct, f is the friction factor, L is the length of the control volume and Dh is the hydraulic diameter. The filter laminar loss coefficient (K,)is proportional to the velocity as compared to the turbulent loss coefficients which are proportional to velocity squared; therefore, the filter laminar loss is included in the Phase A solution as an explicit momentum sink. The gravity body force term in the 1D equations is written as (3-74)
where cos8 is the change in elevation for the momentum control volume divided by the length of the control volume and gc is the acceleration of the gravity constant. The Phase A momentum equation with all relevant terrns for 1D ducts is as follows:
(3-75)
The Phase A momentum equation includes a momentum source term that represents blower operation. In the equation given above, Hbis the head in centimeters developed by the operation of the blower, and (3-76)
pkHbA
92
is the momentum source term associated with the operation of the blower.
In addition, the change in momentum flux term was moved from the Phase C solution to the Phase A solution to improve the stability of the 1D numerics for calculations involving abrupt area changes. In the phase A momentum equation given above, the momentum flux term is the last term in the numerator. 3.3
Phase B: Implicit Pressure Iteration Phase
3.3.1 Three-Dimensional Developments
In this phase, an implicit evaluation of the time-advanced densities, velocities, pressure, and specific internal energy fields is achieved. The purpose of this phase is to compute time-advanced pressures to allow calculations of low-speed (low-Machnumber) flows without any time-step restrictions from the fluid sound speeds. The following argument (Ref. 3-1) explains the need for this step.
In an explicit method, pressure forces can be transmitted only one cell each time step, that is, cells exert pressure forces only on neighboring cells. When the time step is chosen so large that sound waves should travel more than one cell, the one cell limitation is clearly inaccurate and a catastrophic instability develops. The instability arises because the explicit pressure gradients lead to excessive cell compressions or expansions when multiplied by too large a time step. This then leads to larger pressure gradients the next cycle, which try to reverse the previous excesses, but since the time step is too large the reversal is also too large and the process repeats itself with a rapidly increasing amplitude. The over response to pressure gradients in this fashion is eliminated by using time-advanced pressure gradients, for then cells cannot compress or expand to the point where gradients are reversed.
In this phase, the mixture differential equations for cell volume [Equation (2-8)], mass [Equation (2-7)], momentum [Equation (2-13)], and energy [Equation (2-14)] are V BAt
= VnV ~ [ ( A u )-~(Au)"] ,
pBVB- pAVA =o At
(3-77)
,
(3-78) (3-79)
and
93
p BVB I B - p AV AI At
A
= - v " p " v - [ ( A ~ )~ (Au)"]
.
(3-80)
The equation of state for the mixture [Equation (2-25)] may be written as eBpBvB
T B=
a#h201
(3-81)
/
p B V BC X f R a a
and with the approximation for the mixture specific heat at constant volume A
c,(T ) =
(I" - I " ) (T B- T " )
(3-82)
we present an equation set, Equations (3-77) through (3-82), that is coupled with seven linear and one nonlinear [Equation (3-81)] algebraic equation in eight unknowns ( V B ,p B , u,", u:, uzB,p B , I B , and T B ) . We are able to reduce this equation set to a single Poisson equation involving the pressure change as the dependent variable.
The Poisson equation is solved for the change in the pressure field, and from the pressure change, the volume, velocity, density, and internal energy fields are found by back substitution.
The Poisson equation is derived as follows: (1) The left-hand side of the conservation of energy Equation (3-80) is manipulated using the conservation of mass Equation (3-78), the equation of state (3-81), and the specific heat approximation (3-82) to yield (3-83)
(2) The right-hand side of Equation (3-83) can be modified using the conservation of volume Equation (3-77); and, in addition, pAVBis subtracted and added to the numerator of the left-hand side to give
(3) Rearranging Equation (3-84) yields the following: 94
(v"- v")
(3-85)
V"
(4) This equation can be linearized by rearranging (V,"- VsA) / V," and then applying a binomial series to obtain
(v"- v")-- (v"- v")
(3-86)
I
V"
provided
V"
'"1
V"
I
)T;+'+ OAT,I;
=
-(1- O)AeT:+,
The coefficients in cylindrical coordinates are the following:
(B-27) with
- r, +re r=-
2
, r,=-
rj-1
+ rj
2
r. + rj+l , r e = L Ar =l(re -rw)l 2 9
I
(B-28)
(B-30)
The absolute values for Ar in Equations (B-28) and (B-29) allow one to simulate with the same equations the conditions in which the radius at the west side of the structure is larger than at the east side, i.e., for convex slabs. 4.2
Boundary Conditions
4.2.1 General. In cylindrical coordinates, a wall has two boundaries: the front (or west) is the inside surface, and the back (or east) is the outside surface, as shown in Figure B-7. The solid surface element at either boundary is Ar thick, where Ar = qqre on the east side and Ar = re - ro on the west side. The fluid temperatures at the boundaries are Tfe on the east side and Ti, on the west side.
B-8
TN-1
TN N '
east bourday j= N
we9 . . bourday . . . . .1: j=O .: . . . . .
Figure B-7.
Configuration $or a two-sided cylindrical heat-conducting element
The heat balance for the west (front) boundary element at j=O yields -
4 P C P ) , (T,"" -T,") At
=
((1- O)(T:
- T,") + O(T,"+l- T:+'))k,re/Are
(B-31)
- (hW(@T;+l+ (1- O)T," - Th) + q , ) ~
This gives the following linear equation for the boundary temperature To
+ ((1-@)(Ae + qhwro)- l)T,"
- (1+@(A, + qhwro))T:+' -t@A,T,"+I
, -(1-@beT," -~O(hwTw+)9
with
1
(B-32)
(B-33)
&e = -, 2
he= l(rI - ro)l, re = (r1 +ro) , -r = (re +ro) 2 2
The heat balance for the east (back) boundary element at j = N yields
B-9
(B-34)
(B-35) which results in the linear equation for the boundary temperature mirrored form of Equation (B-32), shown as
TN
that is the
with
q=-
rhr
At ("P)N
, A w = -kN'Tlrw hr,
,and
(B-37)
(B-38) Specified Heat Flux. Instead of using the fluid temperature with a heat4.2.2 transfer coefficient h and the condensation/vaporization heat flux qc, one could also solve for the boundary temperature with a specified total heat flux. The specified total heat flux would be qw on the west surface and qe on the east surface. The heat flux may be specified on one or both surfaces. For specified heat fluxes at both boundaries, Equations (B-32) and (B-36) are written with the heat-transfer coefficient h set to zero and with the condensation heat flux qcw and qce replaced by the total heat fluxes qw and qer respectively. The total heat flux is supplied as input with a positive value on either structure surface, denoting an energy addition. The total heat flux may be specified on one or both surfaces. Adiabatic. For an adiabatic boundary condition, no heat flows across the surface. A zero temperature gradient then exists at the surface. For adiabatic boundary conditions on both surfaces, Equations (B-32) and (B-36) are written without any heat transfer from the fluid side by zeroing both surface values: 4.2.3
qcw=h=O.
(B-39)
Adiabatic boundary conditions may be specified on one or both surfaces. Specified Surface Temperature. When using specified surface temperatures at both surfaces, one applies directly the input surface temperatures Tsw and Tse, and Equations (B-32) and (B-36) are replaced by the following:
4.2.4
T,"+' = T, = input for west surface, T{+' = T,, = input for east surface
Surface temperatures may be specified on one or both surfaces.
B-10
.
(B-40)
*
5
SUMMARY OF NUMERICAL EQUATIONS
GASFLOW solves the 1D structural heat-conduction equations by using a variable mesh Crank Nicholson method.. The numerical equations described above may be cast in the form of the following equation to solve for temperatures Tn+l at the end of time step, given temperatures Tn at the beginning of the time step for all nodes j from 1 to N, per the following equation:
aT,”’,
+ bTj” + cT+,
=
r
.
(B-41)
Equations for nine cases are cast into Equation (B-41):interior nodes; and boundary nodes at the east and west surfaces for general, specified heat flux, specified temperature, and adiabatic boundary conditions. The coefficients a, b, and c, and the terms on the right hand side, designated by r, in Equation (B-41) are summarized in Table B-1 for nodes 1 through N.
B-11
Table B-1. Coefficients and Terms for Heat-Conduction Algorithm
Case
i
a
b
C
r -(1- @)hwTL,- (1 - @)AeT,l,
@Ae
Interior
1to N-1
General
0
Specified q
0
Adiabatic
0
(l+OAe)
Specified T
0
1
General
N
Specified q
N
@Aw
-(l+ @Aw)
0
Adiabatic
N
@Aw
-(l+@A,)
0
Specified T
N
0
@AW
-(l+@(Aw+AJ)
0
(l+@A,)
+ ((1 - @)(Aw+ A,) - 1)T'
@&
0
Tsw
0
0
1
B-12
=,e
1
Expressions for expanding parameters used in the coefficients in Equation (B-41) into primary variables are listed below: Cartesian Coordinates
xl-xo
forj=O
I=
forj=O
xj+]- xjP1 forj = l,N - 1 pCp = xN- xN-, for j = N
Axw = xj - xj-l,Axe = Xj+] xj ’-
Cylindrical Coordinates
1
l(r, -roll
forj=O
forj=N
1
forj=o
liifro)
h=)$ ~(rj+l-rj-,)~forj=lyN-l , ?=)$ (rw+re) f o r j = l , N - l
l(rN- &-l)I for j = N
forj=O
1
forj=N
J
pc,=
B-13
for j = N
(r, +re)
1
APPENDIX C. PRECONDITIONED CONJUGATERESIDUAL ALGORITHM
1
INTRODUCTION
The pressure equation [Equation (3-91), Section 3.31 is solved by the preconditioned conjugate residual (PCR) method described in this section. Consider the linear system
Az = b, where A is an n by n symmetric positive definite (SPD) matrix, z is a solution vector, and b is known. The residual vector r b - Ax, a measure of error of any vector x from the exact solution given in Equation (C-l), is the focus of the development that follows. Variable definitions thlat are applicable only in this appendix are listed in Section 2 below. DEFINITION OF VARIABLES
2
A b B D
k
L M n
P Q q r r U V h
X Z
ak
bk e 1
n-by-n SPD coefficient matrix Right-hand side vector Diagonal of matrix A Diagonal of matrix M Iteration count Strictly lower triangular part of A n-by-n SPD preconditioning matrix Number of equations to be solved Search vector Nonsingular matrix such that M = Q Q T Working array Residual vector for preconditioned system Residual vector ( r f 3, Ax ) Strictly upper triangular part of A Cell volume Solution vector estimate Solution vector for Az = b Step length Orthogonalization coefficient Global convergence criteria Eigenvalue
-
c-1
3
MOTIVATION
The guiding philosophy behind the PCR method can be shown by first considering the functional E,(x) defined as
E,(x)
E
$((x-z),A'(x-z))
,
K-2)
where (v, w) denotes an inner product for vectors v and w. For example, (x, Ax) I xTAx. E,(x) is defined as the error functional and is equal to one-half the square of the Amnorm of (x - z). The exponent p takes on positive integer values; p = 1 for conjugate gradient minimization, and p = 2 for conjugate residual minimization (the choice made here). Recalling r = b - Ax = -A(x - z), we write E ~ ( x )as
E2(x) = +(A(x-z),A(x-z)) = $ ( r , r )
.
(C-3)
It follows that the minimum of E(x) as x varies over Rn is
Hence, the problem of minimizing the quadratic error functional Ez(x) is seen to be equivalent to solving the original linear system [Equation (C-l)] with the solution being x = z in each case. The goal of the PCR procedure is to successively calculate improved estimates for the solution vector xk,
by minimizing E(x) along yet-to-be-determined search directions, pb where ak and bb are constants. Substituting Equation (C-5) into Equation (C-3) gives
The optimum value of ak minimizes E ~ ( x )with respect to ak
or
Because constant values of E(x) correspond to level surfaces (hyper ellipsoids) in Rn, it is natural to select the negative gradient of E(x) [Equation (C-3)]as the search c-2
direction, with -E(xk) being the direction of most rapid change at x. This is equivalent to using r as the search direction vector p in Equation (C-5) and is known as the method of steepest descent. The set of residual vectors ri (i = 0,k) in the steepest descent method is not usually linearly independent, and if the condition number of A, k(A) = lmax/lmin, is large (corresponding to highly elongated ellipsoids), the convergence can be slow. Instead, we compute pkas follows:
subject to the requirement (pi, Apj) = 0 for i f j S n
.
(C-10)
Computed this way, the search directions, pi, are A-conjugate (or A-orthogonal) to all other directions pj, and the solution vector x k computed from Equation (C-5) will minimize E2(xk)over the span (po,pl, . . . Pk} (Ref. c-1).Chandra (Ref. c-2) shows that the family of conjugate direction methods (which includes the conjugate residual method) are optimal among all1 linear iterative methods with respect to E,(x).
The orthogonalization coefficient bk is found by substituting Equation (C-9) into Equation (C-10)
4
PRECONDITIONING
The solution to Equation (C-1) can be obtained more rapidly if we precondition the system Ax = b. Instead, we solve A'x' = b' ,
(C-12)
where A = Q-IAQ-T, x' = QTx, b' = Q-lb, and Q is a nonsingular matrix. If Q-1AQ-T= I, then k(A) is small and A' = Q-1Q-T. Defining M I Q-1Q-Tas the preconditioning matrix, we use the factorization of Dupont, Kendall, and Rachford (Ref. C-3) for M,
M = (L +D)D-l(D+ U) ,
(C-13)
to solve a system of the form M u = v, which may be inverted rapidly by an LU decomposition. (LU refers to a matrix procedure operating on the Lower and Upper off-diagonal terms.) The additional effort required to solve for u is more than offset by the faster convergence of the PCR algorithm presented in the next section.
c-3
5
THE NUMERICAL PCR ALGORITHM
The solution to the linear system [Equation (C-l)] is obtained from the following version of the PCR method and closely follows the algorithm of Chandra (Ref. C-2, Section 5.4). Step 1. Initialization
Choose xo
(C-14a)
ro = b - h 0
(C-14b)
Solve: M ~ =o ro forto
(C-14~)
Po = ro
(C-14d)
I\
I
If [ ro/V
Im
< e for 1I m 5 n, quit (solution is already converged).
(C-14e) (C-14f)
(C-15a)
(e-1%) (C-15~) (C-15d) (C-15e) (C-150
(C-16a) (C-16b)
C-4
REFERENCES
C-1.
G. H. Golub and C. F. Van Loan, Matrix Computations (The Johns Hopkins
C-2.
R. Chandra, ”Conjugate Gradient Methods for Partial Differential Equations,” Ph.D. Thesis, Yale University (1978).
C-3.
T. Dupont, R. P. Kendall, and H. H. Rachford Jr., ”An Approximate Factorization Procedure for Solving Self-Adjoint Elliptic Difference Equations,’’ SIAM J. Nurner. Anal. 5,559 (1968).
University Press, Baltimore, 1983).
c-5