1Department of Geography, University of California, 405 Hilgard Avenue, Los Angeles, CA. 90024, USA; 2population Research Center, The RAND Corporation, ...
Population Research and Policy Review 11: 145-156, 1992. © 1992 Kluwer Academic Publishers. Printed in the Netherlands.
Gauging Hispanic voting strength
Paradoxes and pitfalls WILLIAM A. V. CLARK 1 & PETER A. MORRISON 2 1Department of Geography, University of California, 405 Hilgard Avenue, Los Angeles, CA 90024, USA; 2population Research Center, The RAND Corporation, 1700 Main Street, Santa Monica, CA 90407, USA
Abstract. How a minority group's demographic presence in a district translates into a presence
among the voters in that district is a matter of growing importance to political scientists and courts. This paper examines technical problems in measuring the concentration of Hispanic voting strength among the eligible voters in an election district. We document and analyze several limitations with existing demographic data in localities where a minority has a distinctive citizenship, ethnic, and age makeup. Our findings show how different measurement techniques may distort or clarify one's view of local Hispanic voting strength. County-wide measures of age and citizenship have a generic limitation: using such measures to infer the character of particular county sub-areas may falsely inflate the apparent voting strength of Hispanics. Other specific limitations relate to (1) the use of voting-age population (or self-reported voting-age citizens) in gauging the actual concentration of Hispanic registrants in an area and (2) the definition of 'Hispanic' itself.
Introduction The 1990 census ushered in the decennial redistricting process and, with it, an intense interest in the local voting strength of specific minority groups. That interest translates into a practical need to gauge minority voting strength in particular places. Do proposed district boundaries advantage one group of eligible minority voters (e.g., Hispanics) at the expense of another (e.g., Blacks)? Is one group a majority of the voting-age citizens in a proposed election district? Does a vote cast in one district carry the same weight as one cast in other districts? Answering such questions would be relatively straightforward for, say, an entire county. Below that scale, the standard measures needed are not readily available, which makes measurement both problematic and controversial. Such measurement issues in voting rights analyses surfaced in the mid-1980s and centered on how to gauge local Hispanic voting strength from 1980 census data. Their importance has grown as 1990 census data reveal newlyemerged local ethnic pluralities and the complex manner in which citizenship and local residential patterns shape voting strength. Accurate electoral measurement is now a critical link between laws governing electoral representation and local election districts formed to fulfill these mandates. For the geographic scale at which most election districts are drawn, however, local
146 geography and distributions may severely confound measures that are available only at much larger geographic scales (e.g., whole counties). In this paper, we examine several such confounding effects and consider how they can threaten the integrity of electoral measurement. We then describe approaches we have devised for estimating the concentration of Hispanic voting strength among eligible voters in an election district. Electoral measurement may be severely confounded for Hispanics, but the underlying problem - and how we address it - generalizes to any population with a distinctive citizenship and residential settlement pattern.
Illustration of the problem
We begin with a concrete illustration. The City of Salinas, California, exemplifies an emerging general problem as local election districts must be reorganized to accommodate an ethnic majority or plurality that now exists. In 1980, Salinas was a city of 80,000, thirty-eight percent of whom were Hispanic. Among voting-age persons, however, fewer than 32 percent were Hispanic. By 1990, the population had increased 35 percent to 109,000, with Hispanics now 51 percent of all residents and 44 percent of all adults. Politically, Salinas is divided into six city council districts, with boundaries drawn to make them equally-populated as of 1980. The 1980 population included 12,300 noncitizens, mostly Hispanic and mostly residing on the City's north side. Following the 1990 census, the City Council boundaries had to be redrawn (in accordance with legal requirements) to equalize the distribution of population among districts. By every indication, noncitizens remained a sizeable fraction of all city dwellers, although their exact numbers in each individual district were unknown at the time redistricting had to be done (since 1990 census data on citizenship had not yet been released). The only known fact was that the Hispanic adult population in Salinas apparently included at least 10,587 noncitizens, based on data from the Immigration and Naturalization Service (INS). 1 That number represents 32 percent of all voting-age Hispanics citywide in 1990. The residential distribution of these noncitizens among the six council districts in a rapidly growing city bears directly on key legal issues in redistricting (Clark & Morrison 1991). The city's existing boundaries divided its population equally among its council districts, based on 1980 census data. By 1990, that division had become severely imbalanced, since population increased unevenly in differ1The INS has tabulated by postal zipcode the number of legalization applications it received through February, 1991. These applicants (classified by country of birth) are non-citizens who have applied to legalize their status. The number of applicants from a particular zipcode indicates the minimum number of noncitizens there, since applicants are a subset of all noncitizens. See Hoefer (1991).
147 Table 1. Population balance: old and proposed new Salinas city council districts compared
Total population Council district
Old plan
% Deviationa
New plan
% Deviationa
1 2 3 4 5 6
21,700 17,605 13,848 13,989 24,291 17,344
19.69 - 2.90 - 23.62 -22.84 33.98 -4.34
18,287 17,923 18,707 17,696 17,510 18,651
0.87 - 1.14 3.18 -2.38 -3.42 2.87
Totals Ideal total Total deviation
108,777
108,777
18,130
18,i30 57.60%
6.60%
Source: Census of Population and Housing, 1990: PL 94-171 data. a% Deviation is each district's relative deviation from ideal. bTotal deviation is the sum of the largest negative and largest positive % deviation, regardless
of sign. ent parts of the city. To m e e t legal requirements, boundaries had to be redrawn to equalize each district's total population, but without diluting Hispanic voting strength. At the same time, the vote cast by a citizen in one district should carry the same weight as one cast by a citizen in any other district. These legal considerations m a d e it necessary to know how m a n y of the inhabitants in each district were citizens 18 years of age and older (i.e., entitled to vote) and what fraction of them were Hispanic. Without any direct measure of 1990 citizenship available, an estimate was necessary. Table 1 shows the imbalance by 1990 in need of correction. District 1 with 21,700 inhabitants was 19.69 percent overpopulated relative to the ideal onesixth population (18,130); conversely, District 3 with only 13,848 inhabitants was 23.62 percent too small. Various adjustments to district boundaries could eliminate these imbalances, but any such adjustments would be closely scrutinized for possible dilution of Hispanic voting strength. 2 A proposed new plan (shown in Table 1) rebalances the districts in terms of total population and avoids weakening Hispanic voting strength. A n o t h e r m o r e vexing problem, however, appears in Table 2: votes m a y not carry equal weight in each district. U n d e r the old plan, District 1 contains 19.9 percent of all inhabitants in 1990 and 17.4 percent of the voting-age population; yet its boundaries include only one-twelfth (8.5 percent) of the City's 36,338 registered voters. This disparity means that one-twelfth of all registrants in Salinas would determine who gets elected to one of the City's six council seats. Apparently, a vote cast by a resident of District 1, then, 2Suppose, for example, that District 2 boundaries were expanded to encompass a neighborhood with an additional 525 persons, of whom only 10 percent were Hispanic. District 2 would then contain 18,130 people, exactly the ideal population. However, there would be only 53 more Hispanics, which reduces their concentration nearly two percentage points.
148 Table 2. Measures of electoral inequality: Salinas, 1990 (old plan)
Council district
Total population (%)
Voting-age population (%)
Registered voters 1991 (%)
1 2 3 4 5 6
19.9 16.2 12.7 12.9 22.3 15.9
17.4 14.8 14.4 13.7 23.6 16.1
8.5 12.1 18.1 17.3 24.6 19.3
100 (108,777)
100 (73,895)
100 (36,338)
Totals: % N
would carry more weight than a vote cast in another district. The same disparity (although to a lesser extent) is seen in District 2: the District contains 16.2 percent of total population, 14.8 percent of voting-age population, but only 12.1 percent of registrants. Conceivably, such disparities merely reflect electoral apathy in Districts 1 and 2. Both districts, however, are known to contain a disproportionate share of noncitizens: The INS data show that most legalization applications from Salinas originated from a single postal zipcode that encompasses Districts 1 and 2, but little else of the City. Hence, the absence of many votingage persons in these two districts from the citywide registrant pool reflects more than apathy. The presence of many noncitizens, then, diminishes Hispanics' apparent voting strength - but to what extent? The answer depends on how one measures the percentage of electors in the district who are Hispanic. This generic problem exemplified in Salinas appears in other cities having a significant presence of Hispanics, and will surely arise in the future. The following section further examines its manifestations and considers alternative solutions to the problem. We extend our analysis to derive several broad insights into how a minority group's demographic presence translates into actual voting strength.
Nature of measurement issue
Gauging the size and ethnic composition of the adult citizen population poses four distinct measurement issues for small areas. The first is applying demographic measures available at one geographic scale (e.g., the county) to a smaller scale (e.g., the census tract or block group). The second is adjusting for citizenship misreporting (the tendency of noncitizens to report themselves as citizens). The third is operationalizing 'Hispanic' using the extant census categories. The fourth is ascertaining how a particular group's demographic presence in a voting district translates into a presence among the district's potential electors.
149 Pitfalls in 'scaling d o w n ' estimates
Los Angeles County illustrates the first issue. There, it was necessary to estimate the Hispanic makeup of voting-age citizens in a collection of heavily Hispanic census tracts defining a plaintiff-proposed election district. The critical unknown was whether or not Hispanics constituted a majority of voting-age citizens in the proposed district. Unfortunately, the only data routinely available on this point are the Census Public Use Microdata Sample (PUMS). From PUMS, one can tabulate the number of Hispanic citizens age 18 and older for areas with at least 100,000 persons. In this instance, the 1980 PUMS tabulation referred to Los Angeles County as a whole and showed Hispanics to be 14.6 percent of the County's 4,503,260 voting-age citizens (Table 3). Table 3. Populationof Los Angelescountyand a 'hypothetical'election district: 1980
Los Angeles
Proposed Hispanic district
7,477,503 2,065,503 27.6%
1,392,114 951,961 68.4%
4,503,260 657,440 14.6%
594,711 298,460 50.1%
4,515,239 659,375 14.6%
554,562 260,243 46.9%
Total count
Total population Hispanic population Percent Hispanic PUMS-based measures
Voting-age citizens Hispanic voting-agecitizens Percent Hispanicvoting-agecitizens Census tract data
Voting-age citizens Hispanic voting-agecitizens Percent Hispanic
One way to estimate the relevant quantities is to apply the county-level ratios to the proposed district. According to PUMS, self-reported citizens (countywide) are only 31.7 percent of all voting-age Hispanics but 70.9 percent of voting-age non-Hispanics. Multiplying the number of voting-age Hispanics (or non-Hispanics) in a particular tract by 0.317 (or 0.709) yields a PUMS-based estimate of the respective numbers of citizens. This approach implies that the district's voting-age citizen population is 594,711, of whom 50.1 percent are Hispanic. This 'stepped-down' estimate entails a major and questionable assumption - that noncitizens are distributed uniformly among residents across the entire county, without significant concentrations of noncitizens in certain areas. We tested the validity of that assumption using a more detailed specialorder tabulation the Census Bureau makes available. The tabulation shows the voting-age citizen population that was enumerated in individual census tracts within the County. Thus we have the same compositional variables as with PUMS, but as actually measured for (rather than scaled down to) the individual tracts. Both datasets agree closely at the county level (as they
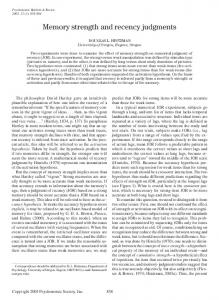
150 should), since each is based on a sample of the county universe. However, they disagree - and significantly - for the predominantly Hispanic election district (Table 3). The PUMS-based estimate implies 594,711 voting-age citizens, 298,460 of whom are Hispanic, but the actual numbers (specially tabulated) are 554,562 and 260,243, respectively. Thus, there are 40,149 fewer voting-age citizens, and 95 percent of the overestimate (38,217 too many Hispanics) is attributable to the PUMS-based overestimate of Hispanic voting-age citizens. Clearly, the County-wide demographic portrait drawn by PUMS is an unreliable basis for estimating the detailed reality in this particular district. For electoral analysis, the critical disparity here is in the fraction Hispanic. The scaled-down PUMS measure implies that Hispanics constitute a bare majority of the voting-age population in the hypothetical district; according to the actual enumeration of Hispanic citizens, though, only 46.9 percent of voting-age citizens are Hispanic. This disparity has important legal significance: when Hispanics are less than a majority, a proposed district fails one of the preconditions established by Section 2 of the Voting Rights Act (the requirement that plaintiffs show that it is possible to create an effective Hispanic voting majority in one of the districts to be formed). Politically, the 50.1 percent estimate fosters the illusion that Hispanics predominate (although actually non-Hispanics are 53.1 percent of voting-age citizens).3 To uncover the source of this discrepancy, we analyzed the pattern of disagreement throughout Los Angeles County between the PUMS-based estimate and the actual tract-level enumeration. Our analysis reveals that use of the county-wide factor introduces a systematic bias that overstates the presence of citizens among Hispanic adults precisely where Hispanics are a high proportion of adults. Deviations shown are the relative differences between the actual number of voting-age Hispanic self-reported citizens and the PUMS-based estimate of that number. The pattern of bias is consistent with three known features of Los Angeles County's Hispanic population: its distinctive age and citizenship makeup, the spatial concentration of Hispanic newcomers, and the residential dispersion of native-born Hispanics. Consider, for example, a tract where only 10-19 percent of the voting-age citizens enumerated in that tract were Hispanics. We find that the number of Hispanic voting-age citizens enumerated there exceeds the PUMS-based estimate of that number by 22.2 percent on average. The likely explanation is that in tracts where Hispanics are relatively less concentrated, the Hispanics there are citizens more often than is the case county-wide. Conversely, where over 50 percent of the voting-age citizens enumerated in the tract were 3Based on INS data (see footnote 1 above), we estimate that over 678,952 of Los Angeles County's voting-age Hispanies were noncitizens in 1990. That number is 31.2 percent of the County's 1990 adult Hispanic population. Over 218,000 noncitizens were within the proposed election district (approximated by 32 postal zipeodes lying wholly or mostly within it), constituting 29.6 percent of the district's 1990 adult Hispanic population.
151 A v e r a g e Deviation a P.U.M.S. overestimates -10% 60%÷
,
P.U.M.S. underestimates
0
+10%
"~20% +30%
+40%
-2.31 i
40-49% '
o~
30-39%
,=_
.-.2 2 0 - 2 9 % "P
+2.1 i
I.o., i
10-19%
0-9%
m
Figure 1. The pattern of the average deviation. ~Deviation -
Actual - PUMS estimate
PUMS estimate bActual enumeration among self-reported voting-age citizens.
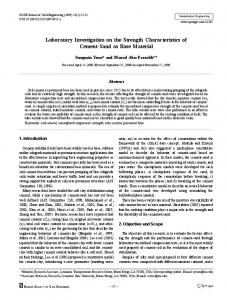
Hispanic, their actual numbers there were 2.3 percent less, on average, than the number indicated by PUMS. In these tracts of higher Hispanic concentration, the Hispanics living there are citizens less often than is the case countywide. The pattern of the average deviations shown in Fig. 1 document a systematic bias: the county-wide factor overstates the fraction of voting-age citizens who are Hispanic in those tracts where Hispanics are the highest proportion among adults; it understates that fraction elsewhere in the County. The pattern of bias here is not altogether surprising given what is known about the ethnic enclaves formed through migration. In Los Angeles, San Diego, Salinas, and many other California jurisdictions, channelized migration has concentrated noncitizens disproportionately in certain neighborhoods, as foreign immigrants join friends or relatives (Jones 1982). Second, Hispanic immigrants are concentrated in the prime childbearing ages; any children they bear in the United States add citizens to the population, but not in the voting-age range (Davis et al. 1983). Within such prime childbearing ages; any children they bear in the United States add citizens to the population, but not in the voting-age range (Davis et al. 1983). Within such jurisdictions, certain heavily Hispanic areas are distinctive immigrant enclaves, populated by adult Hispanics who tend to be non-citizens and by citizen-Hispanics who tend to be underage. A related and revealing finding pertains to the level and distribution of citizenship across tracts. The data in Figure 2 compare the percentage of voting-age persons who are citizens among non-Hispanics and Hispanics. The contrast is striking. Among non-Hispanics, citizens are 70 percent or more of the adults in most tracts, and hardly ever less than 60 percent. Among Hispanics, the range is much broader: In many tracts~ citizens are
152 800 600 400 ~= 200
0 0
!
~/./2 10 20 30 40 50 60 70
80 90 100
Figure 2. Percent Hispanic and non-Hispanic voting-age citizens by tract.
less than 40 percent of Hispanic adults; they rarely exceed 70 percent. Indeed, as measured by the variance, the Hispanic ratio variance is 2.5 times greater than the non-Hispanic ratio. In short, there is far more spatial variability among Hispanics than non-Hispanics in the citizenship status of adults. That variability is itself a reflection of each population's stage of assimilation and legalization. Among non-Hispanics, only a small fraction of all Los Angeles census tracts in 1980 exhibited the distinctive 'immigrant enclave' profile (noncitizens outnumbering citizens among the adult population). By contrast, the ratio of Hispanic citizens to total Hispanics is much more variable, and few tracts have proportions of Hispanic citizens above 50 percent. The difference in the means and the difference in dispersion provide further clarification of the errors which will be generated by county-wide analysis and of the reason it is difficult to create concentrations of Hispanic citizens.
Misreported citizenship A second problem arises from the fact that many Mexican-born persons misreported their citizenship on the 1980 census. Although noncitizens, they reported themselves as naturalized citizens of Mexican birth, and that is how the Census counted them. Such misreporting may well pose problems with the 1990 census data also, though it is too early to be sure. Misreporting was especially acute in Los Angeles County (Clark & Morrison 1991). We have previously reported that, in the hypothetical election district in Table 1, the actual number of Hispanic citizens is something less than the 260,243 self-reported Hispanic citizens enumerated in 1980. Using Census Bureau staff calculations (Warren & Passel 1987; Passel & Woodrow 1984) for Los Angeles County as a whole, we calculate that the Hispanic citizen population 18 years and older is 529,017, not 659,375 as self-reported. Adjusting the Hispanic population to allow for misreported citizenship would further reduce the measured Hispanic percent in Table 3 to a level below 46.9 percent. (A corresponding adjustment to 1990 census data will be possible only if the Census Bureau studies misreporting and furnishes quantitative bases for making such adjustments.)
153
Delineating the 'Hispanic' population The social, economic, and cultural diversity of ethnic groups may cloud (and even nullify) the logic of lumping them together under umbrella categories like 'Hispanic'. 'Hispanic' as a category sometimes obscures genuine political distinctions. Among the candidates in a 1985 Salinas City Council election, for example, one Hispanic candidate (of Mexican descent) garnered his strongest support in the most heavily Hispanic election precincts, indicative of Hispanic support; another Hispanic candidate (of Cuban descent) garnered his strongest support in the most heavily Anglo precincts, indicative of Anglo support. Clearly, Hispanic candidates do not appeal uniformly to Hispanic voters. More generally, the population classified 'Hispanic' by the Census is not a single ethnic or racial group but rather a complex amalgam of various origins and descents. 4 The unifying element here is purely linguistic and encompasses such diverse nationalities as Mexican, Puerto Rican, Cuban, and Central and South American. For this reason, 'Hispanic' does not afford a clear-cut, totally unambiguous guide for measuring this minority. Rather, it is a generic term that affords a variety of defensible ways to define the population of interest in any particular setting.
Gauging a population's potential voting strength On occasion, it is necessary to confirm that the actual voting strength of Hispanics in a proposed election district or precinct exceeds some level. Although census data precisely measure the size and composition of a district's voter-eligible population, the electorate consists of the registered voters (or, more specifically, those who actually turn out) within the population. A particular group's electoral strength, then, is partly a function of how its demographic presence translates into a presence among the district's voters. Surname analysis can be used to gauge the potential voting strength of particular racial, ethnic, or language communities in a proposed district. This technique can indicate the approximate makeup of local electorates, showing the extent to which Hispanics' demographic presence translates into an electoral presence. Insofar as the surnames of voters belong uniquely to one racial or ethnic group, it is possible to identify their probable membership in such groups from well-formulated surname lists (see Morrison & Clark 4Bean and Tienda (1989: 398) argue that "it is impossible to speak of a single, unified 'Hispanic population'... (and at).., a minimum, those who seek to study 'Hispanics' must disaggregate this population by national origin, and preferably also by nativity..." Following this logic, it is misleading to aggregate 'Hispanics' to create a voting district comparable to African-Americans. In Los Angeles County, persons of Mexican origin make up almost 80 percent of the Spanish-origin population; but Cubans (2.24 percent) are a sizable group among the remaining 20 percent not of Mexican origin.
154 Table 4. Indices of Hispanic voting strengths in proposed new city council districts: Salinas, 1990
Council district
Population Hispanic All ages (%)
18 + (%)
Registrants Spanish surnamed (%)
1 2 3 4 5 6
84.9 77.9 36.1 33.1 28.6 42.8
81.2 73.0 31.0 29.1 25.1 37.8
60.4 53.7 15.1 17.7 17.1 27.0
Totals
50.6
44.4
26.0
Sources: Census of Population and Housing, 1990: PL 94-171 data; officialvoter registration
tapes as of June 1991. 1992 ) . Identifying the probable racial or ethnic background of voters from surnames alone is not a substitute for a census enumeration but can confirm the attainment of minority electoral opportunities. For example, it was necessary to gauge the potential voting strength of Hispanics in the newly-rebalanced Salinas City Council Districts 1 and 2 mentioned earlier. The two proposed districts were intentionally designed to concentrate Hispanic voting strength, and each had a predominantly Hispanic adult population: Hispanic voting-age population was 81 percent and 73 percent, respectively (Table 4). At issue was whether each district's majorityHispanic appearance translated into an actual majority of present-day electors there (recalling that many voting-age Hispanics are known to be noncitizens ineligible to vote). Surname analysis of all registered voters in each district demonstrated that Hispanics were indeed a majority of present-day electors in Districts 1 and 2: Spanish-surnamed persons constituted 60 percent and 54 percent, respectively, of all registrants as of 1991. Clearly, Hispanics constituted a majority of the voting-age citizens in each district. In other instances, surname analysis can yield important insights into the ethnic composition of voters in particular election precincts. In the City of Oxnard, California, an Hispanic candidate ran for office but lost repeatedly. He challenged the city's at-large system of electing city councilmembers, claiming that the system blocked Hispanics' opportunity to get elected. In one election, the Hispanic candidate had lost in every single one of the city's 66 voting precincts. Surname analysis of the actual voters in each precinct revealed that in several precincts the vast majority of voters were Spanishsurnamed. Clearly, then, this candidate had failed to attract the votes of many Hispanics. In that same election, another Hispanic candidate (running for a different office) won in 65 of the 66 precincts, including several where the vast majority of voters were non-Spanish surnamed. This candidate, then, had attracted the votes of many non-Hispanics (as well as Hispanics).
155 Surname analysis helped clarify the underlying realities about Oxnard's atlarge election system - namely, that an Hispanic candidate could attract voter support in mostly non-Hispanic precincts and win, or fail to attract voter support in mostly Hispanic precincts and lose.
Conclusion
How a minority group's demographic presence in a district translates into a presence among the voters in that district is a matter of growing importance to political scientists and courts. We have demonstrated how different measurement techniques may distort or clarify one's view of local Hispanic voting strength. County-wide measures of age and citizenship have a generic limitation: using such measures to infer the character of particular county subareas may falsely inflate the apparent voting strength of Hispanics. Other specific limitations relate to using voting-age population (or self-reported voting-age citizens) in gauging the actual concentration of Hispanic registrants in an area and to the definition of 'Hispanic' itself. During the 1990s, implementation of the Voting Rights Act will require precise measures of the racial/ethnic composition of the voting-age citizen population for small areas like census tracts and block groups. In the past, such measures have been available only on a 'special-order' basis (as was the case for Los Angeles County census tracts). Such measures will become critically important in the future, given the local concentrations of noncitizens that have emerged in many communities across the Southwest. To meet such needs, the Census Bureau should consider distributing a standard tabulation of the 1990 voting-age citizen population by race and ethnicity for all tracts (and even block groups) in which significant numbers of noncitizens were enumerated. Under such a criterion, only a tiny fraction of all tracts and block groups in the nation would be eligible for inclusion. However, such data could facilitate implementing the Voting Rights Act precisely where minority voting strength is vulnerable to mismeasurement and subject to legal dispute.
References Bean, F.D. and Tienda M. (1989). The Hispanic Population of the United States. New York: Russell Sage Foundation. Clark, W.A.V. and Mueller, M. (1988). Hispanic relocation and spatial assimilation: A case study, Social Science Quarterly 69: 468-475. Clark, W.A.V. and Morrison, P.A. (1991). Demographic paradoxes in the Los Angeles voting rights case, Evaluation Review 15: 712-726. Davis, G., Haub, C. and Willette, J. (1983). US Hispanics: Changing the face of America, Population Bulletin 38: 1-43. Hoefer, M. (1991). The legalization program in California. Presented at the 4th Annual Demo-
156 graphic Workshop on First Results of the 1990 Census, at the University of Southern California, Los Angeles. Jones, R.C. (1982). Undocumented migration from Mexico: Some geographical questions, Annals of the Association of American Geographers 72: 77-87. Morrison, P.A. and Clark, W.A.V. (1992). Local redistricting: the demographic context of local boundary drawing, National Civic Review (forthcoming). Passel, J.S. and Woodrow, K.A. (1984). Geographic distribution of undocumented immigrants: Estimates of undocumented aliens counted in the 1980 Census by state, International Migration Review 18: 642-671. Passel, J.S. (1988). Letter to John Weeks, 'Estimates of proportion Hispanic of citizens by age: 1980 Census, Los Angeles County, California'. Warren, R. and Passel, J.S. (1987). A count of the uncountable: Estimates of undocumented aliens counted in the 1980 United States Census, Demography 24: 375-394, and unpublished technical appendix.