Oct 24, 2011 -
Gender and Condylar Differences in Distal Femur Morphometry Clarified by Automated Computer Analyses Kang Li,1,2 Evan Langdale,1,3 Scott Tashman,1,4,5 Christopher Harner,1 Xudong Zhang1,4,5 1
Department of Orthopaedic Surgery, University of Pittsburgh, Pittsburgh, Pennsylvania, 2Department of Industrial & Systems Engineering, Rutgers University, Piscataway, New Jersey, 3Department of Mechanical Engineering, Johns Hopkins University, Baltimore, Maryland, 4Department of Mechanical Engineering & Materials Science, University of Pittsburgh, Pittsburgh, Pennsylvania, 5Department of Bioengineering, University of Pittsburgh, Pittsburgh, Pennsylvania Received 8 February 2011; accepted 29 September 2011 Published online 24 October 2011 in Wiley Online Library (wileyonlinelibrary.com). DOI 10.1002/jor.21575
ABSTRACT: We elucidated the gender and condylar effects on distal femur morphology (DFM) while evaluating a newly developed computational framework that enables fully automated analyses of DFM in an objectively defined sagittal plane. Ninety high-resolution CT-acquired distal femur models from 51 males and 39 females were analyzed. The models were accurately characterized (mean least-squares fitting residual 0.5), we normalized the measures to height to remove the effect of scale. The Hartigan’s Dip tests were again employed to inspect whether the distributions of the normalized morphometric measures were unimodal. If a nonunimodal distribution was indicated, nonparametric repeated-measures ANOVA were used to re-examine the gender effects on the normalized measures.
RESULTS The fully automated analyses successfully identified a unified sagittal plane for each of the 90 distal femur models, resulting in consistent orientations of the models. Orientations in the original CT coordinate systems varied considerably (Figs. 4 and 5). The analyses could correct or re-orient even severely misaligned 3D distal femur models in the nominal CT coordinate system. The rotational corrections needed to reach the unified sagittal plane ranged from �58 (valgus) to 58 (varus) and from �21.38 (internal) to 198 (external). The mean (�SD) correction angles were �0.58 � 2.78 in varus– valgus, and �5.78 � 7.58 in internal–external rotation. The process of correcting and unifying the sagittal planes reduced the eccentricity measure of dispersion of the posterior geometric center locations by >80% on average (Table 1). This reduction was much greater than a reduction of 61% found in our previous study20 in which the CT-based bone models had been manually prealigned prior to computerized analyses. Distal femur sagittal contours were accurately characterized by the curve-fitting procedures in Algorithm 2. The mean residual errors from fitting ellipses to the entire articulating portion of distal femur profiles were 0.17 and 0.16 mm, respectively, for the default and corrected sagittal cross-sections. The mean residual errors from fitting circles to smallest flexion facets were 0.10 mm for both the default and corrected sagittal cross-sections. Most DFM measures in the unified sagittal plane for each condyle were unimodally distributed, as the p-values from the Hartigan’s Dip tests for all the three measures ranged from 0.17 to 0.93. Differences between medial and lateral condyles in a, b, and r of
DISTAL FEMUR MORPHOMETRY
689
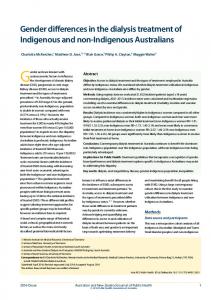
Figure 4. Bone models before (top row) and after (bottom row) sagittal plane correction. The models are viewed from the bottom to show the internal–external rotational correction. The four cases are representative of the models with (a) maximum internal correction, (b) rotation comparable to the mean value, (c) near zero internal-external correction, and (d) maximum external correction, respectively.
the smallest flexion facet also displayed unimodal distributions (p ¼ 0.32 for a, 0.78 for b, and 0.78 for r) when the bone models from both genders were combined (Fig. 6). However, the medial-lateral differences for males exhibited a trend towards multimodal distributions (p ¼ 0.12 for a, 0.15 for b, and 0.05 for r), whereas the differences for females seemed to follow unimodal distributions (p ¼ 0.51 for a, 0.85 for b, and 0.73 for r). Since the data did not consistently follow normal distributions, nonparametric repeatedmeasures ANOVA were employed.
No significant difference was found between limbs or between condyles for any morphometric measure. Significant gender effects were found on a (p < 0.0001), b (p < 0.0001), and r (p < 0.0001); an average male condyle size was 12–13% greater than an average female condyle size (Table 2). Correlation tests confirmed the existence of effects of scale on all three morphometric measures. Body weight had moderately high correlations with a (R ¼ 0.78) and b (R ¼ 0.79) of the ellipse and with r of the smallest flexion facet (R ¼ 0.74). The aspect ratio (a/b) of the best-fit ellipses
Figure 5. Bone models before (top row) and after (bottom row) sagittal plane correction. The models are viewed from the posterior to show the varus–valgus rotational correction. The four cases are representative samples of the models with (a) maximum varus correction, (b) near zero varus–valgus correction, (c) correction comparable to the mean value, and (d) maximum valgus correction, respectively. JOURNAL OF ORTHOPAEDIC RESEARCH MAY 2012
690
LI ET AL.
Table 1. Statistical Summary of the Eccentricity Measure, Fitting Residual Errors and Extracted Morphometric Measures, Comparing the Default and Unified Sagittal Planes
Eccentricity (mm) Ellipse fitting residual (mm) Medial Lateral a (mm) Medial Lateral b (mm) Medial Lateral a/b Medial Lateral Circle fitting residual (mm) Medial Lateral r (mm) Medial Lateral
Default Sagittal Cross-Sections
Unified Sagittal Cross-Sections
3.64 � 1.89
0.69 � 0.26
0.17 � 0.08 0.17 � 0.08
0.17 � 0.08 0.16 � 0.09
29.84 � 3.86 29.95 � 3.73
30.79 � 3.58 30.89 � 3.71
23.44 � 2.69 23.64 � 3.12
23.11 � 2.29 23.23 � 2.37
1.28 � 0.13 1.28 � 0.15
1.33 � 0.08 1.33 � 0.08
0.10 � 0.06 0.10 � 0.06
0.11 � 0.06 0.09 � 0.06
19.33 � 2.08 19.32 � 2.37
19.26 � 1.88 19.35 � 2.32
remained constant across condyles, limbs, and genders (Table 2) and was not associated with subject height. After normalization to height, a trend remained towards nonunimodal distributions of the differences between condyles in the morphometric measures for
All 20
20
a 10
10
10
0
10
0 −10
0
10
0 −10
20
20
20
b 10
10
10
0 −20
r
0
20
0 −10
0
10
0 −10
20
20
20
10
10
10
0 −10
0
10
0 −10
0
DISCUSSION Although distal femur morphometry has been studied for centuries,12 the DFM differences between genders and between condyles continue to perplex clinicians and basic science researchers. We completed a fully automated DFM analysis with a newly developed computational framework in an attempt to clarify the effects of gender and condyle side. This was also a continued endeavor to test and refine the framework. The fact that it could generate consistent, plausible morphometric measures for 90 distal femur models without any analyst’s intervention provides a testimony for its robustness and reliability. An important feature and distinct advantage of our study compared to previous DFM studies was the ability to objectively and consistently determine the sagittal plane for analyses and comparisons. We showed that a 3D bone model with a default sagittal plane defined by the knee position during CT imaging could be misaligned substantially from the unified sagittal plane. In fact, prealignement of distal femur models using a conventional manual method could still
Male
20
0 −10
Frequency
Female
males (p ¼ 0.267 for a, 0.174 for b, and 0.029 for r). The gender effects remained significant when the three measures were normalized by height (p ¼ 0.002 for a; p < 0.0001 for b; and p ¼ 0.004 for r). The interaction effect between gender and condyle side on b, which was only marginally significant prior to the normalization, became significant (p ¼ 0.05). Neither before nor after the normalization was an interaction effect detected by a conventional parametric ANOVA, suggesting the nonparametric test was more discriminating.
10
0 −10
0
10
0
10
0
Size difference between medial and lateral condyles (mm) JOURNAL OF ORTHOPAEDIC RESEARCH MAY 2012
10
Figure 6. Histograms of the differences between medial and lateral condyles in semimajor axis (a) and semi-minor axis (b) lengths of the ellipse, and radius (r) of the smallest flexion facet. The differences were calculated by subtracting the measures of lateral condyles from those of medial condyles.
DISTAL FEMUR MORPHOMETRY
691
Table 2. Statistical Summary of the Morphometric Measures Obtained in the Largest (and Most Prominent) Distal Femur Cross-Section Along the Unified Sagittal Plane, Comparing Genders, Limbs, and Condyles
Gender Male Female Limb Left Right Condyle Medial Lateral Overall
a (mm)
b (mm)
a/b
r (mm)
32.38 � 3.24 28.82 � 3.10
24.41 � 2.05 21.55 � 1.53
1.33 � 0.10 1.34 � 0.06
20.29 � 2.02 18.02 � 1.41
31.10 � 2.55 30.59 � 2.80
23.40 � 1.95 22.96 � 2.11
1.33 � 0.05 1.33 � 0.05
19.47 � 1.78 19.14 � 1.80
30.79 � 3.58 30.89 � 3.71 30.84 � 2.68
23.11 � 2.29 23.23 � 2.37 23.17 � 2.04
1.33 � 0.08 1.33 � 0.08 1.33 � 0.05
19.26 � 1.89 19.35 � 2.32 19.31 � 1.79
result in a significantly deviated plane.20 Such misalignment could distort the analysis, as illustrated in Figure 1 and shown in our previous study.20 We speculate the misalignment and the variability in alignment may have been major causes for controversy regarding the size difference between condyles in the sagittal plane.11 Our computer algorithms can eliminate the inter- and intra-observer variability in identifying the sagittal plane and extracting the morphometric measures, and establish consistently orientated distal femur models for further analyses. Our algorithms greatly expand the morphometric features that can be automatically extracted or measured.16 We also demonstrated how a prudent statistical approach can make a difference in quantitative morphologic studies with clinical implications. Improper choices of statistical methods are found in many published clinical studies and can result in incorrect conclusions.27 We chose a nonparametric repeatedmeasures ANOVA based on a careful inspection of the distributions of the dependent variables, and were able to detect a significant interaction between gender and condyle side. If classical parametric statistics were used, this interaction would not have been found, giving rise to the concern that inappropriate statistical tests may have contributed to contradictory findings regarding the size difference between condyles reported in previous studies. The automated computer analysis enabled inclusion of a sizable sample of 90 knees. Previous morphometry studies, as reviewed by Nuno and Ahmend,11 were based on labor-intensive manual analyses with much smaller sample sizes, making it difficult to gain insight into the distributions of morphologic measures stratified by gender. Furthermore, the automated computer analysis offered a powerful means for evaluating the effect of sagittal plane variation.20 Such a systematic ‘‘what-if’’ evaluation would be impractical with a manual method. Our study supports the conclusion that no difference exists in condyle size as measured in the
sagittal plane. When the distal femur articulating surface was characterized using an ellipse, the semimajor and semi-minor axis lengths did not show any difference between condyles; nor did the radius of the smallest flexion facet exhibit a condylar difference when the posterior distal femur articulating surface was characterized using a circle. These are not in agreement with findings from a recent study based on manual measurements,28 which showed a significant and large condylar difference in anterior circle (extension facet) radius and a small yet significant difference in posterior circle (flexion facet) radius for males, but no difference in females. Our study did confirm the existence of gender difference in distal femur size.28–30 We also showed that the gender difference could not be explained by stature differences between genders, as suggested by Malek et al.29 and Dargel et al.30. In addition, we identified an interaction effect between gender and condyle factors, and a gender difference in the distributions of select morphometric measures, both of which were novel findings. Collectively, our findings with regard to gender may shed new light on gender-specific knee implant design, which remains the subject of debate.9,14,15,30 Some studies suggested female-specific knee implants may improve TKA for females as clinical outcomes were reportedly worse in females.31,32 Others contested the notion of female-specific designs,9 pointing out the ‘‘flaws’’ in evidence or arguments supporting the notion.14,33 Our findings support gender-specific femur design from a new perspective. Since the aspect ratio (a/b) as a sagittal plane shape surrogate measure was consistent across individuals of varied heights and between genders, there appears to be no compelling need to differentiate male and female implants in terms of shape and size. However, the bimodal distribution of the medial-lateral condyle differences for males, in contrast to the unimodal distribution for females, seems to justify two implant designs for males. We theorize that the gender-neutral knee implant might contribute to poorer clinical outcomes in males. JOURNAL OF ORTHOPAEDIC RESEARCH MAY 2012
692
LI ET AL.
Merchant et al.14 indeed found that females had equal or better clinical outcomes than males after traditional TKA with gender-neutral implants.15 The success of our computational framework in fully automated CT-based DFM analyses marks an important stride forward in advancing computer-aided orthopedic surgical innovation. Real-time, accurate, and consistent characterization of DFM is a key to implementing computer-aided individually optimized surgical procedures including TKA and ligament reconstruction. Such characterization has been a formidable challenge with manual methods. Applications of the framework and ‘‘intelligent’’ algorithms have been limited to sagittal plane measures and bone models of morphologically normal knees acquired with uniform imaging quality by a clinical CT. Further efforts are warranted to extend the methodology to 3D space and to models of varied imaging quality or from a differed modality (e.g., MRI and surface digitization).
ACKNOWLEDGMENTS This work was supported in part by a grant from NIH/ NIAMS (3R01AR046387-10S1) under the American Recovery and Reinvestment Act (ARRA) of 2009.
REFERENCES 1. Yasuda K, van Eck CF, Hoshino Y, et al. 2011. Anatomic single- and double-bundle anterior cruciate ligament reconstruction, Part 1: basic science. Am J Sports Med 39:1789– 1799. 2. Sadoghi P, Kropfl A, Jansson V, et al. 2011. Impact of tibial and femoral tunnel position on clinical results after anterior cruciate ligament reconstruction. Arthroscopy 27:355–364. 3. van Eck CF, Schreiber VM, Mejia HA, et al. 2010. ‘‘Anatomic’’ anterior cruciate ligament reconstruction: a systematic review of surgical techniques and reporting of surgical data. Arthroscopy 26:S2–S12. 4. Forsythe B, Kopf S, Wong AK, et al. 2010. The location of femoral and tibial tunnels in anatomic double-bundle anterior cruciate ligament reconstruction analyzed by threedimensional computed tomography models. J Bone Joint Surg Am 92:1418–1426. 5. Yamamoto Y, Hsu WH, Woo SL, et al. 2004. Knee stability and graft function after anterior cruciate ligament reconstruction: a comparison of a lateral and an anatomical femoral tunnel placement. Am J Sports Med 32:1825–1832. 6. Barrett WP. 2006. The need for gender-specific prostheses in TKA: does size make a difference? Orthopedics 29:S53–S55. 7. Blaha JD, Mancinelli CA, Overgaard KA. 2009. Failure of sex to predict the size and shape of the knee. J Bone Joint Surg Am 91 (Suppl 6): 19–22. 8. Lonner JH, Jasko JG, Thomas BS. 2008. Anthropomorphic differences between the distal femora of men and women. Clin Orthop Relat Res 466:2724–2729. 9. MacDonald SJ, Charron KD, Bourne RB, et al. 2008. The John Insall Award: gender-specific total knee replacement: prospectively collected clinical outcomes. Clin Orthop Relat Res 466:2612–2616. 10. Nuno N, Ahmed AM. 2001. Sagittal profile of the femoral condyles and its application to femorotibial contact analysis. J Biomech Eng 123:18–26.
JOURNAL OF ORTHOPAEDIC RESEARCH MAY 2012
11. Nuno N, Ahmed AM. 2003. Three-dimensional morphometry of the femoral condyles. Clin Biomech 18:924–932. 12. Iwaki H, Pinskerova V, Freeman MA. 2000. Tibiofemoral movement 1: the shapes and relative movements of the femur and tibia in the unloaded cadaver knee. J Bone Joint Surg 82B:1189–1195. 13. Zoghi M, Hefzy MS, Fu KC, et al. 1992. A three-dimensional morphometrical study of the distal human femur. Proc Inst Mech Eng H 206:147–157. 14. Merchant AC, Arendt EA, Dye SF, et al. 2008. The female knee: anatomic variations and the female-specific total knee design. Clin Orthop Relat Res 466:3059–3065. 15. Bellemans J, Carpentier K, Vandenneucker H, et al. 2010. The John Insall Award: both morphotype and gender influence the shape of the knee in patients undergoing TKA. Clin Orthop Relat Res 468:29–36. 16. Mahfouz MR, Merkl BC, Fatah EE, et al. 2007. Automatic methods for characterization of sexual dimorphism of adult femora: distal femur. Comput Methods Biomech Biomed Eng 10:447–456. 17. Mahfouz MR, Abdel Fatah EE, Merkl BC, et al. 2009. Automatic and manual methodology for three-dimensional measurements of distal femoral gender differences and femoral component placement. J Knee Surg 22:294–304. 18. Leszko F, Hovinga KR, Lerner AL, et al. 2011. In vivo normal knee kinematics: is ethnicity or gender an influencing factor? Clin Orthop Relat Res 469:95–106. 19. Eckhoff DG, Bach JM, Spitzer VM, et al. 2005. Three-dimensional mechanics, kinematics, and morphology of the knee viewed in virtual reality. J Bone Joint Surg 87A:71–80. 20. Li K, Tashman S, Fu F, et al. 2010. Automating analyses of the distal femur articular geometry based on three-dimensional surface data. Ann Biomed Eng 38:2928–2936. 21. Most E, Axe J, Rubash H, et al. 2004. Sensitivity of the knee joint kinematics calculation to selection of flexion axes. J Biomech 37:1743–1748. 22. Treece GM, Prager RW, Gee AH. 1999. Regularised marching tetrahedra: improved iso-surface extraction. Comput Graph 23:583–598. 23. Desbrun M, Meyer M, Meyer M, et al. 1999. Implicit fairing of irregular meshes using diffusion and curvature flow. In, Proc. ACM. SIGGRAPH. Los Angeles, USA, pp. 317–324. 24. Hartigan JA, Hartigan PM. 1985. The dip test of unimodality. Ann Stat 13:70–84. 25. Brunner E, Domhof S, Langer F. 2002. Nonparametric analysis of longitudinal data in factorial experiments. New York: John Wiley & Sons. 26. Biewener AA. 2005. Biomechanical consequences of scaling. J Exp Biol 208:1665–1676. 27. Song JW, Haas A, Chung KC. 2009. Applications of statistical tests in hand surgery. J Hand Surg Am 34:1872–1881. 28. Yue B, Varadarajan KM, Ai S, et al. 2011. Gender differences in the knees of Chinese population. Knee Surg Sports Traumatol Arthrosc 19:80–88. 29. Malek IA, Moorehead JD, Abiddin Z, et al. 2009. The correlation between femoral condyle radii and subject height. Clin Anat 22:517–522. 30. Dargel J, Michael JW, Feiser J, et al. 2010. Human knee joint anatomy revisited: morphometry in the light of sexspecific total knee arthroplasty. J Arthroplasty 26:346–353. 31. Greene KA. 2007. Gender-specific design in total knee arthroplasty. J Arthroplasty 22:27–31. 32. Booth RE Jr. 2006. Sex and the total knee: gender-sensitive designs. Orthopedics 29:836–838. 33. Parsley BS, Bertolusso R, Harrington M, et al. 2010. Influence of gender on age of treatment with TKA and functional outcome. Clin Orthop Relat Res 468:1759–1764.