ORIGINAL RESEARCH published: 04 June 2018 doi: 10.3389/fnagi.2018.00166
Gender Differences in Elderly With Subjective Cognitive Decline Lijun Wang 1,2,3 * and Ting Tian 4 for the Alzheimer’s Disease Neuroimaging Initiative† 1
Institutes of Brain Science, Fudan University, Shanghai, China, 2 Department of Neurology, Zhongshan Hospital, Fudan University, Shanghai, China, 3 State Key Laboratory of Medical Neurobiology, Fudan University, Shanghai, China, 4 Department of Neurology, The Second Hospital, Lanzhou University, Lanzhou, China
Objective: Subjective cognitive decline (SCD), also known as significant memory
Edited by: Robert Perneczky, Ludwig-Maximilians-Universität München, Germany Reviewed by: Baiying Lei, Shenzhen University, China Deep R. Sharma, SUNY Downstate Medical Center, United States *Correspondence: Lijun Wang
[email protected] †
Data used in preparation of this article were obtained from the Alzheimer’s Disease Neuroimaging Initiative (ADNI) database (adni.loni.usc.edu). As such, the investigators within the ADNI contributed to the design and implementation of ADNI and/or provided data but did not participate in analysis or writing of this report. A complete listing of ADNI investigators can be found at: http://adni.loni.usc. edu/wp-content/uploads/ how_to_apply/ADNI _Acknowledgement_List.pdf Received: 31 January 2018 Accepted: 16 May 2018 Published: 04 June 2018 Citation: Wang L and Tian T for the Alzheimer’s Disease Neuroimaging Initiative (2018) Gender Differences in Elderly With Subjective Cognitive Decline. Front. Aging Neurosci. 10:166. doi: 10.3389/fnagi.2018.00166
concern (SMC), has been suggested as a manifestation of Alzheimer’s Disease (AD) preceding mild cognitive impairment (MCI). This study assessed the impact of gender on cognition, amyloid accumulation, the volumes of hippocampus, entorhinal cortex (EC), fusiform and medial temporal lobe (MTA) and cerebrospinal fluid (CSF) pathology biomarkers in patients reporting SMC. Methods: Twenty-nine males (mean age ± SD: 72.3 ± 5.7 years) and 40 females
(mean age ± SD: 71.0 ± 5.1 years) with SMC from the AD Neuroimaging Initiative (ADNI) were included in the study. We explored the gender discrepancies in cognition, [18 F] AV45 amyloid positivity, volumes of hippocampus, EC, fusiform and MTA and CSF biomarkers. Results: Compared with females, males showed significantly worse performance
in Assessment Scale-cognitive subscale 13 (ADAS-13; P = 0.004) and lower amyloid deposition (P < 0.001). However, females showed greater advantage on the task of Rey Auditory Verbal Learning Test-5 (RAVLT-5) sum (P = 0.021), RAVLT-immediate recall (P = 0.010) and reduced volumes of the hippocampus, EC, fusiform and MTA (P = 0.001, P < 0.001, P < 0.001, P = 0.007) than males. No gender differences were found in CSF Aβ42, CSF Tau and CSF P-tau (P = 0.264, P = 0.454, P = 0.353). Conclusions: These findings highlight that gender discrepancies should be considered
in the interpretation of cognitive measures when evaluating SMC. Keywords: gender, significant memory concern, cognitive function, hippocampus, entorhinal cortex, medial temporal lobe
INTRODUCTION Significant memory concern (SMC; also known as subjective cognitive decline (SCD) or subjective memory impairment), is defined as a self-reported cognitive complaints in the absence of objective cognitive deficits, which is common in older adults (Jessen et al., 2014; Jenkins et al., 2015). Recent mounting evidences indicated that SMC is a risk factor for future accelerated cognitive decline and progression to preclinical or clinical state of Alzheimer’s disease (AD), with AD-type changes in amyloid deposition, neuroimaging and cerebrospinal fluid (CSF) biomarkers (Petersen, 2000; Visser et al., 2009; Reisberg et al., 2010; Perrotin et al., 2012; Scheef et al., 2012; Wang et al., 2012; Mitchell et al., 2014). Taken together, these results suggested that SMC might be an initial symptomatic indicator of preclinical AD (Jessen et al., 2014).
Frontiers in Aging Neuroscience | www.frontiersin.org
1
June 2018 | Volume 10 | Article 166
Wang and Tian
Gender Differences in Subjective Cognitive Decline
Gender-specific discrepancies in mild cognitive impairment (MCI) and AD have been observed (Roberts et al., 2012; Lin et al., 2015). Thus, sex-specific research in SMC is crucial to ensure early correct detection and pre-clinical intervention. However, to date, few studies have focused on the role of gender in SMC across a comprehensive profile of the cognitive assessment, neuroimaging and CSF AD biomarkers. Therefore, the purpose of the current study was to go further to analyze whether the gender discrepancies are related to neuropsychological performance, CSF and positron emission tomography (PET) and magnetic resonance imaging (MRI) biomarkers of AD pathology in older adults reporting SMC.
Neuropsychological Assessment All participants underwent a standardized cognitive evaluation including the following items: (1) Global cognitive function: MMSE (Folstein et al., 1975), Montreal Cognitive Assessment (MoCA; Nasreddine et al., 2005), AD Assessment Scale-cognitive subscale 13 (ADAS-13; Mohs et al., 1997), Global Clinical Dementia Rating Scale (CDR-SB; Morris, 1993); (2) Memory: the Rey Auditory Verbal Learning Test (RAVLT), including trials 1–5 total recall (RAVLT-5 sum), 5-min delayed recall (RAVLTimmediate recall), 30-min delayed recall (RAVLT-delayed recall), yes-no recognition (RAVLT-recognition; Schmidt, 1996); (3) Attention/executive function: the Trail Making Test-A and B (TMT-A/B; Reitan, 1955); (4) Language: animal fluency, 30-item Boston Naming Task (BNT-30; Domoto-Reilly et al., 2012); (5) Visuospatial: clock Drawing Test (CDT; Brodaty and Moore, 1997); (6) 15-item Geriatric Depression Scale (GDS-15; Yesavage et al., 1982), Functional Assessment Questionnaire (FAQ; Pfeffer et al., 1982), Neuropsychiatric Inventory (NPI; Cummings et al., 1994).
MATERIALS AND METHODS ADNI Study Design Data used in the preparation of this article were obtained from the AD Neuroimaging Initiative (ADNI) database1 during January 2018. The data collectors were blind to participant information during the experiments. The ADNI was launched in 2003 as a public-private partnership, led by Principal Investigator Michael W. Weiner, MD. The primary goal of ADNI has been to test whether serial MRI, PET, other biological markers and clinical and neuropsychological assessment can be combined to measure the progression of MCI and early AD. The Principal Investigator of this initiative is Michael W. Weiner, MD, VA Medical Center and University of California-San Francisco. ADNI is a global research effort that actively supports the investigation and development of treatments that slow or stop the progression of AD and subjects have been recruited from over 50 sites across the US and Canada. The overall goal of ADNI is to determine biomarkers for use in AD clinical treatment trials. To date, it has three phases: ADNI1, ADNI GO and ADNI2, consisting of cognitively normal (CN) individuals, early MCI (EMCI), to late MCI (LMCI), and dementia or AD. For more information, see www.adni-info.org. This study was carried out in accordance with the recommendations of each ADNI site. The protocol was approved by the ADNI. All subjects gave written informed consent in accordance with the Declaration of Helsinki.
Apolipoprotein E Genotyping Apolipoprotein E (APOE; gene map locus 19q13.2) genotypes of the study subjects were obtained from the ADNI database1 . All subjects were classified as APOE ε4 carriers with phenotypes ε2/ε4, ε3/ε4, and ε4/ε4, APOE ε4 non-carriers group with ε2/ε2, ε2/ε3 and ε3/ε3 genotypes.
Detection of CSF Aβ42, Tau and P-tau The CSF Aβ42, Tau and P-tau immunoassays were used following a Roche Study Protocol at the University of Pennsylvania/ADNI Biomarker Laboratory, according to the preliminary kit manufacturer’s instructions, as described in previous studies (Bittner et al., 2016). Values are given in pg/mL for both tau and Aβ42.
[18 F] AV 45 (Florbetapir) PET Scans [18 F] AV 45 (Florbetapir) PET data were processed and acquired as described previously (Landau et al., 2012, 2013b). Mean florbetapir standard uptake value ratios (SUVRs) were measured within four regions (frontal, anterior cingulate, precuneus, and parietal cortex) and normalized to the whole cerebellum reference region. Participants were classified as amyloid positivity when the SUVRs were >1.11, and amyloid negativity when the SUVRs were ≤1.11 based on a previously established threshold (Landau et al., 2013a). For more detailed information about PET protocols and data, see the ADNI website3 .
Subjects The current study sample consisted of 69 ADNI-2 participants, including 29 males and 40 females. Participants were selected if they were diagnosed as having SMC. Diagnosis was made using the standard criteria described in the ADNI-2 procedures manual2 . Briefly, SMC participants had subjective memory concerns as evaluated using the Cognitive Change Index (CCI; total score from first 12 items >16), which was based on selected items from a larger compilation of measures analyzed in an independent sample (Saykin et al., 2006), but no informantreported memory complaints, and normal cognitive performance on the Wechsler Logical Memory Delayed Recall (LM-Delayed) and the Mini-Mental State Exam (MMSE).
Quantification of Volumes of Hippocampus, Entorhinal Cortex, Fusiform and Medial Temporal Lobe The ADNI neuroimaging standardized procedure has been described in great detail elsewhere (Jack et al., 2008). ADNI-2 MRI data were acquired on a 3 Tesla MRI scanners using T1-weighted sagittal 3D magnetization-prepared rapid
1 adni.loni.usc.edu 2 http://www.adni-info.org
Frontiers in Aging Neuroscience | www.frontiersin.org
3 http://adni.loni.usc.edu/methods/
2
June 2018 | Volume 10 | Article 166
Wang and Tian
Gender Differences in Subjective Cognitive Decline
statistical significance was set at P < 0.05. Figures were produced using GraphPad Prism 6.
gradient-echo (MPRAGE) sequences. Cortical reconstruction and volumetric segmentation were obtained using FreeSurfer version 5.1 image analysis suite in ADNI 24 (McDonald et al., 2009), as described in previous reports (Fischl et al., 2001, 2002; Fleisher et al., 2005; Han et al., 2006). In this study, hippocampus, EC, fusiform and medial temporal lobe (MTA) volumes were evaluated. Further details on ADNI imaging protocols can be found at http://adni.loni.usc.edu/methods/documents/mriprotocols/.
RESULTS Demographic Characteristics by Gender The overall sample was comprised of 69 participants including 29 males and 40 females were downloaded from the ADNI website. Socio-demographics and clinical characteristics of the study sample are presented in Table 1. In brief, females were less educated compared to males (P = 0.036) and males were reported with more alcohol drinking (P = 0.038). No gender differences were found in other variables (all P > 0.05).
Statistical Analysis Demographic and clinical variables were compared between genders in the overall sample using Student’s t-test by mean ± standard deviation (SD) according to the distribution, Mann–Whitney test for skewed distribution variables by median (M) and interquartile range (IQR), Chi-square test for categorical variables. All statistics were performed using SPSS software (version 23.0; IBM SPSS). All calculated tests were two-sided and
Cognitive Profiles by Gender Gender differences in neuropsychological performances in the study sample are demonstrated in Table 2 and Figure 1. Men performed worse on ADAS-13 (P = 0.004), while women had statistically significant better cognitive function on RAVLT-5 sum (P = 0.021) and RAVLT-immediate recall (P = 0.010).
4 http://surfer.nmr.mgh.harvard.edu/
TABLE 1 | Demographic characteristics of subjects included in the study. Characteristics Age, years Education, years Race, n (% White) Ethnicity, n (% Not Hisp/Latino) Marital status, n (% Married) Right handedness, n (%) APOE ε4 carriers, n (%) Smoking, n (%) Alcohol abuse, n (%) Hypertension, n (%) SBP (mmHg) DBP (mmHg)
Total
Males (n = 29)
Females (n = 40)
P value
71.6 ± 5.3 16 (16–18) 64 (92.8) 66 (95.7) 50 (72.5) 58 (84.1) 25 (36.2) 30 (43.5) 3 (4.3) 35 (50.7) 135.4 ± 17.5 73.3 ± 8.7
72.3 ± 5.7 18 (16–20) 26 (40.6) 29 (43.9) 23 (46) 26 (44.8) 8 (32) 15 (50) 3 (100) 15 (42.9) 132.1 ± 17.6 72.9 ± 9.4
71.0 ± 5.1 16 (15–18) 38 (59.4) 37 (56.1) 27 (54) 32 (55.2) 17 (68) 15 (50) 0 (0) 20 (57.1) 137.7 ± 17.2 73.5 ± 8.3
0.318 0.036 0.708 0.363 0.278 0.280 0.203 0.239 0.038 0.888 0.191 0.792
Abbreviations: APOE, apolipoprotein E; DBP, diastolic blood pressure; SBP, systolic blood pressure. Data are described as mean ± SD, median (M) and the interquartile range (IQR) unless otherwise specified. P values tested by Student’s t-test, Mann-Whitney test and Chi-square test. TABLE 2 | Clinical assessments by gender. Variables MMSE MoCA ADAS-13 CDR-SB RAVLT-5 sum RAVLT-immediate recall RAVLT-delayed recall RAVLT-recognition TMT-A TMT-B Animals fluency BNT-30 CDT GDS-15 FAQ NPI
Total
Males (n = 29)
Females (n = 40)
P value
29 (29–30) 25.9 ± 2.4 8.3 ± 3.7 0 (0–0) 46.6 ± 9.8 9.3 ± 3.3 7.4 ± 4.0 14 (12–14.5) 32.3 ± 10.6 82.2 ± 39.3 20.9 ± 5.0 29 (28–30) 5 (4–5) 1 (0–2) 0 (0–0) 0 (0–2.5)
29 (28–30) 25.4 ± 2.5 9.8 ± 3.9 0 (0–0) 43.4 ± 10.9 8.1 ± 3.6 6.2 ± 4.4 13 (10.5–14) 34.1 ± 12.6 81.4 ± 32.0 21.2 ± 4.9 29 (28–29.5) 5 (4–5) 1 (0.5–1.5) 0 (0–0.5) 0 (0–3)
29 (29–30) 26.4 ± 2.3 7.3 ± 3.3 0 (0–0) 48.9 ± 8.3 10.2 ± 2.7 8.2 ± 3.4 14 (12.25–15) 31.0 ± 8.9 82.8 ± 44.3 20.7 ± 5.1 29 (28–30) 5 (5–5) 1 (0–2) 0 (0–0) 0 (0–1.75)
0.917 0.098 0.004 0.408 0.021 0.010 0.053 0.064 0.229 0.888 0.685 0.920 0.350 0.554 0.843 0.632
Abbreviations: ADAS-13, Alzheimer’s Disease Assessment Scale-cognitive subscale 13; BNT-30, Boston Naming Task; CDR-SB, Global Clinical Dementia Rating Scale; CDT, Clock Drawing Test; FAQ, Functional Assessment Questionnaire; GDS-15, Geriatric Depression Scale; MMSE, Mini-Mental State Examination; MoCA, Montreal Cognitive Assessment; NPI, Neuropsychiatric Inventory; RAVLT, Rey Auditory Verbal Learning Test; TMT, The Trail Making Test. Data are presented as mean ± SD, median (M) and the interquartile range (IQR). P values tested by Student’s t-test, Mann-Whitney test.
Frontiers in Aging Neuroscience | www.frontiersin.org
3
June 2018 | Volume 10 | Article 166
Wang and Tian
Gender Differences in Subjective Cognitive Decline
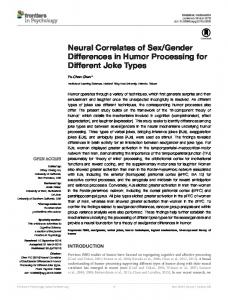
FIGURE 1 | Comparison of neuropsychological measures in men and women with significant memory concern (SMC). Scatter plots displaying cognitive function in males and females. (A) Men had significantly worse cognitive function as measured by ADAS-13 (P = 0.004). (B) Women showed greater advantages on RAVLT-5 sum (P = 0.021). (C) Women excelled at RAVLT-immediate recall (P = 0.010). ADAS-13, Alzheimer’s Disease Assessment Scale-cognitive subscale 13; RAVLT, Rey Auditory Verbal Learning Test. P values tested by Student’s t-test. ∗ P < 0.05, ∗∗ P < 0.01.
DISCUSSION
However, there were no gender differences in performance on MMSE, MoCA, CDR-SB, RAVLT-delayed recall, RAVLTrecognition, TMT-A, TMT-B, Animals fluency, BNT-30, CDT, GDS-15, FAQ, NPI (P = 0.917, P = 0.098, P = 0.408, P = 0.053, P = 0.064, P = 0.229, P = 0.888, P = 0.685, P = 0.920, P = 0.350, P = 0.554, P = 0.843, P = 0.632).
In the present study, we explored a statistically significant gender discrepancy in cognition function, Aβ deposition and brain volume in older adults with SMC. The results confirmed that women with SMC outperformed men with SMC on the tasks of RAVLT-5 sum and RAVLT-immediate recall, while the advantage was eliminated on the task of RAVLT-delayed recall and a floor effect might limit interpretation. However, we found that men with SMC were associated with worse performance on ADAS-13. No significant differences were observed between males and females on other cognitive domains. Our results are in concordance with previous studies showing that the female advantage in verbal memory task was more apparent than men (Herlitz et al., 1997; Sundermann et al., 2016a,b). These observations suggest that gender discrepancies among SMC subjects might be appropriate to a specific cognitive domain. If so, then implementing sex-adjusted norms in clinical memory tests might ameliorate the diagnostic accuracy in women. Females with SMC participants showed increased Aβ deposition relative to males. Elevated risk of AD was in women compared to men, although the underlying mechanism remains elusive as previously reported (Seshadri et al., 2006). However, we did not discover differences in CSF Aβ42, Tau and P-tau between males and females with subjective cognitive impairment. It is noteworthy that we observed significant reduction in volumetric measurements of hippocampus, EC, fusiform gyrus and MTA in females with SMC subjects.
CSF Biomarkers There were no significant differences in CSF Aβ42, Tau and P-tau levels between males and females (P = 0.264, P = 0.454, P = 0.353; see Table 3).
Aβ Deposition in Different Groups Significant decreases in [18 F] AV45 SUVRs were found in males compared with females (P < 0.001). Aβ positivity was detected in 17.4% of males, 82.6% of females respectively. The percentage of Aβ positive subjects was significantly higher in females vs. males (P = 0.003; Table 3).
Volumes of Hippocampus, Entorhinal Cortex, Fusiform and Medial Temporal Lobe by Gender The volumes of hippocampus, EC, fusiform, medial temporal lobe (MTA) are illustrated in Table 3. There were significantly larger volumes of hippocampus, EC, fusiform and MTA in men compared to women (P = 0.001, P < 0.001, P < 0.001, P = 0.007).
TABLE 3 | Measurements of cerebrospinal fluid (CSF) biomarkers, positron emission tomography (PET) and magnetic resonance imaging (MRI) in the subjects. Variables CSF Aβ42 (pg/mL) CSF Tau (pg/mL) CSF P-tau (pg/mL) [18 F] AV45 SUVRs Aβ positivity, n (%) Hippocampus (mm3 ) Entorhinal (mm3 ) Fusiform (mm3 ) MTA (mm3 )
Total 1370.6 ± 614.2 243.3 ± 94.3 22.4 ± 10.1 1.06 (1.01–1.21) 23 (33.3) 7678.7 ± 911.7 3905.1 ± 568.2 18853.0 ± 2209.3 20823.3 ± 2776.2
Males (n = 29) 1468.2 ± 587.2 233.3 ± 90.6 21.0 ± 9.1 1.01 (0.98–1.09) 4 (17.4) 8095.7 ± 950.5 4215.7 ± 532.8 20071.6 ± 2185.2 21863.6 ± 3072.6
Females (n = 40) 1299.9 ± 630.9 250.6 ± 97.4 23.3 ± 10.8 1.11 (1.03–1.36) 19 (82.6) 7376.4 ± 760.1 3679.9 ± 485.1 17969.5 ± 1782.7 20069.1 ± 2296.1
P value 0.264 0.454 0.353