Much of the natural variation for a complex trait can be explained by variation in DNA sequence levels. As part of sequence variation, geneâgene interaction has ...
The Annals of Applied Statistics 2012, Vol. 6, No. 3, 1134–1161 DOI: 10.1214/12-AOAS545 © Institute of Mathematical Statistics, 2012
GENE-CENTRIC GENE–GENE INTERACTION: A MODEL-BASED KERNEL MACHINE METHOD1 B Y S HAOYU L I
AND
Y UEHUA C UI
Michigan State University and St. Jude Children’s Research Hospital Much of the natural variation for a complex trait can be explained by variation in DNA sequence levels. As part of sequence variation, gene–gene interaction has been ubiquitously observed in nature, where its role in shaping the development of an organism has been broadly recognized. The identification of interactions between genetic factors has been progressively pursued via statistical or machine learning approaches. A large body of currently adopted methods, either parametrically or nonparametrically, predominantly focus on pairwise single marker interaction analysis. As genes are the functional units in living organisms, analysis by focusing on a gene as a system could potentially yield more biologically meaningful results. In this work, we conceptually propose a gene-centric framework for genome-wide gene–gene interaction detection. We treat each gene as a testing unit and derive a modelbased kernel machine method for two-dimensional genome-wide scanning of gene–gene interactions. In addition to the biological advantage, our method is statistically appealing because it reduces the number of hypotheses tested in a genome-wide scan. Extensive simulation studies are conducted to evaluate the performance of the method. The utility of the method is further demonstrated with applications to two real data sets. Our method provides a conceptual framework for the identification of gene–gene interactions which could shed novel light on the etiology of complex diseases.
1. Introduction. Accumulative evidence shows that much of the genetic variation for a complex trait can be explained by the joint function of multiple genetic factors as well as environmental contributions. Searching for these contributing genetic factors and further characterizing their effect sizes is one of the primary goals and challenges for modern genetics. The recent breakthroughs in high-throughput genotyping technologies and the completion of the International HapMap project provide unprecedented opportunities to characterize the genetic machinery of living organisms. Genetic association analyses focusing on single nucleotide polymorphisms (SNPs) or haplotypes have led to the identification of many novel genetic determinants of complex disease traits. However, despite enormous success Received October 2011; revised January 2012. 1 Supported in part by NSF Grants DMS-0707031, MCB-1121650 and by the Intramural Research
Program of the Eunice Kennedy Shriver National Institute of Child Health and Human Development, NIH, DHHS. Key words and phrases. Allele matching kernel, association study, gene-clustered SNPs, genomic similarity, reproducing kernel Hilbert space, quantitative traits.
1134
GENE-CENTRIC GENE–GENE INTERACTION
1135
in genome-wide association studies, single SNP or haplotype based studies still suffer from low replication rates because of the infeasibility of dealing with the complex patterns of association, for example, genetic heterogeneity, gene–gene interaction and gene-environment interaction. Many of the genetic components of many diseases remain unaccounted for and only a small proportion of the heritability has been explained. It is commonly recognized that genes do not function alone, rather they interact constantly with each other. Gene–gene interactions have been broadly considered as important contributors to the unexplained heritability of complex traits [Thornton-Wells, Moore and Haines (2004), Maher (2008), Moore and Williams (2009), Eichler et al. (2010)]. Current methods for gene–gene interactions are mostly focused on single locus interactions, using either parametric methods such as the regression-based tests of interaction [Piegorsch, Weinberg and Taylor (1994)] and Bayesian epistasis mapping [Zhang and Liu (2007)], nonparametric methods such as the entropy-based approaches [Kang et al. (2008)], or data mining methods such as the multifactor dimensionality reduction (MDR) [Ritchie et al. (2001)] and random forests [Breiman (2001)]. Methods based on interaction of haplotypes have also been developed [e.g., Li et al. (2010), Li, Zhang and Yi (2011)]. Due to the issue of haplotype phase-ambiguity, however, haplotype-based interaction analysis is limited to small sized haplotypes. Extension to large sized haplotype interaction is computationally challenging. For a comprehensive review of statistical methods developed for detecting gene–gene interactions, readers are referred to Cordell (2009). A number of research reports have argued the relative merit of gene-based association analysis [e.g., Neale and Sham (2004), Jorgenson and Witte (2006), Cui et al. (2008), Ma et al. (2010)]. Neale and Sham (2004) argued that a gene-based approach, in which all variants within a putative gene are considered jointly, have relative advantages over single SNP or haplotype analysis. As genes are the functional units in a human genome, variants in genes should have high probability of being functionally more important than those that occur outside of a gene [Jorgenson and Witte (2006)]. Because of this characteristic, gene-based association analysis would provide more biologically interpretable results than the singleSNP or haplotype based analysis. Moreover, when multiple variants within a gene function in a complicated manner, the gene-based association test can gain additional power by capturing the joint function of multiple variants simultaneously compared to a single SNP analysis [Cui et al. (2008), Buil et al. (2009)]. In addition, a gene-based analysis is statistically appealing. By considering multiple SNP markers within a gene as testing units, one can reduce the number of tests, hence releasing the multiple testing burden and improving association test power. The relative advantage of gene-centric analysis motivates us to consider genes as modeling units to identify interactions in a gene level. It is our expectation that the identification of genetic interactions in a gene level should carry the same benefits and gains as it does with gene-based association analysis. We therefore
1136
S. LI AND Y. CUI
propose to jointly model the genetic variation of SNPs within a gene, then further test the interaction in a gene level rather than in a single SNP level. This conceptual definition and modeling of gene-centric gene–gene (denoted as 3G) interaction would change the traditional paradigm of gene–gene interaction analysis and help us gain novel insight into the genetic etiology of complex diseases. In addition to its biological merits, by focusing on genes as testing units, the number of pairwise interaction tests can be dramatically reduced compared to a single SNP-based pairwise interaction analysis. Thus, the 3G interaction analysis is also statistically appealing. Following the definition of the gene-centric interaction, we propose a modelbased kernel machine method to identify significant gene–gene interactions under the proposed 3G analysis framework. Kernel-based methods have been proposed to evaluate association of genetic variants with complex traits in the past decades [e.g., Tzeng et al. (2003), Schaid et al. (2005), Wessel and Schork (2006), Schaid (2010a, 2010b)]. A general kernel machine method can account for complex nonlinear SNP effects within a genetic feature (e.g., a gene or a pathway) by using an appropriately selected kernel function. Generally speaking, a kernel function captures the pairwise genomic similarity between individuals for variants within an appropriately defined feature [Schaid (2010a)]. The application of kernel-based methods in genetic association analysis has been reported in the literature [e.g., Schaid et al. (2005), Kwee et al. (2008), Wu et al. (2010)], but none of them considers gene–gene interactions. In this work, we propose a general 3G interaction framework by applying the smoothing-spline ANOVA model [Wahba (1990)] to model gene–gene interactions. The proposed method, termed Genecentric Gene–Gene interaction with Smoothing-sPline ANOVA Model (3G-SPA), is implemented through a two-step procedure: (1) an exhaustive two-dimensional genome-wide search for any genetic effects; and (2) assessment of significance of interactions for the identified gene pairs. The rest of the paper is organized as follows. In Section 2 we describe the detailed model derivation of our method. We propose two score statistics for testing the overall genetic effect and the interaction effect. To evaluate the performance of the proposed method, Monte Carlo simulations are performed in Section 3. The utility of the method is demonstrated by two real data analyses in Section 4, followed by discussion in Section 5. 2. Statistical methods. 2.1. Smoothing spline-ANOVA model. We assume n unrelated individuals sampled from a population, each of which possesses a measurement for a quantitative disease trait of interest. The quantitative measurements of n individuals are denoted as y = (y1 , y2 , . . . , yn )T . Traditional approaches for detecting gene–gene interactions, such as MDR or regression type analysis, identify SNP-SNP interactions. In this work, we focus our attention to pairwise gene–gene interactions by
1137
GENE-CENTRIC GENE–GENE INTERACTION
considering each gene as a unit. Consider two genes, denoted as G1 and G2 , with L1 and L2 SNP markers, respectively. Let xi = (xi,1 , . . . , xi,L ) be an 1 × L genotype vector of the gene pair for subject i, where L = L1 + L2 is the total number of SNP markers in the two genes. We model the relationship between the genotypes of the gene pair (xi ) and the phenotype yi by the following model: yi = m(xi ) + εi ,
(2.1)
i = 1, 2, . . . , n,
where m is an unknown function and εi ∼ N (0, σi2 ) is a random subject-specific error term and independent of xi . Here σi2 (=σ 2 ) is generally assumed to be homogeneous. Gu (2002) has discussed the ANOVA decomposition of multivariate functions on generic domains of each single coordinate. Actually, the decomposition can also be defined on nested domains (see Appendix A). Following a similar idea, the (j ) (2) genotype vector xi is partitioned as xi = [x(1) i , xi ], where xi represents the Lj SNP predictors for gene j (j = 1, 2). Let a product domain be X = X (1) ⊗ X (2) (j ) with x(j ) ∈ X (j ) and Aj be an averaging operator on X (j ) , that averages out xi , j = 1, 2. Then a function m(·) defined on the product domain has a functional ANOVA decomposition as in the following: m=
2 �
(I − Aj + Aj )m
j =1
(2.2)
= {A1 A2 + (I − A1 )A2 + A1 (I − A2 ) + (I − A1 )(I − A2 )}m = μ + m1 + m2 + m12 ,
where μ is the overall mean, m1 , m2 are the main effects of the two genes and m12 describes the interaction effect between them (see Appendix A for more details). 2.2. Reproducing kernel Hilbert space and the dual representation. Based on the ANOVA decomposition, a reproducing kernel Hilbert space (RKHS) H of functions on X can be constructed [Gu and Wahba (1993) and Wahba et al. (1995)]. Let H(j ) be an RKHS of functions on X (j ) , j = 1, 2, and 1(j ) be a space of constant functions on X (j ) , then H=
2 � � j =1
(2.3)
1(j ) ⊕ H(j ) �
� �
�
�
�
= [1] ⊕ H(1) ⊗ 1(2) ⊕ 1(1) ⊗ H(2) ⊕ H(1) ⊗ H(2)
�
= [1] ⊕ H1 ⊕ H2 ⊕ H3 , where ⊕ refers to direct sum and ⊗ refers to tensor product. Equation (2.3) provides an orthogonal decomposition of the entire functional space H. So H is a
1138
S. LI AND Y. CUI
RKHS with the associated reproducing kernel as the sum of the reproducing kernels of these component subspaces. Each functional component in (2.2) lies in a subspace in (2.3), and is estimated in the corresponding RKHS. The identifiability � of the components is assured by side conditions: X (j ) mj (x(j ) ) dμj = 0, j = 1, 2. We assume that function m is a member of the RKHS H and can be estimated as the minimizer of the following penalized sum of squares: L(y, m) =
(2.4)
n � �
�2
yi − m(xi ) + λJ (m),
i=1
where J (·) is a roughness penalty. With the orthogonal decomposition of space H, the penalty function J (·) can be decomposed such that equation (2.4) becomes L(y, m) =
(2.5)
n � �
3 �
�2
yi − m(xi ) +
i=1
λl �P l m(·)�2H ,
l=1
where P l is the orthogonal projector in H onto Hl , and the λl ’s are the tuning parameters which balance the goodness of fit and complexity of the model. The minimizer of the objective function (2.5) is known to have a representation [Wahba (1990), Chapter 10] in terms of a constant and the associated reproducing kernels {kl (s, t)} of the Hl , l = 1, 2, 3, that is, m(x) = μ +
n �
ci
i=1
(2.6) =μ+
3 �
θl kl (xi , x)
l=1
3 �
KlT (x)Cl ,
l=1
where KlT (x) = (kl (x1 , x), . . . , kl (xn , x)), Cl = (c1 , . . . , cn )T θl . Details on the choice of the reproducing kernel functions corresponding to the three subspaces will be discussed in a later section. Substituting the representation of m(·) into (2.5), we get L(y, m) =
n � �
�2
yi − m(xi ) +
i=1
(2.7)
�
3 �
λl �P l m(·)�2H
l=1
�T �
= y − m(X)
�
y − m(X) +
3 �
λl ClT Kl Cl
l=1
= y − μ1 −
3 � l=1
T
Kl Cl
y − μ1 −
3 � l=1
Kl Cl +
3 � l=1
λl ClT Kl Cl ,
1139
GENE-CENTRIC GENE–GENE INTERACTION
where X = (xT1 , . . . , xTn )T and
⎡ K T (x ) ⎤ 1 l ⎢ K T (x2 ) ⎥ ⎢ l ⎥ Kl = ⎢ ⎥. .. ⎣ ⎦ .
KlT (xn ) The gradients of L with respect to the coefficients (μ, Cl : l = 1, 2, 3) are
3 � ∂L = 21T y − μ1 − Kl Cl ∂μ l=1
and
�
�
3 � ∂L = 2 KTl y − μ1 − Kl Cl + λl Kl Cl . ∂Cl l=1
Therefore, the first order condition is satisfied by the system ⎡
(2.8)
n 1T K1 ⎢ KT 1 KT K1 + λ1 K1 ⎢ 1 1 ⎢ T ⎣ K2 1 KT2 K1 KT3 1 KT3 K1 ⎡ T 1 ⎢ KT ⎢ = ⎢ 1T ⎣ K2
⎤
1T K2 KT1 K2 KT2 K2 + λ2 K2 KT3 K2
⎤
⎡ ⎤ 1T K3 μ T ⎥ K1 K3 C1 ⎥ ⎥⎢ ⎥ ⎥⎢ T ⎣ ⎦ C2 ⎦ K2 K3 C3 KT3 K3 + λ3 K3
⎥ ⎥ ⎥ y. ⎦
KT3
The connection between smoothing splines and the linear mixed effects model has been previously established [Wahba (1990), Speed (1991)]. For the two-way ANOVA decomposition model considered in this paper, we show that the first order system above is equivalent to Henderson’s normal equation of the following linear mixed effects model (see Appendix B for details): (2.9)
y = μ1 + m1 + m2 + m12 + ε,
where m1 , m2 , m12 are independent n × 1 vector of random effects; m1 ∼ N(0, τ12 K1 ), m2 ∼ N(0, τ22 K2 ), m12 ∼ N(0, τ32 K3 ), and ε ∼ N(0, σ 2 I ) is independent of m1 , m2 and m12 . This connection indicates that the estimators of functions m1 , m2 , m12 are just the BLUPs of the linear mixed effects model [see also Liu, Lin and Ghosh (2007)]. Tuning parameters λl , l = 1, 2, 3, are functions of the variance components, which can be estimated either by the maximum likelihood method or by the restricted maximum likelihood (REML) method. Since the REML method produces unbiased estimators for the variance components, we adopt REML estimation in this work. The dual representation of the linear mixed
1140
S. LI AND Y. CUI
effects model obtained for the SS-ANOVA model makes it feasible to do inferences about the main and interaction components under the mixed effects model framework. 2.3. Choice of kernel function for genotype similarity. The choice of a reproducing kernel is not arbitrary in the sense that the kernel function must be nonnegative definite. By Theorem 2.3 [Gu (2002)], given a nonnegative definite function k on X , we can construct a unique RKHS of real-valued functions on X with k as its reproducing kernel. In genetic association studies, a kernel function captures the pairwise genomic similarities across multiple SNPs in a gene. It projects the genotype data from the original space, which can be high dimensional and nonlinear, to a one-dimensional linear space. The allele matching (AM) kernel is one of the most popularly used kernels for measuring genomic similarity. This type of kernel measure has been used in linkage analyses [Weeks and Lange (1988)] and in association studies [Tzeng et al. (2003), Schaid et al. (2005), Wessel and Schork (2006), Kwee et al. (2008), Mukhopadhyay et al. (2010) and Wu et al. (2010)]. For a review of genomic similarity and kernel methods, readers are referred to Schaid (2010a, 2010b). With the notable strength that it does not require knowledge of the risk allele for each SNP, the AM kernel is chosen as the kernel function in this study. This similarity kernel counts the number of matches among the four comparisons between two genotypes gi,s (with two alleles A and B) and gj,s (with two alleles C and D) of two individuals i and j at locus s, and can be expressed as AM(gi,s = A/B, gj,s = C/D) = I (A ≡ C)+I (A ≡ D)+I (B ≡ C)+I (B ≡ D), where I is the indicator function and “≡” means the two alleles are identical-bystate (IBS). The kernel function based on this AM similarity measure then takes the following form: (2.10)
f (gi , gj ) =
�S
s=1 AM(gi,s , gj,s )
, 4S where S is the number of SNPs considered for each kernel function. To incorporate valuable SNP-specific information into analyses in order to potentially improve performance, a weighted-AM kernel can be applied which has the following form: (2.11)
f (gi , gj ) =
�S
s=1 ws
4
AM(gi,s , gj,s )
�S
s=1 ws
,
where ws is the weighting function which can be adopted to incorporate prior knowledge in order to gain extra power. For example, when a study is trying to identify the effect of rare variants, the weight function can be taken as the inverse of the minor allele frequency to boost the signal for rare variants [Schaid (2010b)]. An example illustrating the calculation of the kernel matrix is given in Appendix C.
GENE-CENTRIC GENE–GENE INTERACTION
1141
We use the AM kernel as the reproducing kernel for the two subspaces H1 and corresponding to the main effects. Utilizing the fact that the reproducing kernel of a tensor product of two reproducing kernel Hilbert spaces is the product of the two reproducing kernels [Aronszajn (1950)], the associated reproducing kernel for H3 can be taken as the product of the reproducing kernels of the two subspaces: H1 and H2 . H2
2.4. Hypothesis testing. 2.4.1. Testing overall genetic effect. In a gene-based genetic association study, one is interested in whether a gene as a system is associated with a disease trait. In the proposed 3G interaction study, we are interested in the association of each gene with a quantitative trait as well as the interaction between genes, if any. The analysis starts with a two-dimensional pairwise search for gene pairs with overall contribution to the phenotypic variation and then tests those contributing gene pairs for interaction effect. Under the SS-ANOVA framework, testing the overall genetic effect of a gene pair is equivalent to testing H0 : m1 = m2 = m12 = 0. Similarly, testing for interaction effect can be formulated as H0 : m12 = 0. With the linear mixed effects model representation, the aforementioned two tests are equivalent to H01 : τ12 = τ22 = τ32 = 0 and H02 : τ32 = 0, respectively. Here, τ12 , τ22 , τ32 are the variance components in model (2.9). A well-known issue in variance component analysis is that the parameters under the null hypotheses are on the boundary of the parameter space. Moreover, the kernel matrices K� ’s are not block-diagonal. Thus, the asymptotic distribution of a likelihood ratio test (LRT) statistic does not follow a central chi-square distribution under the null hypothesis. The mixture chi-square distribution proposed by Self and Liang (1987) under irregular conditions also does not apply in our case. In this paper, we construct score test statistics based on the restricted likelihood. Consider the linear mixed model in (2.9), y ∼ N(μ1, V (β)). The restricted log-likelihood function can be written as �R ∝ − 12 ln(|V (β)|) − 12 ln(|1T V −1 (β)1|) − 12 (y − μ1) ˆ T V (β)−1 (y − μ1), ˆ where β = (σ 2 , τ12 , τ22 , τ32 )T , V (β) = σ 2 I + τ12 K1 + τ22 K2 + τ32 K3 . The first order derivative of the restricted log-likelihood function with respect to each variance component is (2.12)
∂�R 1 1 ˆ T V −1 (β)Vi V −1 (β)(y − μ1), = − tr(RVi ) + (y − μ1) ˆ ∂βi 2 2
where Vi = ∂V∂β(β) , i = 1, . . . , 4, so that V1 = I, V2 = K1 , V3 = K2 , V4 = K3 and i −1 −1 R = V − V 1(1T V −1 1)−1 1T V −1 .
1142
S. LI AND Y. CUI
The restricted score function under the null hypothesis H01 : τ12 = τ22 = τ32 = 0 is given by � ∂�R �� 1 1 = − 2 tr(P0 Vi ) + 4 (y − μ1) ˆ T Vi (y − μ1), ˆ � 2 2 2 ∂βi τ1 =τ2 =τ3 =0 2σ 2σ where P0 = I − 1(1T 1)−1 1T is the projection matrix under the null. Thus, H01 can be tested using the following score statistic: S(σ 2 ) =
3 � 1 T (y − μ ˆ 1) Kl (y − μˆ 0 1), 0 2σ 2 l=1
where μˆ 0 = (I − P0 )y is the MLE of μ under the null. This leads to S(σ 2 ) =
3 1 T � y P Kl P0 y. 0 2σ 2 l=1
Denoting the true value of σ 2 under the null by σ02 , S(σ02 ) is a quadratic form in y. Following Liu, Lin and Ghosh (2007), we use the Satterthwaite method to approximate the distribution of S(σ02 ) by a scaled chi-square distribution, that is, S(σ02 ) ∼ aχg2 , where the scale parameter a and the degrees of freedom g can be estimated by the method of moments (MOM). By equating the mean and variance of the test statistic S(σ02 ) with those of aχg2 , we have ⎧
3 � � ⎪ ⎪ 2 ⎪ δ = E[S(σ )] = tr P K 2 = E[aχg2 ] = ag, ⎪ 0 i 0 ⎪ ⎨ i=1 3
3 ⎪ � � � ⎪ ⎪ 2 ⎪ ⎪ ν = Var[S(σ0 )] = tr (P0 Ki ) (P0 Ki ) 2 = Var[aχg2 ] = 2a 2 g. ⎩ i=1
i=1
Solving for the two equations leads to aˆ = ν/2δ and gˆ = 2δ 2 /ν. In practice, we do not know the true value σ02 and we usually replace it by its MLE under the null model, denoted by σˆ 02 . The asymptotic distribution of S(σˆ 02 ) can √ still be approximated by the scaled chi-square distribution because the MLE is n consistent. To account for this substitution, we estimate a and g by replacing ν by ν˜ based on the efficient information. The elements of the Fisher information matrix of τ = (τ12 , τ22 , τ32 ) are given by ⎡
Iτ τ
tr(P0 K1 P0 K1 ) = 12 ⎣ tr(P0 K2 P0 K1 ) tr(P0 K3 P0 K1 )
Iτ σ 2 = 12 [ tr(P0 K1 )
tr(P0 K1 P0 K2 ) tr(P0 K2 P0 K2 ) tr(P0 K3 P0 K2 )
tr(P0 K2 )
⎤
tr(P0 K1 P0 K3 ) tr(P0 K2 P0 K3 ) ⎦ , tr(P0 K3 P0 K3 )
tr(P0 K3 ) ]T
and Iσ 2 σ 2 = 12 tr(P0 P0 ). Then the efficient information I˜τ τ = Iτ τ − IτTσ 2 Iσ−1 2 σ 2 Iτ σ 2 2 ˜ and ν˜ = Var[S(σˆ )] ≈ SUM[Iτ τ ], where operator “SUM” indicates the sum of every element of the matrix.
1143
GENE-CENTRIC GENE–GENE INTERACTION
2.4.2. Testing for G×G interaction. For testing the interaction effect, that is, testing H02 : τ32 = 0, we also apply a score test. Let = σ 2 I + τ12 K1 + τ22 K2 . The score function (2.12) under this null hypothesis becomes �
1 ∂�R �� ˆ T −1 K3 −1 (y − μ1)] ˆ � 2 = − 2 [tr(P01 K3 ) − (y − μ1) 2 ∂τ3 τ3 =0 =−
� 1� tr(P01 K3 ) − yT P01 K3 P01 y , 2
where P01 = −1 − −1 1(1T −1 1)−1 1T −1 is the projection matrix under the null. Then SI = 12 yT P01 K3 P01 y. Similarly, the Satterthwaite method is used to approximate the distribution of SI by aI χg2I . Parameters aI and gI are estimated by MOM. Specifically, aˆ I = νI /2δI and gˆ I = 2δI2 /νI , where δI = 12 tr(P01 K3 ) and νI = 12 tr(P01 K3 P01 K3 ) − 1 T −1 2 � � �, in which 2K ) � = [ tr(P01 3
and
⎡
2) tr(P01 2K ) � = ⎣ tr(P01 1 2K ) tr(P01 2
tr(P01 K3 P01 K1 ) tr(P01 K3 P01 K2 ) ]T 2K ) tr(P01 1 tr(P01 K1 P01 K1 ) tr(P01 K2 P01 K1 )
⎤
2K ) tr(P01 2 tr(P01 K1 P01 K2 ) ⎦ . tr(P01 K2 P01 K2 )
3. Simulation study. 3.1. Simulation design. Monte Carlo simulations were conducted to evaluate the performance of the proposed method for detecting overall genetic effects as well as interaction between two genes. Genotype data were simulated using the MS program developed by Hudson (2002). The MS program generates haplotype samples by using the standard coalescent approach in which the random genealogy of a sample is first generated and the mutations are randomly placed on the genealogy. We first simulated two independent samples of haplotypes. Parameters of the coalescent model were set as follows: (1) the diploid population size N0 = 10,000; (2) the mutation parameter θ = 4N0 μ = 5.610 × 10⁻⁴ /bp; and (3) the cross-over rate parameters were ρ = 4N0 r = 4.0 × 10⁻³ /bp and ρ = 8 × 10⁻³ /bp for the two samples. In each sample, 100 haplotypes were simulated for a locus with 10 kb long and the number of SNP sequences was set to be 100. Two haplotypes were then randomly drawn within each simulated haplotype pool and paired to form the genotype on the locus for an individual. For each individual, we randomly selected 10 adjacent SNPs with minor allele frequency (MAF) greater than 5% to form a gene. This was done separately for each simulated haplotype pool. Finally, we had
1144
S. LI AND Y. CUI
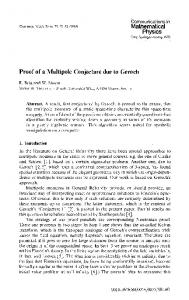
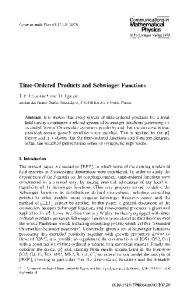
F IG . 1. The empirical type I error (A) and power (B)–(D) of the three methods, where KM, fPCA and pPCA refer to the proposed kernel machine method, the full and partial PCA methods, respectively. Different heritability levels (H2) were assumed. The variance terms (σ 2 , τ12 , τ22 , τ32 ) corresponding to different heritability levels (H2 = 0.05, 0.1, 0.2) were given as in: (B) (0.8, 0.021, 0.021, 0), (0.8, 0.044, 0.044, 0), (0.8, 0.1, 0.1, 0); (C) (0.8, 0.016, 0.016, 0.088), (0.8, 0.036, 0.036, 0.018), (0.8, 0.08, 0.08, 0.04); and (D) (0.8, 0.011, 0.011, 0.022), (0.8, 0.022, 0.022, 0.044), (0.8, 0.05, 0.05, 0.1).
genotypes for n individuals for two separate genes with 10 SNPs each, and the two genes were independent. When simulating phenotypes, four scenarios were considered (Figure 1). In scenario I [Figure 1(A)], the genetic effects were all set to zero so that we could assess the false positive control. In scenario II [Figure 1(B)], we considered the main effects for the two genes, but set the interaction effect as zero. In scenarios III [Figure 1(C)] and IV [Figure 1(D)], both main effects and interaction effect were considered. The difference between scenarios III and IV is that the interaction effect in scenario III is smaller than the main effect, while in scenario IV it is larger than the main effects. Quantitative traits of interest were simulated from a multivariate normal distribution with mean μ1n×1 and variance–covariance matrix V = σ 2 I + τ12 K1 + τ22 K2 + τ32 K3 , where τ12 , τ22 , τ32 took different values under different scenarios; K� , � = 1, 2, 3, are the kernel matrices using the allele matching method described before. Different sample sizes (n = 200, 500 and 1000) and different heritability (H 2 = 0.05, 0.1, 0.2) were assumed. Let σG2 = τ12 + τ22 + τ32 . The heritability was defined as H 2 = σG2 /(σG2 + σ 2 ). In all simulation scenarios, we fixed the residual variance σ 2 = 0.8, and τ12 and τ22 were set to be equal.
GENE-CENTRIC GENE–GENE INTERACTION
1145
3.2. Model comparison. We compared our simulation results with two other methods described in the following. Wang et al. (2009) proposed an interaction method using a partial least squares approach which was developed specifically for binary disease traits. The method cannot be applied for quantitative traits. However, in Wang et al.’s paper they compared their method with a regression-based principle component analysis method. Specifically, assuming an additive model for each marker in which genotypes AA, Aa and aa are coded as 2, 1, 0, respectively, the singular value decomposition (SVD) can be applied to both gene matrices. Let Gj = (S1 , S2 , . . . , SLj ) be an n × Lj SNP matrix for gene j (=1, 2). The SVD for Gj can be expressed as Gj = Uj Dj VjT , where Dj is a diagonal matrix of singular values, and the elements of the column vector Uj are the principal comm ponents Uj1 , Uj2 , . . . , Uj j (mj ≤ Lj is the rank for Gj ). An interaction model can be expressed as y = μ1 +
(3.1)
L1 �
βl1 Sl1 +
l1 =1
L2 � l2 =1
βl2 Sl2 + γ U11 U12 ,
where γ represents the interaction effect between the first pair of PCs corresponding to the largest eigenvalues in the two genes. The main effect of each gene is modeled through the sum of all single marker effects. For simplicity, only one interaction effect between the first PC corresponding to the largest eigenvalues in each gene was considered in Wang et al. (2009). We followed Wang et al. (2009) and compared the performance of our model with this one. In principle, one can select PCs for each gene based on the proportion of variation explained (say, >85%). Then, pairwise interactions can be considered for all selected PCs in model (3.1). Thus, if we replace the main effect of each gene in model (3.1) with PCs rather than single SNPs to reduce the model degrees of freedom, model (3.1) then becomes (3.2)
y = μ1 +
P1 � p1 =1
j
βp1 Up11
+
P2 � p2 =1
βp2 Up22
+
P1 � P2 � p1 =1 p2 =1
γp1 p2 Up11 Up22 ,
where Upj , j = 1, 2, represents the PCs for gene j , and Pj , j = 1, 2, is chosen based on the proportion of variation explained by the number of PCs in gene j . With this regression model, we considered all possible pairwise interactions of the selected PCs. G×G interaction was assessed by testing H0 : γp1 p2 = 0, for all p1 and p2 . This model was applied by He et al. (2010) in their gene-based interaction analysis. In addition to the two models above, we also compared our gene-centric approach to a simple pairwise SNP interaction model. Details of the comparison are given in Section 3.3. For a given simulation scenario, 1000 simulation runs were conducted. Type I error rates and power were examined at the nominal level α = 0.05.
1146
S. LI AND Y. CUI
3.3. Simulation results. 3.3.1. Comparison of the three methods for the overall genetic test. We first evaluated the type I error rate and the power of the three methods for testing the overall genetic effects (i.e., H0 : τ12 = τ22 = τ32 = 0). Figure 1 summarizes the comparison results between our kernel machine (KM) method and the partial PCA (pPCA) [model (3.1)] and the full PCA (fPCA) [model (3.2)] methods. In Figure 1(A), we can see that our method has the empirical type I error rate reasonably controlled for the overall genetic effect test. The partial PCA-based interaction model generates very conservative results. In all simulations we fixed the residual variance σ 2 to 0.8, and changed the three genetic effects to get different heritability levels. For scenario II [Figure 1(B)], data were simulated assuming no interaction (i.e., τ32 = 0). Then τ12 and τ22 were calculated for a given heritability level. For example, when H 2 = 0.05, τ12 = τ22 = 0.021. In scenarios III and IV, the interaction effect was set as either half of the main effects (scenario III) or twice the main effects (scenario IV). As we expected, the testing power increases as the heritability level and sample size increased [Figure 1(B)–(D)]. For a fixed heritability level, the KM method always outperformed the other two under different sample sizes. The power difference of the KM method over the other two is more striking under a small heritability level (say, 0.05) or when the sample size is small. For most complex diseases in humans, the heritability of a genetic variant is generally small. Thus, the KM method is preferable over the other two in the first stage of the interaction analysis. In addition, we also observed that the KM method is insensitive to whether the genetic effect is due to the main effect or the interaction, whereas the PCA-based method gains power as more of the genetic effect is due to the interaction. 3.3.2. Comparison of the three methods for the interaction test. Interaction may be due to a variety of underlying mechanisms. Some genes might have both significant main effects and interaction effect, while others might only incur interaction effect without main effects. Simulation studies were designed to compare the performance of the proposed KM method in discovering gene × gene interactions over the other two methods, considering different interaction effect sizes. Since the power of an interaction test is largely determined by the size of the interaction effect, we simulated data assuming different proportions of interaction effects among the total genetic variance. This proportion is defined by η = τ32 /τ 2 , where τ 2 (=τ12 + τ22 + τ32 ) refers to the total genetic variance. For a fixed total genetic variance, the value of η indicates the strength of the interaction effect between two genes. For a fixed residual variance (σ 2 = 0.8), the total genetic variance is set to 0.2 when H 2 = 0.2 and to 0.53 when H 2 = 0.4. The variance size for the two main effects were set to be equal, so we could calculate the interaction variance. For example, (τ12 , τ22 , τ32 ) = (0.08, 0.08, 0.04) when η = 0.2, and
GENE-CENTRIC GENE–GENE INTERACTION
1147
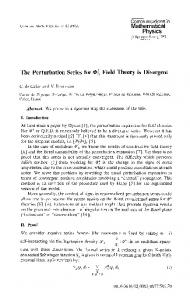
F IG . 2. Power comparison of the proposed KM model (solid line), pPCA model (3.1) (dashed line) and fPCA model (3.2) (dotted line) under different sample sizes (n) and different interaction sizes (η), where η refers to the proportion of interaction effect among the total genetic effect. (A) H 2 = 0.2 and (B) H 2 = 0.4.
(τ12 , τ22 , τ32 ) = (0.02, 0.02, 0.16) when η = 0.8 under H 2 = 0.2. Six values of the proportion η = (0, 0.2, 0.4, 0.6, 0.8, 1.0) were considered, including the two extreme cases: no interaction at all (η = 0) and pure interaction (η = 1). The method was compared with the other two PCA-based interaction analyses under two different sample sizes, 500 and 1000. Figure 2 shows power comparison (based on 1000 replicates) under two different heritability levels [Figure 2(A) for H 2 = 0.2 and Figure 2(B) for H 2 = 0.4]. The type I error (when η = 0) for the interaction test is reasonably controlled for the three methods. As we expected, the interaction power increases as the interaction effect size (η) increases. Among the three methods, our KM method has the highest power. The partial PCA model (3.1) has the lowest power. This demonstrates that only considering interaction of the first principle component in each gene is not enough to capture the interaction between two genes. The effect of sample size on the interaction power is also significant. Large sample size always leads to large power. A common concern in detecting gene–gene interactions is the computational burden. As we focus on genes as testing units, the total number of tests reduces dramatically in a gene-centric analysis compared to a single-marker based analysis. In addition, computation time can be saved by implementing the two-stage analysis: (1) doing score tests in the first stage to assess the significance of all genetic components; and (2) testing interaction only for those pairs showing statistical significance after multiple testing adjustment in the first stage. The computation for the first step is very fast since only parameters under the null model, which is a regular linear regression model, need to be estimated. In general, only a small fraction of signals can pass the significant threshold in the first stage, leaving the second stage interaction test with less computational burden. For a quick
1148
S. LI AND Y. CUI
comparison of the KM method with the PC-based approaches, when n = 500, the computation time with 1000 simulation replicates for KM, pPCA and fPCA are 28 min, 24.5 min and 24 min, respectively, for the overall test. When testing the interaction term, the KM method takes about 9sec for a single run on average, and is slower than the other two methods. However, this should not be a concern in real applications since the number of interactions is generally not very large after the first stage screening. In summary, our KM method outperforms the other two methods in the overall genetic test as well as in the interaction test under different simulation scenarios. The results also indicate that large sample sizes are needed for the detection of the interaction term compared to the detection of main effects. Even though the PCA-based analysis has been applied for candidate gene-based association analyses [Wang and Abbott (2008), Wang et al. (2009)], our simulation studies show that it may not be suitable for interaction analysis. 3.3.3. Comparison with a single SNP interaction model. In a regression-based analysis for interaction, the commonly used approach is the single SNP interaction model with the form (3.3)
yi = β0 + β1 S1i + β2 S2i + β12 S1i S2i + εi ,
i = 1, 2, . . . , n,
where β0 is the intercept; β1 , β2 and β12 represent the effects of SNP S1 in gene 1, SNP S2 in gene 2 and the interaction effect between the two, respectively; εi ∼ N(0, σ 2 ). We simulated data according to model (3.3) assuming a MAF pA = 0.3. Different heritabilities and different sample sizes were assumed. For simplicity, we assumed the same effect size for the three coefficients which are calculated under specific heritability (H 2 = 0.2 and 0.4) when generating the data. We considered an extreme case in which each gene only contains one single SNP. Data generated with model (3.3) are subject to both the single SNP interaction and the proposed kernel interaction analysis. With this simulation we tried to assess how robust the KM method is when there is only one pair of functional SNPs in two genes. Table 1 shows that both models show comparable type I error control for the overall genetic test (see Po in the table). For the interaction test, it looks like the kernel approach generates more conservative results. Here the interaction test is nested within the overall genetic test. If we aggregate the results by dividing Pi by Po , the single SNP analysis actually produces more inflated false positives compared to our kernel approach when no genetic effect is involved. When data were simulated assuming only main effects but no interaction (case β12 = 0), the two approaches yield very similar false positive rates, indicating reasonable performance of the kernel approach for false positive control. For the power analysis, we found little difference between the two methods for the overall genetic test (Po ), especially under large sample size and high heritability level. For the interaction test (Pi ), the power increases as sample size and heritability level increase. We observed relatively large power differences between the models when the sample size is small (