Gene Expression Data Mining for Functional Genomics Reinhard Guthke, Wolfgang Schmidt-Heck, Daniel Hahn and Michael Pfaff* Hans Knöll Institute for Natural Product Research Beutenbergstr. 11, D-07745 Jena, Germany Phone: +49-3641-656820, Fax: +49-3641-656825 email:
[email protected] *BioControl Jena GmbH, Wildenbruchstr. 15, D-07745 Jena, Germany Phone: +49-3641-675511, Fax: +49-3641-675512 email:
[email protected]
ABSTRACT: Methods for supervised and unsupervised clustering and machine learning were studied in order to automatically model relationships between gene expression data and gene functions of the microorganism Escherichia coli. From a pre-selected subset of 265 genes (belonging to 3 functional groups) the function has been predicted with an accuracy higher than 50 % by various data mining methods described in this paper. Whereas some of these methods, i.e. K-means clustering, Kohonen’s self-organizing maps (SOM), Eisen’s hierarchical clustering and Quinlan’s C4.5 decision tree induction algorithm have been applied to gene expression data analysis in the literature already, the fuzzy approach for gene expression data analysis is introduced in this paper. The fuzzy-C-means algorithm (FCM) and the Gustafson-Kessel algorithm for unsupervised clustering as well as the Adaptive Neuro-Fuzzy Inference System (ANFIS) were successfully applied to the functional classification of E. coli genes. KEYWORDS: Fuzzy Clustering, Machine Learning, Biotechnology, DNA Chips, Microarrays, E. coli
INTRODUCTION Genome projects and other large-scale biological research projects are now producing enormous quantities of biological data. The entire human genome, for instance, with its sequence of about 3⋅109 base pairs (bp) represented by the letters A, T, C and G would fill approximately 1000 books with 1000 pages each when printed. However, huge amounts of genomic data are being gathered with little practical value so far. The physiological functions of genome sequences are widely unknown. To overcome this situation different analysis tools have been developed in order to detect and understand the phenomena of gene regulation and physiological functions, in particular of the protein coding genes (socalled open reading frames, ORFs). Most of these tools are searching for sequence similarities comparing unknown genes with genes of known function from other organisms. This method is strictly limited to the assignment of genes with known functions. Therefore, to learn more about functionally unassigned ORFs (about 30 % in the well-known microorganisms Escherichia coli and Saccharomyces cerevisiae), gene expression studies are to be combined with functional characterization assuming that under different physiological conditions individual genes may be differently expressed. Specific responses to certain stimuli, like the addition of certain natural products or the supply of certain substrates, will provide indications with repect to the functions of the induced genes. A promising approach is to analyze transcription profiles using DNA microarrays of all genes under changing conditions in connection with the available knowledge in databases. This can be described as supervised learning if knowledge is partially available and unsupervised learning if not. In the entire genome sequence of the microorganism E. coli, widely used in biotechnology for the production of recombinant (e.g. human) proteins as well as in microbial research, 4290 ORFs were identified (Blattner et al., 1998) and used to produce DNA arrays. E. coli gene expression data published by Tao et al. (1999) using these arrays are studied in this paper and related to gene functions by different data mining methods.
ESIT 2000, 14-15 September 2000, Aachen, Germany
171 170
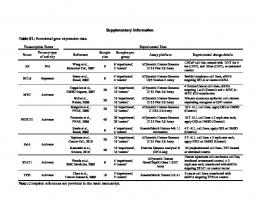
EXPERIMENTAL DATA The study described here was based on E. coli gene expression data published by Tao et al. (1999) which are also publicly available via the internet (http://www.ou.edu/cas/botany-micro/faculty/tconway/global.html). The data originate from E. coli MG1655 cultures grown under different conditions on: i) minimal medium containing 0.2 % glucose („MinGlc“), ii) rich medium with Luria broth containing 0.2 % Glucose (“LB+Glc”) and iii) gluconate medium („Gnt“; in this paper only used in conjunction with the Eisen algorithm and results shown in Figure 4). The data were determined by the Panorama™ E. coli Gene Arrays (Sigma-GenoSys Biotechnologies, Inc.) using hybridization of mRNA isolated from E. coli cells grown under different conditions with the ORF specific DNA fragments immobilized on the array followed by radioactivity detection and image analysis (see Figure 1). Functions of 67 % of all 4290 genes are known as shown in Table 1 (functional groups 1 to 21). The expression data of all 4290 genes under the two
Figure 1: Panorama™ E. coli Gene Arrays showing the expression of all 4290 protein coding genes of E. coli grown on minimal medium containing glucose (“MinGlc”, from Tao et al. 1999)
ESIT 2000, 14-15 September 2000, Aachen, Germany
172 171
cultivation conditions are shown in Figure 2a. In order to focus on methodological aspects of data mining algorithms data of only 265 genes were considered in this paper. This reduced set of genes codes for the functional groups 1 (amino acid biosynthesis), 10 (translation, post-translational modification) and 19 (putative cell structure) with non-negative expression intensity (i.e. value is higher than background value; for 3 genes the determined intensity was smaller). These pre-selected data are shown in Figure 2b. No. 1 2 3 4 5 6 7 8 9 10 11 12 13 14 15 16 17 18 19 20 21 22
Function Total Amino acid biosynthesis Putative transport proteins Central intermediary metabolism Biosynthesis of cofactors, prosthetic groups and carriers Putative enzymes Regulatory function Cell processes Phage, transposon, or plasmid Transport and binding proteins Translation, post-translational modification Putative regulatory proteins Putative factors Nucleotide biosynthesis and metabolism DNA replication, repair, restriction/modification Carbon compound catabolism Energy metabolism Cell structure putative membrane protein Putative cell structure Transcription, RNA processing and degradation Fatty acid and phospholipid metabolism Hypothetical, unclassified, unknown
Number of genes 4290 97 291 149 106 453 208 170 91 254 128 167 67 66 105 124 136 84 54 43 28 41 1428
Table 1: E. coli genes annotated by 21 functional groups (Tao et al., 1999). The three shaded rows show functions and related numbers of genes considered in the study.
RESULTS OF DATA ANALYSIS Data shown in Figure 2b were clustered and the results compared to the 3 functional groups No. 1, 10, 19 (Table 1). Cluster analysis was started unsupervised (i.e. known gene functions were not used for learning) and continued supervised using the physiological functions during the learning process. Calculations were carried out using MATLAB tools. UNSUPERVISED CLUSTERING OF GENE EXPRESSION DATA Data shown in Figure 2b were clustered in 3 classes. Figure 3 shows the results of unsupervised clustering by 4 different methods: - K-means (Mac Queen, J., 1967) - Self-organizing maps (SOM, Kohonen, 1987; Tamayo et al., 1999) - Fuzzy-C-means (Bezdek, 1981) - Fuzzy clustering by the Gustafson-Kessel algorithm (Gustafson and Kessel, 1979) Figure 4 shows the results of hierarchical clustering using the algorithm developed by Eisen et al. (1998).
ESIT 2000, 14-15 September 2000, Aachen, Germany
173 172
Figure 2a,b: Logarithmic (log10) expression intensity under two different growth conditions („MinGlc“ and „LB+Glc“) of all 4290 E. coli genes (left; data from Tao et al., 1999) and of the 265 pre-selected genes used in the study (right). Different symbols and colors indicate functional groups, e.g. black dots represent the 1428 genes of unknown function (left) and symbols +,*, (left and right) represent the 97 genes related to amino acid biosynthesis (+), the 127 genes related to translation, post-translational modification (∗) (1 gene with a negative expression value was ignored) and the 41 genes related to putative cell structure ( ) (2 genes with negative expression values were ignored).
Figure 3: Clustering results obtained by 4 different methods: K-means, self-organizing maps (SOM), fuzzy-C-means and fuzzy clustering using the Gustafson-Kessel algorithm. Results of defuzzyfication after fuzzy clustering by the fuzzy-C-means and Gustafson-Kessel algorithm are also shown. Memberships of the 265 genes to the 3 classes are indicated by the colors green, red and blue. Class centres are marked by black crosses.
ESIT 2000, 14-15 September 2000, Aachen, Germany
174 173
Although crisp clustering by K-means, SOMs and dendrograms was applied to gene expression pattern recognition earlier, fuzzy clustering was first introduced by Guthke et al. (1999, 2000). After crisp clustering by K-means and SOMs as well as after defuzzyfication of fuzzy clustering results (see Figure 3) the grade of membership m(i,k) of each gene (i=1,...,265) with repect to each of the 3 classes (k=1,2,3) is 1 (when gene i belongs to class k) or 0 (when gene i does not belong to class k). After fuzzy clustering m(i,k) has a value between 1 and 0. Therefore, the grade of membership (and the corresponding color in Figure 3 indicated also by other than the basic colors green, red and blue) between two neighboring classes changes sharply after crisp clustering and smoothly after fuzzy clustering (fuzzy-C-means and Gustafson-Kessel algorithm). Figure 3 shows on the right the results of defuzzyfication after fuzzy clustering (fuzzy-Cmeans and Gustafson-Kessel). Defuzzyfication was carried out by the maximum method (determining the class Ki=arg(maxk{m(i,k)}) with the maximum membership for each gene i). The unsupervised clustering results as shown in Figure 3 match the functional groups as shown in Figure 2b by 68 % (K-means, defuzzyfied fuzzy-C-means, and Gustafson-Kessel), and by 62.6 % (SOM). Figure 4 shows the 265 genes classified hierarchically by a dendrogram calculated using the algorithm described by Eisen et al. (1998).
Figure 4: Dendrogram as the result of hierarchical clustering of 265 pre-selected E. coli genes with respect to the expression intensities under three cultivation conditions („MinGlc“, „LB+Glc“ and „Gnt“; data from Tao et al. 1999; algorithm by Eisen et al., 1998). The 45 genes shown on the right all belong to functional group 10 (translation and post-translational modification)
SUPERVISED CLUSTERING OF GENE EXPRESSION DATA Figures 5 and 6 show the results of supervised clustering by the Adaptive Neuro-Fuzzy Inference System (ANFIS, Jang, 1991, 1993). This method generates a Sugeno-type fuzzy rule set (consisting of n2=4 rules with n=2 number of input variables) with crisp real output values that code for gene functions. The input data are the logarithmic expression intensities of the 265 selected E. coli genes determined under the two growth conditions („MinGlc“ and „LB+Glc“). 191 (i.e. 72 % of the 265) genes were classified correctly. (Results of fuzzy rule generation depend on the coding of gene
ESIT 2000, 14-15 September 2000, Aachen, Germany
175 174
functions. Coding the three gene functions No. 1, 10 and 19 by the permutated values 1, 2 and 3 provides three different results. These three clustering results match the functional groups by 59 %, 67 % and 72 %).
Figure 5: Visualization of the Sugeno fuzzy rule set generated by ANFIS. Output values 2, 1 and 3 coding functional groups 1, 10 and 19. The two input variables are the logarithmic(log10) gene expression intensities. determined under growth conditions „MinGlc“ and „LB+Glc“
Figure 7: Clustering using the decision tree induced by the C4.5 algorithm from original data. The predicted functional groups calculated by the decision tree are shown as red (group 1), blue (10) and green (19) areas.
Figure 6: Clustering by the fuzzy rules shown in Figure 5 and generated using ANFIS after the functional groups 1, 10 and 19 were coded by the three output values 2, 1 and 3. The predicted functional groups calculated by the fuzzy rule set are shown as red (group 1), blue (group 10) and green (group 19) areas.
Figure 8: Clustering using the decision tree induced by the C4.5 algorithm from data transformed into principal components by Principal Component Analysis (PCA). The predicted functional groups calculated by the decision tree are shown as red (group 1), blue (10) and green (19) areas.
Figure 7 shows the clustering results obtained applying decision trees generated by the C4.5 algorithm (Quinlan, 1993) using the original logarithmic E. coli gene expression data as determined under the two growth conditions „MinGlc“ and „LB+Glc“ as input for the rules and the functional groups 1, 10 and 19 as output. The decision tree induced consists of three crisp rules: IF MinGlc >2.9 AND LB+Glc < 3.4 THEN functional group 1 (Amino acid biosynthesis) IF MinGlc >2.9 AND LB+Glc > 3.4 THEN functional group 10 (Translation, post-translational modification) IF MinGlc