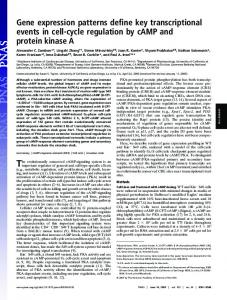
Gene Expression Profiles Define a Key Checkpoint for Type 1 Diabetes in NOD Mice Sarah E. Eckenrode, Qingguo Ruan, Ping Yang, Weipeng Zheng, Richard A. McIndoe, and Jin-Xiong She
cDNA microarrays with >11,000 cDNA clones from an NOD spleen cDNA library were used to identify temporal gene expression changes in NOD mice (1–10 weeks), which spontaneously develop type 1 diabetes, and changes between NOD and NOD congenic mice (NOD.Idd3/Idd10 and NOD.B10Sn-H2b), which have near zero incidence of insulitis and diabetes. The expression profiles identified two distinct groups of mice corresponding to an immature (1– 4 weeks) and mature (6 –10 weeks) state. The rapid switch of gene expression occurring around 5 weeks of age defines a key immunological checkpoint. Sixty-two known genes are upregulated, and 18 are downregulated at this checkpoint in the NOD. The expression profiles are consistent with increased antibody production, antigen presentation, and cell proliferation associated with an active autoimmune response. Seven of these genes map to confirmed diabetes susceptibility regions. Of these seven, three are excellent candidate genes not previously implicated in type 1 diabetes. Ten genes are differentially expressed between the NOD and congenic NOD at the immature stage (Hspa8, Hif1a, and several involved in cellular functions), while the other 70 genes exhibit expression differences during the mature (6ⴚ10 week) stage, suggesting that the expression differences of a small number of genes before onset of insulitis determine the disease progression. Diabetes 53:366 –375, 2004
esis. The information obtained from these experiments is ideal for uncovering the role of specific genes. However, the single gene approach is not the ideal way to discover new genes or the molecular networks involved in the disease process. The conventional approaches of investigation have limited the rate of progress because of the complex nature of this disease. The recent development of microarray technology has provided a high-throughput approach to simultaneously analyze the expression of tens of thousands of genes. This genomic revolution has fundamentally changed how investigators can approach biomedical questions. Several studies have used the microarray approach to study gene expression in islet cells (7–9) and immune cells (10,11). Because of the preliminary nature of the published studies on the immune system, few definitive conclusions were reached. In this study, microarray technology was used to extensively profile splenic gene expression of NOD mice at different ages. Analysis of the longitudinal expression profiles from the NOD splenic cells helped establish disease stages based on patterns of gene expression. These expression patterns were compared with those generated from age-matched NOD congenic mice, NOD.Idd3/Idd10 and NOD.B10Sn-H2b, which have a decreased incidence of insulitis and diabetes. We present here the major findings from this extensive microarray dataset of 117 mouse spleens.
T
RESEARCH DESIGN AND METHODS
ype 1 diabetes is a disease manifested when the insulin-producing pancreatic -cells are destroyed by the immune system. Studies using the NOD mouse model, which spontaneously develops type 1 diabetes, have shown that both B- and T-cells are necessary for the development of the disease (1–5). Other immune cells, such as macrophages and dendritic cells, have also been implicated in the disease process (6). Despite extensive studies on this animal model, the underlying molecular mechanisms that lead to the development and progression of type 1 diabetes remain elusive. Previous studies primarily focused on one or a few molecules believed to be involved in the disease pathogen-
From the Center for Biotechnology and Genomic Medicine, Medical College of Georgia, Augusta, Georgia. S.E.E. and Q.R. contributed equally to this work. Address correspondence and reprint requests to Dr. Jin-Xiong She, Center for Biotechnology and Genomic Medicine, Medical College of Georgia, 1120 15th Street, PV6B108, Augusta, GA 30912-2400. E-mail:
[email protected]. Received for publication 11 July 2003 and accepted in revised form 5 November 2003. B6, C57BL/6J mouse; DEPC, diethyl pyrocarbonate; MAR1, mouse array 1. © 2004 by the American Diabetes Association. 366
Mice. NOD/LtJ, NOD.B10Sn-H2b, and C57BL/6J (B6) mice were purchased from The Jackson Laboratory and then housed and bred under specificpathogen–free conditions following the Committee on Animal Use for Research and Education (IACUC) guidelines at the University of Florida. The NOD.Idd3/Idd10 breeders were a gift from Dr. Edward Leiter. The NOD.B10Sn-H2b and NOD.Idd3/Idd10 mice have been back-crossed for 15 and 11 generations, respectively. Only female mice were used in this study. Library construction. Total RNA (RNeasy Midi Kit, Qiagen) and then mRNA [Poly(A)Pure kit, Ambion] were isolated from multiple spleens of NOD and B6 female mice at 10 weeks of age. Three micrograms from each pool was used to create the library with the PCR-Select cDNA Subtraction Kit (BD Biosciences Clontech) (12) and then cloned into pCR2.1 vectors (TA cloning, Invitrogen). Each clone was amplified by PCR. Briefly, each reaction contained 22 l 100 mmol/l dNTP, 11 l 10⫻ PCR buffer, 2.2 l 20 pmol/l TA-F primer (5⬘CCGCCAGTGTGATGGATATCTG), 2.2 l 20 pmol/l TA-R primer (5⬘TCCACTAGTAACGGCCGCCAG), 0.8 l Taq polymerase, and 61.7 l deionized water. This mixture was subjected to 40 cycles of 94°C for 30 s, 64°C for 30 s, and 72°C for 1 min. The PCR product was isopropanol precipitated then resuspended in 20 l of 150 mmol/l sodium phosphate buffer (combine 1.1 ml 150 mmol/l NaH2PO4, 48.9 ml 150 mmol/l Na2HPO4, and 50 l 10% SDS, then pH to 8.5). Printing of mouse array 1 microarrays. Clear microscope slides were cleaned in a sodium hydroxide/ethanol solution (70g NaOH dissolved in 280 ml deionized water, to which 420 ml of 95% ethanol was slowly added) for 2 h. After a thorough rinsing, the slides were placed for 1 h in poly-L-lysine solution (560 ml deionized water with 70 ml poly-L-lysine and 70 ml PBS). The slides DIABETES, VOL. 53, FEBRUARY 2004
S.E. ECKENRODE AND ASSOCIATES
TABLE 1 Numbers of mice used in experiments
NOD NOD.Idd3/Idd10 NOD.B10Sn-H2b
1
2
3
3 — —
7 — —
8 7 18
Age (weeks) 4 5 6 16 4 4
8 — —
4 4 5
7
8
10
2 — —
4 1 —
9 8 5
were briefly rinsed, centrifuged dry, and aged at least 3 days before printing. The MicroGrid TAS II (BioRobotics) was used to print the mouse array 1 (MAR1) microarrays that contained the 11,520 clones created above. Following printing, the slides were postprocessed by rehydrating, ultraviolet crosslinking (60 mJ), and then incubating in a blocking solution (335 ml 1-methyl2-pyrrolodinone into which 6 g succinic anhydride is dissolved followed by 15 ml of 1 mol/l boric acid) for 15 min. Boiling water was used to denature the cDNA on each slide, followed by a brief rinse in 95% ethanol before drying by centrifugation. Hybrization. Ten micrograms of total splenic RNA (RNeasy Midi Kit, Qiagen) was reverse transcribed to incorporate aminoallyl dUTP (Sigma) into the cDNA for each of the 117 individual mice (Table 1). The reaction was purified (QIAquick PCR Purification Kit, Qiagen), reduced to 5 l volume, and then coupled to the monofunctional NHS ester Cy3 (Amersham Biosciences) for 1 h. The reference RNA, a pool of total RNA from 10 NOD and 10 B6 mice at 4 weeks, was processed in the manner described above and labeled with Cy5. The Cy3-labeled sample and Cy5-labeled reference were combined and purified (QIAquick PCR Purification Kit). The combined labeled product plus 15 l 20⫻ sodium chloride–sodium citrate, 1.8 l Cot-1 DNA (0.1 g/l), and 2.25 l 10% sodium dodecyl sulfate was applied to an MAR1 microarray and incubated at 65°C for 16 h. The arrays were washed briefly and then scanned using the Affymetrix 418 Scanner (MWG Biotech). Each of the 117 samples was compared with our reference using the MAR1 microarrays. Data analysis. MolecularWare (Cambridge, MA) and ScanAylze programs were used to extract intensity values from the individual spots. The extracted data were flagged (13) and then uploaded into Another Microarray Database (AMAD), where the normalized intensity values were calculated for each array during submission. The data were extracted and divided into biologically relevant groups for analysis using a nonparametric Mann-Whitney U test (Statistica) to identify those genes that can best distinguish the groups. Hierarchical clustering was used to cluster genes with the similarity metric correlation (uncentered) and average linkage clustering in the Cluster program. The results were then viewed using TreeView. Real-time PCR. Reverse transcription (RT) was performed from 3 g total RNA from an independent set of 8 3-week, 10 6-week, and 11 10 week NOD mice using 2 l poly T primer and sufficient diethyl pyrocarbonate (DEPC) water to total 10 l. The RT reactions were placed at 70°C for 10 min and then on ice for 5 min. The following were added to each reaction and put into a thermocycler (MJ Research) at 42°C for 2 h before being diluted 1:1 with purified water: 1 l 10 mmol/l dNTP, 2 l 10⫻ RT buffer, 1.5 l RT enzyme (Stratagene), and 5.5 l DEPC water. A control RNA pool was created (30 NOD samples above in equal amounts) and run as an internal control at the following dilutions: 1:1, 1:4, and 1:8. Each of the sample and control RT dilutions were set up in triplicate for real-time PCR analysis with 2 l diluted RT, 2 l 10⫻ PCR buffer, 2 l 10 mmol/l dNTP, 0.3 l forward and reverse primer (20 pmol/l), 0.5 l SYBR green, 0.2 l FDC, 0.13 l Taq enzyme, and 12.37 l water. Using the iCycler (BioRad), 35 cycles of 94°C for 30 s, 58°C for 30 s, and 72°C for 30 s were performed. PCR yields at the cycle threshold were calculated based on the standard curve. Twelve genes were investigated: Igj, Igh-6, B2m, Ddx5, Fech, Car2, Ms4a4b, Irf4, Rab1, Cd24a, Rik2610305D13, and Rik2310075C2. To normalize each gene, -actin was amplified for each RNA sample.
RESULTS
Subtractive cDNA library and microarray design. To identify differentially expressed genes in immune tissues, a spleen cDNA library was created using a subtractive approach. Spleen RNA samples from the B6 and NOD mice were used to reduce the representation of abundant and common genes between NOD and B6 mice in such a way that genes with higher expression in the NOD than in the B6 mouse are enriched. However, this approach is unlikely to identify genes with weaker expression in NOD than in DIABETES, VOL. 53, FEBRUARY 2004
B6 mice. We elected to focus on the genes with higher expression in the NOD mouse because the autoimmune process is expected to induce hyperproliferation and activation of lymphocytes, leading to higher expression of a number of genes. From this library, 11,520 clones were selected, and the inserts were amplified to create the MAR1, which was used throughout this study. Rapid switch of gene expression near 5 weeks of age in NOD mice. We profiled the expression of 11,520 clones from a splenic cDNA library in 61 NOD mice ranging in age from 1 to 10 weeks. Table 1 presents the number of mice analyzed for each time point and strain. Hierarchical clustering analysis of the complete clone set identified two major groups of mice: immature (1– 4 weeks) and mature (6 –10 weeks). Over 1,000 clones exhibited differential expression patterns between the two groups of NOD mice. These clones were sequenced and BLAST (basic local alignment search tool) analysis revealed 362 unique genes. The nonparametric Mann-Whitney U test was then applied to this unique gene dataset, and 80 genes with known function were significantly different between the immature and mature NOD mice, with a P value of ⬍10⫺4 (Fig. 1). Analysis of the 5-week-old NOD mice indicated that they have the immature expression profiles (Fig. 1). The mean expression levels for the 80 genes in immature NOD mice (group 1) and mature NOD mice (group 2) are presented in Table 2. Please note that the expression levels have been normalized to the immature NOD group. Of the 80 differentially expressed genes, 62 have higher and 18 have lower expression levels in mature NOD compared with immature NOD mice. A number of the genes are lymphoid-specific, and many are involved in the normal cellular processes such as transcription, translation, DNA replication, signal transduction, and apoptosis. Confirmation of differential expression by real-time PCR. Real-time PCR was used to confirm the expression differences revealed by the microarray technique. We included nine genes that have a P value of ⬍5 ⫻ 10⫺5: immunoglobulin joining chain (Igj), immunoglobulin heavy chain 6 (Igh-6), -2-microglobulin (B2m), DEAD box polypeptide 5 (Ddx5), ferrochelatase (Fech), carbonic anhydrase 2 (Car2), membrane-spanning 4-domains, subfamily A, member 4B (Ms4a4b), interferon regulatory factor 4 (Irf4), and CD24a. We also included two genes that showed differences but did not quite reach our stringent statistical criterion: RAB1 member of the RAS oncogene family (Rab1) (P ⫽ 0.0008) and Riken cDNA 2310075C12 (Rik231) (P ⫽ 0.0001). Finally, the Riken cDNA 2610305D13 clone (Rik261), which had a 3.8-fold difference by microarray, was analyzed by real-time RTPCR even though it was not highly significant (P ⫽ 0.02). Splenic total RNA samples from 8 NOD mice at 3 weeks, 10 NOD mice at 6 weeks, and 11 NOD mice at 10 weeks were isolated and analyzed for these 12 genes (Table 3). Realtime PCR was able to confirm the microarray expression differences for all nine genes that have highly significant differences between immature and mature NOD mice. Real-time PCR was also able to confirm that Rik261 was not different between immature and mature NOD mice. However, the real-time PCR and microarray data disagreed for the two genes, Rab1 and Rik231, that did not reach the stringent statistical threshold. Indeed, the real367
GENE EXPRESSION PROFILING IN NOD MICE
FIG. 1. Novel temporal transition in NOD mice between 5 and 6 weeks of age. Expression profiles of significantly different genes (P > 10ⴚ4) between immature (1– 4 weeks) and mature (6 –10 weeks) NOD mice, with the columns representing individual mice and the rows corresponding to the gene indicated in the right-hand column. Green indicates the expression level is lower than that in the common reference, while red indicates an expression level that is higher than the common reference. The bar indicates the fold difference.
time PCR data were significantly different from the microarray data. The discrepancies between the real-time PCR and microarray data are most likely due to the low intensities on the microarrays for these two genes. Gene expression changes associated with disease progression and maturation of lymphocytes. The switch in gene expression profiles around 5 weeks of age in NOD mice may be the result of two confounding biological processes: the progression to autoimmunity and the maturation of splenic cells. To dissect these two processes, we analyzed two NOD congenic strains that have little or no incidence of insulitis or diabetes: NOD.Idd3/Idd10 and NOD.B10Sn-H2b (⬍1 and 0% incidence of diabetes, respectively). These mice were chosen as controls instead of B6 because they have the NOD background. Any differences seen are more likely to be due to the disease process than to strain differences. Figure 2 displays the expression profiles of the 56 congenic NOD mice for the 80 genes differentially expressed between immature and mature NOD. Interestingly, many of the genes also exhibit a similar temporal change in the congenic mice (Fig. 2A). Fifteen of the 80 genes did not show the same trend of temporal changes in NOD congenic mice (Fig. 2B). These 15 genes exhibiting temporal changes in NOD but not in NOD congenic mice are in boldface in Table 2 (compare the P values for immature and mature NOD [group 1 vs. 2] with the immature and mature NOD congenics [group 3 vs. 4]). These genes do not fall within one functional category, but are distributed across multiple functional groups. One of the genes, 368
hypoxia inducible factor-1␣ (Hif1a), is upregulated in the NOD and downregulated in the NOD congenic mice. Expression levels in immature NOD versus congenic NOD mice. To identify those genes that are different in the preinsulitis stage, the mean expression levels in the immature NOD (group 1) and the immature congenic (group 3) mice for the 80 genes were compared (1 vs. 3 in Table 2). The vast majority of the genes are not different between these two groups of mice. Twelve genes displayed a trend of lower expression in NOD when compared to the congenic mice (P ⬍ 0.05). Six of the 12 genes (Bsg, B2m, Ii, Igh-6, Igk-V28, and Igj) are lymphoid-specific and expressed in antigen-presenting cells. Among the 12 genes, only the Hif1a gene has a 1.8-fold higher expression in the congenics than the NOD with a reasonable P value (0.0008). Other confirmatory tests will need to be performed to determine whether any of these genes are truly different between the NOD and congenic NOD mice before the onset of insulitis. Expression differences between mature NOD and congenic NOD mice. Of the 80 genes that showed temporal changes in the NOD mice, 56 have a higher expression level in the mature NOD than the mature NOD congenic mice (Table 2, group 2 vs. 4). This increase is significant for 19 of the genes (0.001 ⬍ P ⬍ 0.05) and highly significant for 10 other genes (P ⬍ 0.001). These latter genes are involved in MHC class II processing (Hspa8), B-cell development, apoptosis control (Hif1a), transcription (Hnrpa2b1 and Taf10), translation (Eif4g2), and protein transport (Dnaja2). These data are consistent DIABETES, VOL. 53, FEBRUARY 2004
S.E. ECKENRODE AND ASSOCIATES
TABLE 2 Summary of average relative expression data with corresponding P values Groups Gene Lymphocyte specific Stk10 Ms4a4b* Tmsb4x Bsg Irf4*
Description
Differentiation and activation pathways Expressed on Th1 not Th2 Tcells (integral membrane protein) Cytoskeleton actin binding T-cell maturation (membrane protein) Transcription factor (expressed only in lymphoid cells)
APC specific MHC class I processing Tra1 Chaperones proteins to MHC class I (DC maturation) B2m* MHC class I, implicated as Idd13 susceptibility gene MHC class II processing Hspa8 Binds Ii Ii MHC class II processing Ctss Key enzyme for Ii degradation (MHC class II) H2-Ab1 Antigen presentation, exogenous antigen defense response B-cell specific Sdcbp B-cell development (binds Sox4 to IL5Ralpha) Igh-6* Heavy chain of IgM Igk-V28 Humoral immune response Igi* Humoral immune response CD24a* Activation and differentiation of B-cells Signal transduction Gnb2-rs1 Adaptor protein in INFa and IL-5/IL-3/GMCSF-R signaling Hspa9a Stress response, intracellular trafficking, antigen processing Grb2 Intracellular signaling in B-cells and T-cells Gnai2 Transmembrane signaling Arhgef6 Involved in activation of Rho proteins Apoptosis Hif1a Transcription factor (B-cell development, apoptosis control) Ubl1 Protection against apoptosis, inhibits NF-B signal transduction Bnip31 Induce apoptosis (located in mitochondria) Prdx2 Apoptosis inhibitor (response to oxidative stress)
P value
2 3 4 1 NODImm NODMat CongImm CongMat
1 vs. 2
3 vs. 4
1 vs. 3 2 vs. 4
1
2.6
1.1
2.4
4 E-06
0.0003
NS
NS
1
2.5
1.1
2.2
2 E-05
5 E-05
NS
NS
1 1
3.9 4.9
1.2 1.4
2.6 3.5
⬍1 E-07 ⬍1 E-07
2 E-06 1 E-07
NS 0.02
0.005 0.04
1
0.3
0.4
0.6
4 E-05
NS
0.005
0.006
1
3.0
1.4
2.3
2 E-06
0.007
1
3.4
1.2
2.6
⬍1 E-07
⬍1 E-07
0.05
NS
1 1 1
2.4 2.9 0.5
1.0 1.4 1.2
1.0 2.5 0.4
0.0001 2 E-06 3 E-05
NS 3 E-06 ⬍1 E-07
NS 0.007 NS
0.0001 NS NS
1
2.8
1.0
2.3
3 E-05
⬍1 E-07
NS
NS
1
1.8
1.0
1.3
0.0002
0.01
NS
0.01
1 1 1 1
3.2 4.2 3.8 0.5
1.3 1.3 1.4 1.1
2.6 3.4 3.1 0.5
⬍1 E-07 ⬍1 E-07 ⬍1 E-07 4 E-06
⬍1 E-07 ⬍1 E-07 2 E-05 ⬍1 E-07
0.004 0.02 0.007 NS
0.04 NS NS NS
1
0.4
0.9
0.7