THOMAS D. NELSON and G. WILLIAM FARTHING. University ofMaine, Orono, Maine ... (I969), and Cumming and Eckerman (I965) did experiments in which a S ...
Anima/ Learning & Behavior 1973. Vol. 1. No.3, 183·188
Generalization of fixed-interval response patterning in pigeons" THOMAS D. NELSON and G. WILLIAM FARTHING University of Maine, Orono, Maine 04473 Three pigeons were trained on a multiple schedule in which key pecking was reinforced on a fixed-interval (FI) schedule in the presence of a vertical line and on a variable-interval (VI) schedule in the presence of a horizontal line. Response rates in the former component were positively accelerated (the "FI scallop"), whereas response rates in the second component were relatively constant. In a subsequent generalization test on the line-tilt continuum, the index of curvature decreased systematically as the line was rotated from vertical to horizontal in 30-deg steps. Frequency distributions of indices of curvature suggested that intermediate average index values for intermediate generalization test stimuli were mainly the result of intermediate response patterns in the individual test stimulus presentation, rather than the averaging of VI-like patterns during some stimulus presentations with FI-like patterns during other stimulus presentations.
In a typical stimulus generalization experiment (e.g., Guttman & Kalish, 1956), a S is first trained to make a conditioned operant response in the presence of a particular stimulus, with responses reinforced on, usually, a variable-interval schedule. Then, during extinction, several different stimulus values along one stimulus dimension are presented in a random order, and the number of responses to each stimulus is determined. The typical generalization gradient, in which the number of responses decreases as the test stimulus becomes less and less similar to the training stimulus, is usually interpreted as representing a simple decrease in "response strength." Response strength is, of course, an abstract concept, and response rate is only one of several possible indices of response strength. But, whatever measured dependent variable is used, it is usually assumed that response strength itself is a continuous variable that can be measured in a continuous fashion, as in, for example, the case of generalization gradients showing decreasing average response rates as a function of changes in the test stimulus. Ray and Sidman (I970) have summarized evidence that response rate may be a poor measure to use in studies of stimulus control. In fact, it may be misleading to assume that changes in responding as a function of stimuli can be described simply in terms of changes in response strength per se, where response strength is assumed to be a continuous variable. For example, Blough (I 963) has shown that many of the interresponse times during a wavelength generalization test in pigeons have the same short value, regardless of the test stimulus wavelength. These short interresponse times are apparently controlled by internal stimuli, and only the longer interresponse times are controlled by the external "This research was supported by Grant 18290 from the National Institute of Mental Health to C.W.I-. and by a NOLA Title IV fellowship awarded to T.D.f\;. Reprints may be obtained from G. William larthing. Department of Psychology. 3D I Little Hall. lniversity orMaine. Orono. Maine 04473.
stimulus value. Migler (I 964), Migler and MiUenson (I 969), and Cumming and Eckerman (I965) did experiments in which a S was trained to make two different responses (defined either temporally or spatially) in the presence of two different stimuli and then was tested with intermediate stimulus values. The results of these experiments showed that at intermediate stimulus values the response on individual trials was typically one or the other of the two responses that had previously been trained rather than some intermediate response. The conclusion to be drawn from these experiments is that the apparent intermediate response rate (or other measure of response strength) to a novel test stimulus in stimulus generalization experiments may not, in fact, represent a simple intermediate value of an underlying continuous variable, response strength. Rather, the apparent intermediate value of the dependent variable may represent the averaging of two or more different responses which the organism makes in the presence of the test stimulus, and the generalization gradient is a result of averaging different proportions of the different responses in the presence of the different stimulus values. In view of the limitations of response rate as a dependent variable in stimulus generalization research, it is important to learn more about how other dependent variables are affected by novel stimuli in generalization experiments. One essential approach is to use discrete trial procedures, as advocated by Ray and Sidman (I970). However, in order to have a thorough understanding of stimulus control. it is also necessary to use dependent variables even more complex than simple response rate, such as the degree of curvature in a fixed-interval response pattern. which is a measure of rate change as a function of time. In studying the curvature of the fixed-interval response pattern, the E does not assume that an average response rate to :1 stimulus is an adequate indication of the effect of the stimulus on the S's response. but. ruther. he explicir!y
183
184
\ELSO\ A\D FARTHING
examines the pattern of response rate change during test stimulus presentations. Konick and Thomas (1968) trained pigeons to peck at a response key illuminated by SSS-nm light, with reinforcement on a fixed-interval 6Q-sec schedule. and then administered a wavelength generalization test in extinction. Typical generalization decrements in average response rate to the novel test stimuli occurred. However. the relative fixed-interval response patterns during the stimulus presentations were essentially the same tor all of the test stimuli (except the 606-nm value. to which virtually no responding occurred). That is, response rates during the successive quarters of the 60-sec test stimulus period were multiplicatively related so that. by way of illustration, if there were 4, 6, 8. and 12 responses per quarter to one stimulus, there would be approximately 2.3.4. and 6 responses to a stimulus that produced a lower overall average response rate. In other words. there was apparently no systematic gradient of changes in the curvature of the fixed-interval response pattern as a function of test stimulus value. The purpose of the present experiment was to further study generalization of the fixed-interval response pattern. The failure of Konick and Thomas (1968) to find a systematic generalization gradient of the fixed-interval response pattern apparently indicates that, in their procedure. the response pattern was not controlled by the external wavelength stimulus. Although the wavelength stimulus controlled the overall average response rate. the particular pattern of responding was apparently controlled only by the schedule of reinforcement. In the present study, the pattern of responding was brought under exteroceptive stimulus control by using a multiple schedule in which one stimulus value (vertical line) was associated with a fixed-interval (FI) schedule of reinforcement and a different stimulus value (horizontal line) was associated with a variable-interval (VI) schedule of reinforcement. This procedure produced a typical FI positively accelerated or "scalloped" response rate pattern in the presence of the vertical line and a relatively constant rate of response in the presence of the horizontal line. Finally. a generalization test on the line-tilt continuum was administered in order to examine changes in the response pattern as a function of changes in the exteroceptive stimulus value. The present study examined generalization of the fixed-interval response pattern, as indicated by a mathematical index of curvature (Fry, Kelleher, & Cook. 1960). In addition. this study attempted to determine whether a change in the average degree of curvature as a function of test stimuli is the result of the S responding in an intermediate pattern during individual presentation of the intermediate test stimuli or. alternatively. the result of averaging two different response patterns, FI-like and VI-like. where one pattern occurs during some test stimulus presentations and the other occurs during other test stimulus presentations.
METHOD Subjects Three experimentally naive female Silver King pigeons (5-8 years old) were maintained at 80C; = 15 g of their free-feeding body weights. Apparatus The birds were trained in a Lehigh Valley Electronics ("lodeI1519) pigeon test chamber. which included a transparent response key that was mounted behind a I-in.-diam circular opening above the feeder opening. An in-line digital display cell was used to transilluminate the key with a white line (1 x 1/8 in.) on a black background. The line could be presented at any of six angles of orientation: 0 deg (vertical), =30 deg, =60 deg, and 90 deg (horizontal). Reinforcers consisted of 3 sec access to mixed grain. Extraneous noises were masked by a fan in the test chamber and a white noise in the room. Relay circuitry and recording equipment were located in an adjoining room. Procedure The birds were first trained to peck at the vertical line on the response key and given 30 continuous reinforcements (eRF) per day for 3 days. The houselight was on during initial shaping bu t was faded out during the second CRF session and remained off for the duration of the experiment. Then the birds were given one session with reinforcement on a FI 4o-sec schedule and five sessions on a FI 8o-sec schedule. In these preliminary F! sessions. the first peck after 40 (or 80) sec produced a reinforcer. terminated the stimulus on the key, and started a Io-sec blackout. These 1'1 sessions terminated after 60 reinforcements. Following the preliminary training. all birds were given 25 sessions of traininz on a VR 3 (FI 8o-sec) schedule. Only one-third of the- stimulus periods terminated with 'a reinforcement: the other two-thirds of the stimulus periods terminated with the first peck after 80 sec. with no reinforcement. As before. stimulus periods were separated by l Il-se c blackouts. These sessions terminated after 20 reinforcements. The final phase of training involved 80 sessions of discrimination training on a multiple VR 3 (F! 8o-sec) vs VI 24o-sec schedule. The VR 3 (FI 8o-sec) (vertical line) component alternated randomly with an equal number of VI 24o-scc (horizontal line) components. All FI components terminated with the first peck after 80 sec. whereas VI components terminated automatically after 80 sec; all stimulus periods were separated by 10-sec blackouts. In each component a reinforcement could occur once even' 240 sec on the averasc. In the FI component. reinforcement c·ould be produced by the first peck at the end of an 8o-sec stimulus period (for one-third of the periods>. while reinforcement might be produced at any time during an 80-sec stimulus period in the VI component. These multiple-schedule training sessions terminated after 20 reinforcements. Finally. all birds were given J warm-up of additional multiple-schedule training until 10 reinforcers had been collected and then a generalization test in extinction. Each of the six line-tilt stimuli was presented once in each of 12 randomized blocks. During the test. the E recorded the number of key peck responses during each 2o-sec quarter of each 80-sec stimulus period. Test stimulus periods were separated by In-sec blackouts.
RESULTS The degree of response rate acceleration within the
GENERALIZATIO~
or FIXED-INTERVAL RESPONSE PATTERNING
80-sec stimulus periods was analyzed in terms of an index of curvature (Fry, Kelleher, & Cook, 1960): For an interval divided into quarters, the maximum and minimum values of the index are +0.75 and -0.75, indicating all responses occur in the fourth quarter and all responses occur in the first quarter, respectively; the index is 0.00 when there are an equal number of responses in each of the four quarters. The average indices of curvature for Birds 1, 2, and 3 for the last two sessions of preliminary FI 80-sec training were 0.15. 0.27, and 0.25, respectively. For the last five sessions of VR 3 (FI 80-sec) training, the indices were 0.20, 0.14. and 0.13, respectively. For the last 10 sessions of mult VR 3 (FI 80-sec) vs VI 240·sec training, the average indices in the FI component (and the VI
T _ _ #1
0.3
...--. #2 t" - - -0/1 3
W
0::
:::>
I-
g 0.2
0::
:::>
o
u,
o
x 0.1
w o
z
90° -600 -30° VI
0° "30" ·60" 90°
rl
LINE TILT
VI
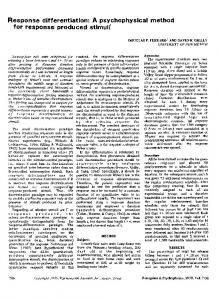
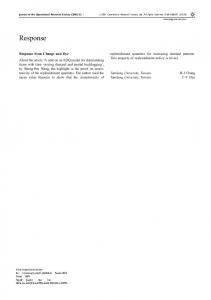
Fig. 2. Average indices of curvature for each of the generalization test stimuli for individual Ss, These average indices are based on the total response data shown in Fig. 1.
BIRD # I 300
200
185
~
r--~-
2 3 QUARTER
4
Fig. \. Total number of responses to each generalization test stimulus during each 20-sec quarter of the SO-sec stimulus presentations for individual Ss. During training. key pecking had been reinforced on a VR 3 (FI So-se(') schedule in the presence of the O-deg line and on a VI 240-sec schedule in the presence of the 90-deg line.
component, in parentheses) were 0.21 (0.04), 0.19 (0.04), and 0.12 (0.00), respectively. For the three birds, the average response rate increased from 3I .2/min in the first quarter to 83.1 /min in the fourth quarter of the FI component but only from 63.2 to 7I.9/min in the VI component during the last 10 training sessions. Examination of individual cumulative records obtained during the mult VR 3 (FI 80·sec) vs VI 240·sec training indicated that the FI "scalloped" response pattern in the presence of the vertical line was typically a period of no responding when the vertical line was presented, followed by an abrupt shift to a high rate of responding until the end of the 80·sec period (break and run pattern). The length of the pause in the FI component was variable, but the pause occurred reliably. In the presence of the horizontal line, a break and run pattern was rarely observed and a steady response rate was typical. In general, responding was more variable in the presence of the vertical (FI) line than the horizontal (VI) line. Figure 1 shows the total number of responses to each generalization test stimulus during each 20-sec quarter of the 80-sec stimulus presentations. Birds 1 and :2 had about equal average response rates in the fourth quarter of the O-deg (FI) and 90-deg (VI) line stimuli during the test, but Bird 3 responded considerably less to the O-deg line than to the 90-deg line, even in the fourth quarter. Figure :2 shows the overall average index of curvature for the pattern of responding during each test stimulus for individual Ss. This average index of curvature was calculated from the response totals shown in Fig. 1. The average index of curvature was highest at the O-deg (FI) stimulus for each bird and decreased svsternaticallv as the line tilt approached the 90-deg (VI) stimulus. . In order to analyze the generalization test data in 111l1re detail. indices of curvature were calculated for each individual 80-s('c test stimulus presentation. (A small number of test stimulus periods where no response- ,)l'CUrred wc rc omitted t'roru the further
186
~ELSON u, :!:
--
AND FARTHI~G
• !
o~
::: c' --
3
x
I~
3 ") 2 8,R" 3:;;--:
l
.:
2
B:R)
I
C' 2
L...
c:: Z
Z