until their business server crashed (Computer. Security ... business applications and databases in UNIX network .... transfers them to the computer node hosting.
International Journal of Web Portals, 2(2), 51-67, April-June 2010 51
Generalized Evidential Processing in Multiple Simultaneous Threat Detection in UNIX Zafar Sultan, University of New England, Australia Paul Kwan, University of New England, Australia
ABSTRACT In this paper, a hybrid identity fusion model at decision level is proposed for Simultaneous Threat Detection Systems. The hybrid model is comprised of mathematical and statistical data fusion engines; Dempster Shafer, Extended Dempster and Generalized Evidential Processing (GEP). Simultaneous Threat Detection Systems improve threat detection rate by 39%. In terms of efficiency and performance, the comparison of 3 inference engines of the Simultaneous Threat Detection Systems showed that GEP is the better data fusion model. GEP increased precision of threat detection from 56% to 95%. Furthermore, set cover packing was used as a middle tier data fusion tool to discover the reduced size groups of threat data. Set cover provided significant improvement and reduced threat population from 2272 to 295, which helped in minimizing the processing complexity of evidential processing cost and time in determining the combined probability mass of proposed Multiple Simultaneous Threat Detection System. This technique is particularly relevant to on-line and Internet dependent applications including portals. Keywords:
Dempster Shafer, Extended Dempster Shafer, GEP, Intrusion Detection Systems, Multiple Simultaneous Threat Detection, Set Cover, UNIX
1. INTRODUCTION Computer security has become very critical issue in the IT industry. Almost every organization is facing security threats both from employees and outside intruders. Internet and Web and web portal IT systems are highly vulnerable to hackers and on many occasions, hackers have DOI: 10.4018/jwp.2010040105
broken the existing security measures and have stolen million dollar information and damaged the IT infrastructure. The increasing complexity of the web portals and internet architecture has simply widened and opened another area of security challenges for the whole IT industry. In order to protect organizations securities in terms of critical business and personal data, IT industry has to keep on strengthening their efforts to develop intrusion detection system. As a result, organizations need to spent bil-
Copyright © 2010, IGI Global. Copying or distributing in print or electronic forms without written permission of IGI Global is prohibited.
52 International Journal of Web Portals, 2(2), 51-67, April-June 2010
lion of dollar just for securing and smooth run of their business data over the internet. For example Microsoft spent $1.2 billion to stop Sapphire/Slammer worm in 2003 (Ma, 2001; Spafford, 1991). Business dependence on Internet-based services, and Internet-facing platforms such as enterprise portals, significantly increase the prospect of concerted security attacks. In spite of all these security measures and highly recommended Intrusion Detection Systems, hackers still continuously breaking companies securities, exploiting system weaknesses and perform illegal functions such as stealing important information, business secrets, damaging data or systems etc. etc. The biggest challenges in the security fields are the types of attack, their point of origin and the quantity of damage and of course to identify attack and block it in time is the most demanding aspect for the IT industry (Braun, 2000; Siaterlis & Maglaris, 2004). Due to complexity of the UNIX applications infrastructure and Network architecture and implementation of multiple monitoring systems, false alarms have really become a big headache for the large companies. Millions of dollars have been spent just to build monitoring infrastructure but there does not seem to be any solution to stop false positive and false negatives. In general most of the Intrusion Detection Systems check the application layer, data layer and network layer data based on pattern matching with the existing situations of the processes and systems attributes. However, it is quite difficult to track an attacker if he / she just penetrate security and then keep steeling business data for months and months until new security updates find this attack but it is then too late. Damage has already been done. Looking into these facts, it looks a continuous battle between security implementers and hackers. But this is well known fact that an advancement of Intrusion Detection Systems have certainly reduced the number of security violation incidents and it has become more difficult for hackers to penetrate any IT systems that is well protected and secured using advance implementations
of firewalls, intrusion detection system and monitoring systems (Bendjebbour et al., 2001; Hall, 1992). The emphasis of our research is the experimental evaluation of the simultaneous multiple threat detection system using Multi-sensor data fusion, its various approaches and techniques in UNIX environments. Our research will help in building multiple simultaneous threat detection system for computer security in general and for web based applications, web portals and internet applications of UNIX environments in particular. The main target of this paper is an advance step to use Dempster Shafer, Weighted Dempster Shafer and Generalized Evidential Processing (GEP) theory for Multi-sensor data fusion whilst in our previous research experiment, We used only Dempster Shafer and weighted Dempster Shafer for data fusion. Therefore, in this paper we will provide numerical comparisons between Dempster Shafer, Weighted Dempster Shafer and Generalized Evidential Processing and compare their efficiency and performance.
2. EXISTING THREAT DETECTION APPROACHES IN UNIX Parametric / non parametric techniques like Bayesian, Dempster Shafer, fuzzy rule and Kalman Filter are the most predominated techniques used for multiple threat detection in UNIX (Braun, 2000; Grocholsky, Makarenko, & Durrant-Whyte, 2003; Wu, Siegel, Stiefelhagen, & Yang, 2002). Theory of Set Cover, Chapman-Kalmogorov prediction model and method of least squares have also been used as an integral model with Bayesian, Dempster Shafer, Extended Dempster and GEP (Koks & Challa, 2005). Intrusion Detection Systems fetch data from system network layer, log files and other monitoring files. Data may be sniffer’s packets; sys log files, SNMP traces, system messages and other similar activities of the network. The existing IDS monitoring and alarming system provide good security measures against most
Copyright © 2010, IGI Global. Copying or distributing in print or electronic forms without written permission of IGI Global is prohibited.
International Journal of Web Portals, 2(2), 51-67, April-June 2010 53
of the internal and external threats but these systems are not intelligent enough to detect 100% of the threats as they can detect only the threats whose information exist in their databases. The security systems of a large company Langley could not detect threats on their network until their business server crashed (Computer Security Institute, 2002). Though a few yeas back UNIX was one of the secure environments from the hackers but in the past few years, intruders have broken many business applications and databases in UNIX network whilst all critical business like credit cards, client profiles and financial transactions are online and need more security ever than before. The current IDS cannot auto track, identify and block all the threats. Therefore, additional research and development is required in the field of multiple sensor data fusion of IDS in UNIX environment (Bendjebbour et al., 2001; Klein, 1999; Rehman, 2003).
2.1 Other Data Fusion Approaches A real time numerical comparisons and calculations of data fusions models are rare for Bayesian, Dempster Shafer and Extended Dempster Shafer and almost nonexistent for GEP in the UNIX environment. Although there is some valuable literature is available in defense and other related fields. GEP is therefore, a relatively new area to work on. Mostly researches used Bayesian, Dempster Shafer, parametric / non parametric and few others inference engines for Multi-sensor data analysis in their IDS. Dong and Deborah (2005) commented that hybrid model of Bayesian is the better technique to improve the intrusion detection precision for IDS. They found 19% improvement in threat detection with their hybrid data fusion models (Chatzigiannakis et al., 2002). Siaterlis and Maglaris (2004) also used hybrid data fusion model based on Bayesian and Dempster Shafer and concluded that hybrid model increased the precision in threat detection. Though there is no numerical comparisons provides in their papers.
Wu, Siegel, Stiefelhagen, and Yang (2002) found a theoretical relationship of Bayesian and Dempster in comparisons with classical probability model. And concluded that the combined inference model of Bayesian and Dempster Shafer will be a promising area for Multi-sensor data analysis in IDS Habib, Hefeeda, and Bhargava (2003) and Siaterlis and Maglaris (2004) worked only on Baysian inference and did not use any hybrid model. Zamboni (2000) used a pattern matching detection model to detect new attacks, however, he did not mention any particular fusion model in his experiment. Chatzigiannakis et al. (2002) used Principal Component Analysis for Multi-sensor data fusion for intrusion detection and found that their fusion model is more effective than single metric analysis. Gorodetski, Karsaev, Kotenko, and Khabalov (2002) suggested that combining a decision model is better in threat detection precision than a Meta model in IDS. Kumar (2000) worked on IDS architecture and found that rule set knowledge, expert systems state models and string match are useful parameters in the development of an advance threat detection model. Hugh (2005) described mathematical model for their fusion model. They analysed data with hybrid model of Kalman Filter and Bayesian theorem. Brugger (2004) worked on offline data fusion model, used data mining approach in her IDS. However, she did not produce any particular model during her experiment. In the view of all above literature references, it is obvious that in general, there is enough material on Multi-sensor data fusion models of IDS in the field of defense and other related areas. However, very little was reported in the UNIX environment. And almost negligible work was found if we search material or study on numerical calculations or comparisons of the performance & efficiency of the multiple simultaneous threat detection in the field of UNIX.
Copyright © 2010, IGI Global. Copying or distributing in print or electronic forms without written permission of IGI Global is prohibited.
54 International Journal of Web Portals, 2(2), 51-67, April-June 2010
3 ORIGINAL CONTRIBUTIONS In this research, we will identify a multiple simultaneous threat detection model. This model will be a hybrid of Bayesian, Dempster Shafer, Extended Dempster Shafer and GEP theory of inferences. Set Cover theory will be used as a middle tier data processing tool. The set cover will help only to provide the reduced set of data to achieve better control in final data fusion and cost savings of the data processing. This hybrid model will increase the precision in threat detection and reduce the volume of false alarms in UNIX environment. The use of the model will assist in decreasing the data security expenses, particularly web based businesses and web portals. Researchers will get also benefit for future IDS developments in UNIX (Burroughs, Wilson, & George, 2002). The new multiple simultaneous threat detection model will be able to detect more than one threat simultaneously. Another advantage is that the results of this research can be applied in high speed networks like cyberspace. There are also some additional situational parameters that will be generated as a result of this work such as high level architecture of multiple threat detection model, identification of proper Multisensor environment based on hybrid model, and identification of middle tiers of the research. This research, in fact, is a step forward of our previous research results on Multiple Simultaneous Threat Detection to address the additional precision in multiple threat detection process as compared to the existing threat detection approaches in UNIX and it is different in many ways from other’s work in Multi-sensor data fusion in IDS development.
3.1 Set Cover Set Cover is a branch of mathematics and in this research we deal with sets, subsets and their interaction sets. Set Cover is the basic system of mathematics. Simple facts of set union and its subsets are used in cover sets of multiple simultaneous threat detection system that is a basic branch of mathematics (Aickelin, 2002).
In multiple simultaneous threat detection system the total numbers of elements were 2274 (Derived in section 5.1) denoted by: n
=∑ u i =1
i
(1)
n Where is the universal set and ∑ ui i=1 is sum of all the elements in the universal set In the experiment, the types of threats represented by subsets S , S , S ,....., S Í And the cost of 1 2 3 j each set isC ,C ,C ,.....,C k . 1 2 3 In our case threat(s) are present in different data substrings from any of the 4 different intrusion detection systems of a distributed Unix Network. The target is to find the sets P = {1, 2,…, l} that must contain minimum number of strings having threats so that each set have all the relevant strings of data and summation of sets will have all the strings of the inputs. Cover set using greedy algorithm also provides minimum cost represented by Q. m Q = ∑ Ci i=1
(2)
m Where ∑ C i is the sum of the costs in i=1 selecting a new node of the experiment The cost effectiveness to select computer node is denoted by b based on greedy algorithm β=
C (Q ) Q -P
(3)
Where C (Q ) is the initial cost for selecting the nodes for each intrusion detection
Copyright © 2010, IGI Global. Copying or distributing in print or electronic forms without written permission of IGI Global is prohibited.
International Journal of Web Portals, 2(2), 51-67, April-June 2010 55
system and P is the set with minimum elements and Q is the minimum cost in selecting the new node.
4 APPROACHES AND METHODOLOGY In a large number of Multi-sensor data fusion model, Bayesian and Dempster Shafer have been used for data analysis. Most of the existing work was in single threat detection (Wu, Siegel, Stiefelhagen, & Yang, 2002). Only couple of researchers tried to focus on multiple threat detection without using Set Cover theory. Set Cover has been identified as a new area which can be used to prioritize and schedule rule set on certain criteria in the fusion process. On this topic there are only a few papers available in the UNIX environment, therefore, it is difficult to compare literature on Multi-sensor threat detection in UNIX (Braun, 2000; Zamboni, 2000).
4.1.Multiple Simultaneous Threat Detection System The main target of this research is to identify the exact threat(s) with a high degree of precision by using hybrid data fusion model comprised of Set cover, Bayesian theory of estimation, Dempster and Extended Dempster Shafer theory. The origin and directions of the threats are exclusive of this research as that includes complicated, extensive and separate research. In this distributed test environment which is conceptually the same as server client environment, a multiple simultaneous threat detection system has been set up on different nodes across the distributed subnets. Computer nodes are comprised of multiple operating systems and located at different networks, predominantly UNIX though include Wintel machines as well. Each computer node has different intrusion detection system that filters all the network data and collects threat related information and transfers them to the computer node hosting multiple simultaneous threat detection system for further accuracy and precision of the threat
detection results. The computer nodes across different subnets receive different threats. As this is a controlled experiment, 4 types of threats mainly denial of service, man-in-the-middle, buffer overflow and Trojan will be initiated from one of the experimental computer node.
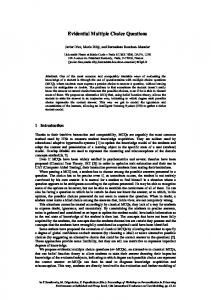
4.2 Architecture of Multiple Simultaneous Threat Detection System In this experimental test environment, 4 independent intrusion detection systems work as a separate Multi-sensor observers on different subnets. In order to monitor all data packets in the test environment, we used a switch on test network and configured a monitoring port to replicate all packets of the data traffic passing through the switch. Network data of layer 2 and 3 was also gathered. Data collecting software then decodes and analyse the data. We used following software for data collection: MARS, Sniffers, Snoop and Wireshark. Four types of threats: DoS, Denial of Service, Mom- man-inthe-middle attack or bucket-brigade attack or Janus attack, Buffer overflow or buffer overrun and Trojan Horses. Each intrusion detection system collects network data and filters it using Cover set theory. Data may contain a single, two, three, four or any combinations of the above 4 x threats or false alarms and then move the data to next level of the data fusion within the multiple simultaneous threat detection system. The Multiple simultaneous threat detection system processes the data through different statistical and mathematical techniques and makes decision about the threats. Then multiple simultaneous threat detection system’s client nodes that exist on each computer uses the Set Cover Model as a middle tier data fusion tool which refines the data into small group of sets and schedules these groups of data for onward statistical and mathematical data fusion. Another benefit of the Set cover model is to choose computer nodes that cover all the anticipated threats at a minimum cost (Figure 1).
Copyright © 2010, IGI Global. Copying or distributing in print or electronic forms without written permission of IGI Global is prohibited.
56 International Journal of Web Portals, 2(2), 51-67, April-June 2010
5. RESULTS OF THE TEST EXPERIMENT Set Cover Fusion Model The initial processing cost (in dollar) for selecting the nodes for each intrusion detection system is: C
(A)
= 8 = cost of the 1 Node st
C (B ) = 5 = cost of the 2nd Node C (C ) = 12 = cost of the 3rd Node C (D ) = 8 = cost of the 4th Node The sets with minimum number of elements denoted by P (number of threats) and set with minimum cost Q (in dollar) for each node were
determined during the experiment. The total number of sets whose cost was lowest and set with minimum number of elements covered by node A, B, C and D of the experiment are given as: P(A) = 0, P(B ) =3, P(C ) =3, P(D ) =4 Q =8, Q(B ) =4, Q(C ) =7, Q(D ) =8 (A) Here we like to make it clear that the above values are the number of the sets not the elements of the sets, therefore, it should not cause any problem or mix up whilst reading Table 1. The optimal cost as per cost effectiveness β of the nodes using equation (3) would be A+D+C=8+8+12=28. The cost effectiveness of the node are A, D, C and B respectively (Sultan, 2009).
Figure 1. The architecture of the multiple simultaneous threat detection system
Copyright © 2010, IGI Global. Copying or distributing in print or electronic forms without written permission of IGI Global is prohibited.
International Journal of Web Portals, 2(2), 51-67, April-June 2010 57
5.1 Set Cover’s Set Generation In order to collect 4 types of threats, 4 intrusion detection systems collected 2274 malicious substrings of 15 and above bytes from the experimental network. The threat data was a mixture of all 4 types of generated threats. Set Packing provided us the ability to select the K = 4 number of subsets out of the union set N of 2274 such that each subset is a pair wise disjoint to other subsets. Thus each subset now has similar strings of the threat data whose union is N. In order to find out pair wise disjoint subsets, we analysed N=2274 threat data using a small perlscript. The script separated pair wise disjoint strings of the threat data into 4 subsets of total 295 substrings. The number of elements or substring in each subset is given as seen in Table 1. The client node sends all the above filtered data to next level of the data fusion system of the multiple simultaneous threat detection system. The multiple simultaneous threat detection system combines all the multi-sensor threat data that has already been filtered into different sets of minimum size using Set Cover model. In order to detect the real threats, improve the accuracy and precision in threat detection; the multiple simultaneous threat detection system fuses the multi-sensor data with Bayesian theory of estimation, Dempster, Extended Dempster Shafer and Generalized Evidential processing.
5.2 Dempster Shafer Theory to Fuse Data In this experiment, frame of discernment θ will be a set of elemental propositions or combinations of the hypothesis statements. Threats denoted by T may be overlapping or different to each other. In the set of n mutually exclusive and exhaustive set of hypotheses about threat(s) T …..T n . Θ = {T 1 , T 2 …T n } If
q
(4)
have set of n hypotheses, Boolean
combination of the set will be q n hypotheses. Dempster Shafer theory does not calculate the probability of a hypothesis but helps in finding out the probability of the evidential support for a hypothesis. Unlike Bayesian and classical theory of inference, Dempster Shafer theory of inference helps in developing probability mass m (θ) by assigning evidence to each propositions or general propositions. Each intrusion detection system can assign evidence via probability mass to each of the 4 threats, e.g. M1 (T1), M2 (T2), M3 (T3) and M4 (T4). The total probability masses of all the propositions including general propositions will be equal to 1. The probability mass is represented as: m (θ) ≤ 1
(5)
Table 1. Set cover subsets reduced the sizes of the sets Threat Data of Intrusion Detection Systems IDS
Before Set Cover
After Set Cover
Wireshark
128
122
Sniffers
439
82
Snoop
646
32
MARS
1061
59
Total
2274
295
Copyright © 2010, IGI Global. Copying or distributing in print or electronic forms without written permission of IGI Global is prohibited.
58 International Journal of Web Portals, 2(2), 51-67, April-June 2010
n
∑
m (θ) = 1
(6)
i =1
m (θ) is the probability mass of any possible hypotheses. In this experiment that may be a single threat or combinations of the 4 threats.
5.3 Propositions / Hypothesis We have 4 sensors (intrusion detection systems) and 4 different types of threats. Sensors can receive a single threat or any possible combinations of the 4 generated threats. The total possible base propositions using mathematical theory of combinatorics with and without repetitions are 340 and 15 respectively. As repeated threats are of no significance during hypothesis testing and will also unnecessary increase processing cost and time. Therefore, we will only concentrate on the propositions without repetitions. Only 4425 (15 x 295) non repetitive propositions will be processed and tested by MTDS engine as compared to 773160 (340 x 2274) with repetitive propositions. The general Combinations and Permutations formula is: P(n,r) =
n! r ! (n − r ) !
Case 4: when four threats detected by each sensor, total # of hypothesis / propositions with and without repetitions would be 1 and 256
Limitation Due to high complexity of the probability mass and weights calculations, it is not possible for us to cover all the 15 non repetitive hypotheses during our research. Therefore, I’ll test only four elementary hypotheses as mentioned in section 5.3.
5.4 Fusion without Using the Weights of the Intrusion Detection Systems This experiment has 4 types of intrusion detection systems and each has its own way of threat detection. This means each intrusion detection system has different perception and reliability that it provides to multiple simultaneous threat detection system. The Dempster Shafer model to combine the probability masses of the threats from more than two independent intrusion detection systems: n
∑ M (T
i, j =0
i
i, j
)=
(7)
Where n is the number of sensors (Intrusion Detection System), r is the number of threats to be selected (0 ≤ r ≤ n), where n =4 in this experiment, if r = n, P(n, r) = n! Case 1: when single threat detected by each sensor, total # of hypothesis / propositions with and without repetitions would be 4 and 4 Case 2: when two threats detected by each sensor, total # of hypothesis / propositions with and without repetitions would be 6 and 16 Case 3: when three threats detected by each sensor, total # of hypothesis / propositions with and without repetitions would be 4 and 64
n
∑ p({T
i, j =0
i, j
p({Ti, j }) }) + p({¬Ti, j })
(8)
Where M i (Ti, j ) is probability mass function, T i, j
is the ith threat of the jth Intrusion Detection
System and p({Ti, j }) is the probability of an ith threat of the jth Intrusion Detection System for a particular type of the threat? The calculation of the combined probability mass functions will be followed as:
Detected Alerts P ({T }) = 1,1
= Observed Alerts
17 = 0.3333 51
(9) Copyright © 2010, IGI Global. Copying or distributing in print or electronic forms without written permission of IGI Global is prohibited.
International Journal of Web Portals, 2(2), 51-67, April-June 2010 59
P ({T }) is the probability assigned to 1,1
M 1,2, 3
(T ) = 0.104895105 1,2, 3
(14)
the 1st threat by 1st Intrusion detection system. M Detected Alerts P ({T }) = 2,2
= Observed Alerts
9 = 0.272727273 33 (10)
P ({T }) is the probability assigned to 2,2
(T ) is the combined probabil1, 2, 3 1, 2, 3
ity mass of the threat 1, 2 and 3 assigned by the intrusion detection system 1, 2 and 3. Similarly the probability mass of the 4 intrusion detection system would be: M
(T ) = 0.05841627 1, 2, 3, 4 1, 2, 3, 4 (15)
the 2nd threat by 2nd Intrusion detection system.
M (T ) is the combined prob1,2,3,4 1,2,3,4
Detected Alerts P ({T }) = 3,3
= Observed Alerts
5 = 0.384615385 13 (11)
P ({T }) is the probability assigned to 3,3 the 3rd threat by 3rd Intrusion detection system. Detected Alerts P ({T }) = 4,4
= Observed Alerts
9 = 0.346153846 26 (12)
P ({T }) is the probability assigned to 4,4 the 4th threat by 4th Intrusion detection system. Putting the above values in the combined probability mass formula equation (12) M
1,2
(T ) = 0.157894737 1,2
M
1,2
(13)
(T ) is the combined probability 1,2
mass of threat 1 and 2 assigned by the intrusion detection system 1 and 2.
ability mass of the threat 1, 2, 3 and 4 assigned by the intrusion detection system 1, 2, 3 and 4. In this experiment only 4 x threats and 4 x intrusion detection systems are participating in data gathering, therefore this combined probability mass formula for two, three and four threats was calculated.
5.5 Data Fusion Using Weights of the Intrusion Detection Systems Unlike Bayesian decision theory, Dempster Shafer model can assign evidence to a single or group of propositions in an experiment and can combine probability masses of the propositions emerging from more than two sources but its self-evident definition of evidence (probability mass) is not very accurate. The Dempster Shafer theory of inference also has some issues in renormalization of the probability mass during probability masses combinations. Thus it has become one of the most challenging tasks to find out the ways to perfect the evidential or probability mass combination techniques to increase the accuracy of the statistical decisions. In our research, we used two different ways to improve decision making. 1. Weights of the observations 2. Generalized Evidential Processing
Copyright © 2010, IGI Global. Copying or distributing in print or electronic forms without written permission of IGI Global is prohibited.
60 International Journal of Web Portals, 2(2), 51-67, April-June 2010
These methods minimized the effect of probability assignments to the propositions and renormalization of the rule of combinations of the probability masses of the preposition(s). For more detail please see a publication [26]. The Probability formula for calculating the probability mass and weights of an Intrusion Detection System for a particular threat is: Wn n M ( T ) ∑ i i, j i = ∑ n
i, j =0
i, j =0
Wn P ({Ti, j }) i
Wn P ({T }) 1 is the weighted probabil1, 1 ity assigned to the 1st threat by 1st Intrusion detection system. Wn P ({T }) 2 = 2,2
Detected Alerts = Observed Alerts
18 = 0.642857143 28 (20)
Wn Wn P ({Ti, j i}) i + P ({¬Ti, j }) i
(16) Where T is the threat and W is is the weight of the intrusion detection system and P is the probability of the ith threat of jth Intrusion Detection System.
Wn P ({T }) 2 is the weighted probabil2,2 ity assigned to the 2nd threat by 2nd Intrusion detection system. Wn P ({T }) 3 = 3,3
Wn Wn i and P ({Ti . j }) = 1 − P ({¬Ti . j }) i
Detected Alerts = Observed Alerts
8 = 0.363636364 22
(17)
(21)
Wn P ({Ti, j }) i is the probability assigned to
Wn P ({T3,3 }) 3 is the weighted probability
the ith threat by jth Intrusion detection system with weight. The Probability formula for calculating the weights of an Intrusion Detection System for
assigned to the 3rd threat by 3rd Intrusion detection system.
n
a particular threat: W n = − ∑ Pi log P (18) j i, j =1
Where W is the weight of the Intrusion Detection Systems (sensors) and P is the probability of an ith threat of jth Intrusion Detection Systems. Calculations of the Extended Dempster Shafer will be as followed: Wn P ({T }) 1 = 1,1
Detected Alerts = Observed Alerts
18 = 33
Wn P ({T }) 4 = 4,4
Detected Alerts = Observed Alerts
9 = 0.529411765 17 (22)
Wn P ({T4,4 }) 4 is the weighted probability
assigned to the 4th threat by 4th Intrusion detection system. The weights of the intrusion detection 0.545454545 systems: (19)
Copyright © 2010, IGI Global. Copying or distributing in print or electronic forms without written permission of IGI Global is prohibited.
International Journal of Web Portals, 2(2), 51-67, April-June 2010 61
n W n = − ∑ P 1 log P 1 = 0.143586237 1 i =1 (23) (27)
Wn 1 is the weight of the 1st intrusion detection system M n W n = − ∑ P 2 log P 2 = 0.123354981 2 i =1 (24) W n is the weight of the 2nd intrusion detec2 tion system n W n = − ∑ P 3 log P 3 = 0.159757343 3 i =1
(T 1, 2 1, 2
Wn ) i = 0.753303965, is the
weighted combined probability mass of the probability assigned to 1st and 2nd threat by 1st and 2nd intrusion detection system using equation (23). Similarly the other weighted combined probability masses of the other intrusion detection systems would be:
M
(T 1, 2, 3 1, 2, 3
Wn ) i = 0.373362445
(25) M
n W n = − ∑ P 4 log P 4 = 0.146226924 4 i =1
5.6 Data Fusion using Generalized Evidential Processing Theory
Wn 4 is the weight of the 4th intrusion detection system
(T 1, 2, 3, 4 1, 2, 3, 4
(28) n W ) i = 0.819596134
W n is the weight of the 3rd intrusion 3 detection system
(26)
(29)
GEP is a generalization of Bayesian theorem. Similar to Bayesian theory, GEP can assigns evidence to hypothesis only whilst Dempster Shafer has an edge over an assigning the evidence to both conflicting propositions and hypothesis. As this research deals only with testing hypotheses, therefore, GEP and Dempster Shafer have exactly the same role in assigning evidences to the hypothesis. However, GEP assign and combine probability masses based priori conditional probability whilst Dempster Shafer updates priori probability of the hypothesis based on observation evidence. Therefore, in this research, priori probability of the hypoth-
Copyright © 2010, IGI Global. Copying or distributing in print or electronic forms without written permission of IGI Global is prohibited.
62 International Journal of Web Portals, 2(2), 51-67, April-June 2010
esis (threats) will be identified by any intrusion detection system of the test experiment. Although, the main benefit of GEP is that it separates hypothesis from decision. GEP also describe the relationship of evidential assignments with fusion decision. This provides opportunity to test hypothesis at different quantization of the data. The Generalized Evidential Processing model to combine the probability masses of the threats from more than two independent intrusion detection systems:
(30) Where
n ∑ M (T ) i i, j i, j =0
is the combine probabil-
ity mass of the independent intrusion detection systems. P ({T / S }) is the probability of the test i, j i, j positive given ith threat of the jth intrusion detection system. That is the percentage of the detection accuracy by each Intrusion Detection Systems. MARS, Sniffers, Snoop and Wireshark detection accuracy is 95%, 80%, 75% and 80% respectively. P (T ) is the probability of the ith threat i, j observed by the jth intrusion Detection systems. As the numerical figures about accuracy of the Intrusion Detection Systems are not available in any literature, therefore, these values are purely on assumptions based on the detection accuracy in this experiment. However, it is strongly proposed if any reliable numerical figures become available, other workers must use those values to get better detection accuracy of their GEP identity fusion model. Putting the above values in the combined probability mass formula equation (12) M
1,2
(T ) 1,2
= 0.490870599
M
1,2
(T ) 1,2
is the combined probability mass
of the threat 1 and 2 assigned by intrusion detection system 1 and 2. M 1,2, 3
(T ) 1,2, 3
M
= 0.581137264
(32)
(T ) is the combined probabil1, 2, 3 1, 2, 3
ity mass of the threat 1, 2 and 3 assigned by intrusion detection system 1, 2 and 3. Similarly the probability mass of the 4 intrusion detection system would be: M
(T ) = 0.62337544 1, 2, 3, 4 1, 2, 3, 4 (33) M (T ) is the combined prob1,2,3,4 1,2,3,4
ability mass of the threat 1, 2, 3 and 4 assigned by intrusion detection system 1, 2, 3 and 4.
5.7 Threat Results Based on Dempster Shafer Theory of Inference After Set Cover data fusion we had a total of 295 threats (Table 1). This threat data is now further processed by the next part of the multiple simultaneous threat detection system that is Dempster Shafer as shown in Figure 1. In order to increase the precision of each threat was passed through multiple hypotheses testing as proposed in sec 5.3. The intrusion detection system classified the Dempster Shafer inferences into 4 types. Observed threats, Observed Alerts, Detected Alerts and Real Alerts that helped in determining the real threat detection and false positive rates. The final results of this part of the fusion have been given in Table 2. False Positive rates are determined using the formula:
(31)
Copyright © 2010, IGI Global. Copying or distributing in print or electronic forms without written permission of IGI Global is prohibited.
International Journal of Web Portals, 2(2), 51-67, April-June 2010 63
Table 2. Threat results based on Dempster Shafer theory of inference Threat Observations by the Threat Detection System Using Dempster Shafer IDS
OT
OA
DA
RA
FPR
Detect Rate
MARS
51
23
31
17
26
60.78431
Sniffers
33
19
21
9
53
63.63636
Snoop
13
7
7
5
29
53.84615
Wireshark
26
12
12
9
25
46.15385
Total
123
61
71
40
False Positive Rates = Re al Alerts * 100
1-
(34)
Observerd Alerts And Threat Detection rate is calculated using the equation: Threat Detection Rate = Detected Alerts * 100
(35)
Observerd Threats Where OT stands for Observed Threats, OA for observed Alerts, DA for Detected Alerts, RA for Real Alerts, FPR for False Positive Rate
5.8 Threat Results Based on Extended Dempster Shafer Theory of Inference Just like the Dempster Shafer inference, 295 threats data analysed by the Extended Dempster Shafer inference and Intrusion Detection System then grouped as given in Table 3. It is obvious that real alerts have gone up from 40 to 53 that is a significant indication that False Positive Rates have reduced as compared to Dempster Shafer. Likewise there is an obvious improvement in threat detection rate as well.
5.9 Threat Results based on Generalized Evidential Processing GEP has certainly improved the detection rats of almost all of the intrusion detection systems. MARS detection and false positive rates showed the perfection of GEP model as a perfect fusion identity model at decision level. However, other 3 Intrusion Detection Systems (Sniffers, Snoop and Wireshark have also shown significant improvement in threat detection and there is a considerable drop in false positive rates as well (Table 4).
5.10 Performance of the Multiple Simultaneous Threat Detection System The multiple simultaneous threat detection system is a multi-sensor data fusion system. Its major components statistical and mathematical techniques set covers, Dempster Shafer, extension Dempster Shafer and GEP are the main data processing cores and heart of the data processing unit for the system. The larger the number of sensors the greater should be the accuracy and precision in the results. Although Bayesian and Dempster Shafer provide best processing model in multi-sensor data fusion but involve too much complex iteration of the data fusion process in terms of its probability mass and weight calculations. Therefore, in real life, it would be a very hard task to use Bayesian and DS model for combining probability masses of an experiment having a more than
Copyright © 2010, IGI Global. Copying or distributing in print or electronic forms without written permission of IGI Global is prohibited.
64 International Journal of Web Portals, 2(2), 51-67, April-June 2010
Table 3. Threat results based on extended Dempster Shafer theory of inference Threat Observations by the Threat Detection System Using Extended Dempster Shafer IDS
OT
OA
DA
RA
FPR
Detect Rate
MARS
33
19
31
18
5.3
93.93939
Sniffers
28
21
26
18
14
92.85714
Snoop
22
9
14
8
11
63.63636
Wireshark
17
10
12
9
10
70.58824
Total
100
59
83
53
Table 4. Threat results based on generalized evidential processing Threat Observations by the Threat Detection System Using Generalized Evidential Processing IDS
OT
OA
DA
RA
FPR
Detect Rate
MARS
31
19
31
19
0
100
Sniffers
28
20
26
19
5
92.85714286
Snoop
15
10
14
9
10
93.33333333
Wireshark
18
10
17
9
10
94.44444444
Total
92
59
88
56
four sensors, particularly in case of overlapping and conflicting propositions. The greater the number of sensors, larger would be precision in threat detection, that’s why I’m looking into possibility of using more than 4 sensors in our next step. In our experiment, we performed experiment in three steps using evidences of 2nd, 3rd and then 4th sensors (intrusion detection systems) to the 4 type of threats. The sensors were 4 intrusion detection systems. We compared their results and have proved the obvious fact that the combined results of the 4 sensors have improved threat detection significantly. Bayesian, Dempster Shafer and GEP theory of inferences provided us tools to combine evidences of these sensors and measure the uncertainty of a hypothesis or to gain better confidence in the combined probability measurements to the evidences or propositions. The following are the graphs drawn in Microsoft Excel to display the results of mul-
tiple simultaneous threat detection system. Comparing efficiency of the Dempster Shafer and Extended Dempster Shafer data fusion techniques, Figures 2 and 3 show a significant increase in the combined probability masses in case of Extended Dempster Shafer Theory. That is a good indication of enhanced precision, accuracy and better performance of GEP data fusion in threat detection over the Dempster Shafer Data fusion techniques. The average combined probability mass for threat detection by three methods; Dempster Shafer, Extended Dempster Shafer and GEP were 6%, 41% and 53% respectively. That clearly shows GEP as a most effective method which increased combined probability mass by 47%. General principle is that higher the probability mass greater would be the precision in threat detection.
Copyright © 2010, IGI Global. Copying or distributing in print or electronic forms without written permission of IGI Global is prohibited.
International Journal of Web Portals, 2(2), 51-67, April-June 2010 65
Figure 2. Performance of the multiple simultaneous threat detection system
Figure 3. Effectiveness of the multiple simultaneous threat detection system
6. CONCLUSION The empirical experiment of multiple simultaneous threat detection system proved that the hybrid model had significant increase in precision in threat detection. Dempster Shafer inference produced 33% detection rate whilst extended Dempster Shafer and GEP had 80% and 95% detection rate. So on an average, multiple simultaneous threat detection System
increased 39% detection rate. The false positive rate also went down from 33% to 6%. (Detection rate is calculated by dividing detected alerts by observed alerts and false positive rate is derived by dividing real alerts by observed alerts.) Thus there was a net improvement of 27% in getting rid of false positive alarms and that is a significant achievement. Another edge of the GEP over Dempster Shafer and Extended Dempster Shafer was
Copyright © 2010, IGI Global. Copying or distributing in print or electronic forms without written permission of IGI Global is prohibited.
66 International Journal of Web Portals, 2(2), 51-67, April-June 2010
its better performance based on its high value of the combined evidential / probability mass assigned by the 4 different Intrusion Detection systems. The combined probability mass of the GEP was 0.49 whilst Dempster Shafer and Extended Dempster Shafer had 0.06 and 0.40. GEP increased combined probability mass by 15% which in turn increased the overall efficiency of our simultaneous Multiple Threat Detection System. Set Cover as a middle tier data fusion tool produced incredible results, particularly in data grouping that amazingly minimise the computational processing cpu and memory overhead cost and time. Set Cover reduce data population (from 2274 to 295) to the level that it became possible to detect more than 2 simultaneous threats with less computational efforts whist that was almost impossible with the existing threat detection approaches and others that used Bayesian and Dempster Shafer. Set Cover also determined the cost effectiveness of choosing a computer node for the multiple simultaneous threat detection system. Thus the Set cover played a vital role to assist multiple simultaneous threat detection system to improve its ability to increase precision and making numerical calculations relatively easier for the multiple simultaneous threat detection system. Looking into the results, it is obvious that results of experiment has proven that the proposed threat detection system “multiple simultaneous threat detection system” remained successful to achieve our research goals. In order to improve precision of threat detection, as a next step of our research, the main task we are planning is to implement weighted version of Generalized Evidential Processing (GEP) if possible. Plus also apply international standards for the test accuracy of the 4 sensors that we used in our experiment. GEP is an extension of the Bayesian and Dempster Shafer theory that presents a better evidential combination and separate propositions and the decisions. Therefore each proposition or set of propositions can be tested and analysed separately at different levels of the data. In addition
to that we will focus to improve the quality of the test experiment and write the final thesis.
ACKNOWLEDGMENT We would like to thank Dr. Paul Kwan (our principal supervisor) for his suggestion on the initial research direction and his valuable comments on how to structure this paper.
REFERENCES Aickelin, U. (2002). An Indirect Genetic Algorithm for Set Covering Problems. The Journal of the Operational Research Society, 53(10), 1118–1126. doi:10.1057/ palgrave.jors.2601317 Bass, T., & Gruber, D. (2005, August 18). A glimpse into the future of id. Usenix. Retrieved from http:// www.usenix.org/publications/login/1999-9/features/ future.html Bendjebbour, A., & Delignon, Y. (2001, August). Multisensor Image Segmentation Using Dempster-Shafer Fusion in Markov Fields Context. IEEE Transaction on GeoScience and Remote Sensing, 39(8), 1–10. doi:10.1109/36.942557 Boston, J. R. (2000, February). A Signal Detection System Based on Dempster-Shafer Theory and Comparison to Fuzzy Detection. IEEE Transactions on Systems, Man and Cybernetics. Part C, Applications and Reviews, 30(1), 45–51. doi:10.1109/5326.827453 Braun, J. (2000). Dempster-Shafer theory and Bayesian reasoning in multisensor data fusion, Sensor Fusion: Architectures, Algorithms and Applications IV. Proceedings of the Society for Photo-Instrumentation Engineers, 4051, 255–266. Brugger, S. T. (2004). Data Mining for Network Intrusion Detection (pp. 8-55). Retrieved from www. bruggerink.com/~zow/papers/dmnid_qualpres.pdf Burroughs, J., Wilson, L. F., & George, V. (2002). Analysis of Distributed Intrusion Detection Systems Using Bayesian Methods. Paper presented at IPCCC 2002 (pp. 142-147). Chatzigiannakis, V., Lenis, A., Siaterlis, C., Grammatikou, M., Kalogeras, D., Papavassiliou, S., & Maglaris, V. (2002). Distributed Network Monitoring and anomaly Detection as a Grid Application (pp. 1-13).
Copyright © 2010, IGI Global. Copying or distributing in print or electronic forms without written permission of IGI Global is prohibited.
International Journal of Web Portals, 2(2), 51-67, April-June 2010 67
Computer Society Institute. (2002, April). Cyber crime bleeds U.S. corporations, survey shows. Retrieved January 16, 2003, from http://www.gocsi. com/press/20020407.html
Ma, B. (2001). Parametric and Non Parametric Approaches for Multisensor Data Fusion (pp. 1-212). Unpublished PhD thesis, University Of Michigan, Michigan.
Dong, & Deborah. (2005). Alert Confidence Fusion in Intrusion Detection Systems with Extended DempsterShafer Theory (pp. 142-147). New York: ACM.
Ning, P., Xu, D., Healey, C., & Amant, R. (2004). Building Attack Scenarios through Integration of Complementary Alert Correlation Methods. In Proceedings of the 11th Annual Network and Distributed System Security Symposium (pp. 97-111).
Gorodetski, V., Karsaev, O., Kotenko, I., & Khabalov, A. (2002). Software Development Kit for Multi-agent Systems Design and Implementation. In B. DuninKeplicz & E. Nawareski (Eds.), From Theory to Practice in Multi- agent Systems (LNAI 2296, pp. 121-130). New York: Springer Verlag. Grocholsky, B., Makarenko, A., & Durrant-Whyte, H. F. (2003). Information-theoretic coordinated control of multiple sensor platforms (pp. 1521–1526). ICRA. Habib, A., Hefeeda, M., & Bhargava, B. (2003). Detecting service violations and DoS attacks. In Proceedings of the NDSS Conference (pp. 439-446). Reston, VA: Internet Society. Hall, D. (1992). Mathematical Techniques in Multisensor Data Fusion (pp. 99–105). Norwood, MA: Artech House. Hugh, F. (2005). Durrant-Whyte: Data fusion in sensor networks (pp. 545–565). IPSN. Klein, L. A. (1999). Sensor and Data Fusion Concepts and Applications (2nd ed., pp. 1-252). Melville, NY: SPIE Optical Engineering Press. ISBN 0-8194-3231-8 Koks, D., & Challa, S. (2005). An Introduction to Bayesian and Dempster-Shefer Data Fusion (pp. 1-52)
Rehman, R. (2003). Intrusion Detection System with SNORT (pp. 1-288). Retrieved from http:// www.snort.org/ Siaterlis, C., & Maglaris, B. (2004). Towards Multisensor Data Fusion for DoS detection. In Proceedings of the 2004 ACM symposium on Applied Computing (pp. 1-8). Spafford, E. H. (1991). The Internet worm incident (Tech. Rep. No. CSD-TR-933). West Lafayette, IN: Purdue University, Department of Computer Science. LEM OS, R. (1991). Counting the cost of slammer (pp. 1-19). Sultan, Z. (2009). Multiple Simultaneous Threat detection System in UNIX. IJCSNS, 9(1), 56–66. Wu, H., Siegel, M., Stiefelhagen, R., & Yang, J. (2002). Sensor fusion using Dempster-Shafer theory. In Proceedings of IEEE Instrumentation and Measurement Technology Conference, Anchorage, AK (pp. 1-6). Zamboni, D. (2000, October). Doing intrusion detection using embedded sensors (Tech. Rep. No. 2000-21, pp. 1-9). West Lafayette, IN: Purdue University, CERIAS.
Kumar, K. S. (2000). Intrusion Detection and Analysis. Vancouver, Canada: University of British Columbia.
Copyright © 2010, IGI Global. Copying or distributing in print or electronic forms without written permission of IGI Global is prohibited.