Available online at www.sciencedirect.com
Procedia Social and Behavioral Sciences 15 (2011) 3084–3094
WCES-2011
Generating a scale measuring hierarchy of basic needs Yadolla Saeedniaa * a
University of Malaya, Kual Lumpur 50603, Malaysia
Abstract Although some instruments have been provided to measure needs in Maslow’s hierarchy, most of them either deal exclusively with one component or they do not measure all of the five basic needs. This study aims to develop a reliable scale measuring basic-needs-satisfaction for young children. An exploratory mixed methods design was used for this purpose. 13 subjects were interviewed and a scale was constructed based on the outcomes. The scale was administrated with 300 subjects. It is found that the scale to be a reliable and relatively valid scale to measure basic-needs- satisfaction among children. © 2011 Published by Elsevier Ltd. Open access under CC BY-NC-ND license. Keywords: Mazlow; Basic-Needs-Satisfaction; Scale; Hierarchy; Children;
1. Introduction Maslow’s theory is an influential theory which has affected majority of psychology fields among education (Lyon, 1971). While critics have decried the absence of empirical support for his theory, Maslow’s ideas have led to studies which reflect the higher-order needs of human beings (Roming & Cleland, 1972; Huitt, 2001). His work underlies most humanistic educational movements and provides philosophical and psychological frameworks for new paradigms in education (Lyon, 1971). Wlodkowski (1984) believed that Maslow’s theory is the most holistic and dynamic one which offers the best guidelines to explain student motivation. Resources’ investigation indicates the application of Maslow’s hierarchy in management (Altman & Pratt, 1999; Herrington, 2004; Hoffman, 1988; Leideker & Hall, 1974; Lefkowitz, Somers, & Weinberg, 1984; Zemke, 1998). Applying Maslow’s theory in education is less than in management. Many recent researchers (Charles, 1989; Dick, 2001; Griffith, 1999; Norwood, 2004; Rivero, 2002, 2002b; Zimmerman, 2002a, 2002b) have done scientific works either directly about Maslow’s theory or its application in education. The power of Maslow’s theory mainly comes from its accurate description of human motivation (Marshall, 2002). Much of the research on motivation from 1930 to 1970, according to Small (1998), took place in the field of industrial psychology. Just during last decades of 20th century, research studies (Wlodkowski, 1981) shifted to the relationship between motivation and learning, for example see “ARC Model” (Keller, 1979) and “The Continuum
* Yadolla Saeednia. Tel.: +98-912-1354069; +60-14-3642541. E-mail address:
[email protected].
1877–0428 © 2011 Published by Elsevier Ltd. Open access under CC BY-NC-ND license. doi:10.1016/j.sbspro.2011.04.250
Yadolla Saeednia / Procedia Social and Behavioral Sciences 15 (2011) 3084–3094
3085
Model” (Wlodkowski, 1981). Within this new tendency, Maslow’s theory has the least contribution, whereas the hierarchy of basic needs seems to be the most powerful instrument to describe human motivation. Despite to the contribution of Maslow’s theory in psychology, there are not many attempts to construct standard scales for measuring basic-needs-satisfaction. Although some instruments have been provided to measure needs in Maslow’s hierarchy, according to Goebel and Brown (1981) most of them “either deal exclusively with one component … or they don’t measure all of the five basic needs” and they are age population restricted (p. 810). According to Gowan (1974) most and best attempt to construct scales regarding basic needs, concerns to Shostrom. Gowan stated: “He [Shostrom, 1966] called his test The Personal Orientation Inventory often referred to as the P.O.I. Maslow (1967) gave P.O.I. a strong vote of confidence when he stated ‘There is today a standardized test of self-actualization (P.O.I.). Self-actualization can now be defined quite operationally, as intelligence used to be defined, i.e., self-actualization is what the test (P.O.I) tests’” (p. 144 - 145). Beside of above efforts, however, the variable of this study (basic-needs-satisfaction) apparently has not been considered to be measured – at least author of this research couldn’t find. It is important to notice that basic-needssatisfaction as is defined in this study is different with measuring self-actualization as P.O.I. does and with measuring all basic needs as what Goebel and Brown (1981) have done. Measuring basic-needs-satisfaction means measuring how much individual is satisfied in terms of basic needs. As Goebel and Brown (1981) claimed, Maslow’s theory “suffers from vagueness of concept and looseness in language and because of the nature of the theory, defies empirical testing” (p. 811). Therefore, mainly this study chose to study basic-needs-satisfaction in a qualitative way and simultaneously would try to construct a scale based on qualitative outcomes. The purpose of this study is to construct a reliable and valid scale measuring basic-needs-satisfaction among young children.
2. Bachground According to Cofer and Appley (1964, p. 692, cited in Goebel & Brown, 1981, p. 811), Maslow’s theory suffers from lack of operational definitions. Lack of empirical evidence for his theory might be the reason that his theory somehow left behind. There are a few efforts with regard to measuring basic needs. Brown (1976, cited in Goebel & Brown, 1981) designed a scale to study the differences in need levels across a wide age range of working and nonworking professionally trained women. Goebel and Brown (1981) developed a new scale based on Brown’s scale and called it Life Motivation Scale. It uses a series of five statements, including descriptive terms from Maslow's writings, to represent the five need levels (physiological, safety, love, esteem, and self-actualization) for each of 11 life components (friends, free time, money, child rearing, family, activities, domicile, job, school, government, and health).
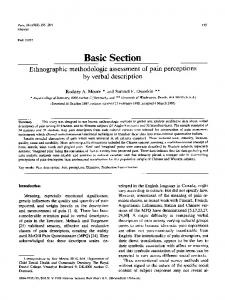
3. Methodology An exploratory mixed methods design was used for this study. As Creswell (2005) recommends, mixed method would be used when “you may want to first explore the data qualitatively to develop an instrument or to identify variables to test in a later quantitative study” (p. 510). This study attempted to explore data about basic-needssatisfaction by interviewing with subjects (Ss), their parents, and their educators, to develop an instrument for it. This design is schemed (Figure 1) as follow:
3086
Yadolla Saeednia / Procedia Social and Behavioral Sciences 15 (2011) 3084–3094
QUAL Data/ Results
Building
qual Data/ Results
Figure 1: Exploratory mixed methods design for basic-needs-satisfaction Note. From Creswell (2005, p. 514)
Instruments: Main instrument of this study was open-ended interview which was employed for the qualitative section of data collection. Ss, their parents, and their educators were interviewed regarding basic-needs-satisfaction. Data Collection: The interviews were open-ended. The first objective of these interviews was to explore the quality of basic-needs-satisfaction. The themes that have been investigated were: 1. Family climate; how supportive the family is 2. Openness of the family to child’s independence 3. Subjects’ desires, wishes, interests 4. Subjects’ leisure activities Population: A total of 13 children, their parents, and their educators were interviewed. The quantity of subjects in term of their grade, sex, and school are presented in Table 1: Table 1: Numbers of Subjects were interviewed School Name Mizan Velayat Noora Ejtemaee Total Grand Total
Grade 3 4 1
Male Grade 4 3
Grade 5
Grade 3
Grade 5
1 1
5
Female Grade 4
1
3 1 1 1 9 4 Note. Since 3 interviews were performed for every S, the numbers of interviews were 39.
1 1 2
Three interviews had to be performed for every S. The interviews were recorded with permission of interviewee. After the interviews were completed, they were listened first and in second round they were written down. Triangulation of the data allowed the aspects that had been censored by pupil or parents were revealed by educators and the misunderstandings of educators were covered by parents and subjects and so on. Data Analysis: Responses to interviews were analyzed on the basis of theoretical framework given as follow: 5. “The emergence of a new need is not a sudden, but rather a slow degree from nothing” (Maslow, 1970, p. 54). Therefore it was expected that subject’s responses involve more than one basic need, nonetheless dominated in one need. 6. “A satisfied need is not a motivator” (Maslow, 1970, p. 57). Therefore if there was no sign of lower basic needs it was meant that need was already satisfied. 7. A person who is satisfied in a particular need may not motivate with that need “except in stray moments of quickly passing threat” (Maslow, 1970, p. 57). Attention was paid to avoid considering such “passing threat” as actual permanent needs. Based on the qualitative collected data and the theoretical framework of this study, it was tried to find out the investigated themes which were mentioned in "Data Collection" section. Based on these themes and findings a questionnaire was constructed which was supposed to be able to present the extent that basic-needs are satisfied. This constructed questionnaire called Basic-Needs-Satisfaction Scale (BNSS).
3087
Yadolla Saeednia / Procedia Social and Behavioral Sciences 15 (2011) 3084–3094
BNSS Construction: This questionnaire was constructed originally in Persian. An English version is also provided for foreign readers (Appendix A). Although it was supposed to measure the five traditional sets of basic needs, as an extra purpose, one other sets of needs was added. Some researchers suggest that the Maslow's hierarchy of basic needs may include more than five basic needs. For instance research suggests that Maslow has added needs to know and to understand to basic needs (for more discussion, refer to Saeednia, 2009). It was intended to investigate the notion that claims the need to know and to understand is a basic need. The number of items of BNSS that measure every need is as follow (Table 2): Table 2: The Quantity of Items from BNSS Measuring every Need Need
Quantity of Items in BNSS
Physiological Needs (P) Safety Needs (S) Love and Belongings Needs (LB) Esteem Needs (E) Self-Actualization Needs (SA) The Needs to Know and to Understand (N)
10 15 13 16 5 9
Total
68
Pilot Study: In the first administration of BNSS with 89 subjects, the Alpha Chronbach of reliability was estimated at .836 which is superb. These subjects were not included in the main sample. Total number of items were 70, however there were two questions regarding brother and two regarding sister. Some subjects got no brothers or sisters; some got only brother and some only sister. Therefore, the four items were reduced to two by averaging the two relevant items. For the subjects who got neither brother nor sister, the value was replaced based on whole grade average. Thus, the total effective items in the test decreased to 68. 52 items were positive and 16 items were negative. Negative scores were converted before analysis. Each statement were ranked by subjects from 1 to 4, indicating "nothing, a little, somewhat, and a lot". A total of 272 points were affordable for this questionnaire. 4. Findings Reliability and Validity of BNSS: To make the sample more valid as a representative of the population, the instruments were administrated to 540 Ss. Then, after removing unusable ones, 300 were selected randomly from 457 ones. The demography of subjects is shown in Table 3. Table 3: Quantitative Sample Demography Sex M 155
145
Stand F
3 74
4
School 5
120 104
Brother-Sister
M
V
N
106
49
87
I
1 58
2 37
3 109
4 112
42
Note. M: Male; F: Female; M: Mizan School; V: Velayat School; N: Noora School; I: Isar School. The number in Brother-Sister section means: 1: no brother or sister; 2: only brother; 3 only sister; 4: both brother and sister.
Data were provided after converting the negative items and entered to SPSS ed.16 software. For most of analysis, it was necessary to replace missing values. Therefore two sets of data computed. One set was raw data and second
3088
Yadolla Saeednia / Procedia Social and Behavioral Sciences 15 (2011) 3084–3094
one the data with replaced missing values. Within following analysis, mostly the second data were used unless it is mentioned. Table 4 includes the available score, maximum and minimum scores gained, range of variety, Standard Deviations (SD), and the mean of BNSS test as well as its sub-scales. All values have been rounded to 2 decimals. This table includes raw data. Table 4: Statistics of BNSS and its Sub-Scales- Raw Data Need
Affordable
max
BNSS P S LB E N SA
272 40 60 52 64 36 20
259 40 60 52 64 36 20
min
Range
191 25 28 32 39 23 5
SD
68 15 32 19.5 25 13 16
Mean
13.36 3.11 5.54 3.43 4.79 2.79 2.88
233.03 35.10 47.83 46.9 55.20 31.77 17.04
Note. P: Physiological Needs; S: Safety Needs; LB: Love & Belonging Needs; E: Esteem Needs; SA: Self-Actualization; N: Needs to Know
The Cronbach's Alpha coefficient of BNSS estimated as .773 (valid numbers: 140). This coefficient was increased to .792 (valid numbers: 300) when the raw data were used. Chronbach's Alpha based on standardized items is estimated at .839 (valid numbers: 300). Reliability of sub-scales is shown in Table 5: Table 5: Sub-Scales Reliabilities of BNSS Need
P
S
LB
E
SA
N
Cronbach
.483
.649
.426
.635
.648
.430
Note. P: Physiological Needs; S: Safety Needs; LB: Love & Belonging Needs; E: Esteem Needs; SA: Self-Actualization; N: Needs to Know
Pearson Correlation coefficient between total score of BNSS and its items were all positive varied from .015 for item 22 to .475 for item 31. All correlations were significance at .01 confidences except items 6, 21, and 50 which were significance at .05 confidences. The correlation in the following items was not significant: 22, 27, 36, 37, and 48. Correlations between main scale BNSS and its sub-scales are presented in Table 6. Table 6: Correlations between BNSS Scores and its Sub-Scales N=300
BNSS P
BNSS
P
.649* .000
S
LB
E
SA
.557* .000 .263* .000
.579* .000 .276* .000 .155* .000
.748* .000 .421* .000 .205* .000 .293* .000
.442* .000 .254* .000 -.063 .274 .239* .000 .347* .000
S LB E SA
N
.510* .000 .152* .000 -.086 .135 .183* .001 .276* .000 .386* .000
* Correlation is significant at the .001 level (2 tailed).
Considering that correlation coefficients between BNSS and its sub-scales are all greater than all correlations coefficients between the sub-scales themselves, it indicates that sub-scales may present more independence.
Yadolla Saeednia / Procedia Social and Behavioral Sciences 15 (2011) 3084–3094
3089
Moreover, these coefficients are less than any coefficients come from some random scale that has been chosen from BNSS and BNSS itself (it was verified by some examples). Correlation between every sub-scale namely P, S, LB, E, SA, and N needs and their items could present the extent that sub-scales are internally coherent and emphasize the independences of needs. All correlations between sub-scales of BNSS and their items were significant at .01 except item 62 from Safety sub-scale, which was .137 and the items 6 and 36 from Love and Belonging sub-scale, which were .141 and .130 – still significance at .05.
5. Conclusion Qualitative Approach Preference: it is found that qualitative approach is preferable for researching Maslow's theory. The strategy of using mixed method in this study has borne a major conclusion, which was that qualitative approach is much more effective to find out peoples' desires, to analyze the people's needs, and to appraise Maslow's notions. Of the other reason for preference of using qualitative approach is that Subjects' responses are some time unconsciously pretending. Maslow's theory explains why people do this. When an individual is in a salient need stage – especially when the environment does not support him to fulfill the need – whole of him desires that need, that is, he will intend to get gratification from any function even that function is not appropriate with the need (see Maslow, 1970, pages 37 -38). ZP (of interviewees) was claiming that she has lots of confidence, however in fact the whole of her organism was striving to fulfill her safety needs and attract other's attention. This is an example to prove that why questionnaire would not be able to present Subject's real needs completely. Obviously, ZP is not conscious of what is she doing and for what, therefore as she was showing off that she is a future oriented, she would agree with the concerning statements in test. Quantitative Approach Points: beside the disadvantages that have been mentioned above for quantitative approach, there are other points that should be considered while the conclusions are interpreted. The first point is that the interviews revealed that there was no deficiency in basic physiological needs within cases; therefore the concerning items did not included in BNSS. The most items that represent P needs (Strong & Fiebert, 1985) are not included, because they could affect the goal of estimating the amount of whole satisfied basic needs. Since Tehran is a wealthy region in Iran, it is reasonable to conclude that within the population of this study the basic physiological needs are satisfied. Thus, it must be considered that low level of P needs would not appear in results; however during the interpretation it should be counted. The other point is that BNSS includes only the items about SA need that could have a meaning for children of age 9-11. This means what exactly is meant by self-actualization have not been asked completely. So it is not true to claim that Subjects are actualized rather the amount that has been assumed to be possible to be emerged within the Subjects of this study is put in test. This point implies that the score of SA in this study would present more than what is in fact. Validity: BNSS could be known as a valid scale to measure the extent of satisfaction of basic needs, because it has satisfactory internal consistency reliability (.84). The sub-scales also are internally consistent (P = .48, S = 65, LB, .43, E = .63, SA = .65, and N= .43). This scale covers the needs that ages 9-11 may relatively lack or gratified and not includes the needs that totally satisfied or ever not emerged. Also because sub-scales of BNSS present coherence since their (1) reliability is high, (2) inter items are positive, (3) and correlation between sub-scales and BNSS is higher than correlation between the sub-scales and is higher than correlation between BNSS and any random selected sub-scale (see the Table 24 and the sub explanations of it). Validity of BNSS also comes from its relying to the qualitative study. The items of BNSS have been selected from the analysis of interviews outcomes. That is, in-depth interviews were run to reveal (1) what are the subjects'
3090
Yadolla Saeednia / Procedia Social and Behavioral Sciences 15 (2011) 3084–3094
needs, (2) what are the ways that subjects express their needs, and (3) what are the items that subjects believe that their needs would be met by. Beside above points, the findings of this study also revealed some weaknesses for BNSS. Since it is the first trial of using BNSS, it is expected and the further researches is recommended to improve this scale using the findings of this study. The weaknesses of BNSS include items that are not correlated with BNSS and items with less correlation with sub-scales (basic needs sets). Further analysis could be made by determination the difficulty coefficients, which have not been done in this study to avoid over detailing, and using the results to improve the scale. Below some specific points for each set of needs are provided: S Needs: S sub-scale with the max internal consistency (very close to SA) and appearing as an independent factor could be a representative sub-scale for safety. LB Needs: Three items of LB (36, 37, and 48) had not significant correlation with total BNSS scores. Correlation between item 36 and LB scores was a bit weak (sig. = .024) compare to others. Revising the items of LB showed that apparently the aspect of belongingness is not covered by its items adequately. In addition this sub-scale does not possess strong internal coherency (.426). P Needs: Item 13 with mean 2.95 and item 20 with mean 3.11 were the minimum means in P sub-scale. Item 13 is "I have time to play" and item 20 is "I go to funny places". The fact of not including the low level P needs which is emphasized in Strong and Fiebert (1985), causes that P scores less than LB probably. Nevertheless, this result implies subjects' needs in leisure and play needs to be admired. Qualitative data, on the other hand, confirmed that subjects demand more free time to play. Perhaps this demand -- based on interviews' analysis -- could be translated as a need to have free time to decide to do something one their own decision. E Needs: E items are representative and the validity of this sub-scale is higher than others. E needs data have the most correlation with BNSS, although the reliability of it is lower than S and SA sub-scales. Item 31 which is one's perceive from other's view to him is the best representative of esteem within individual, since the correlation between this item and total E scores is highest. In contrast, item 4 which is one's belief to be able to do his own works is the least representative of esteem, since its correlation with E scores is the lowest. Although the item 4 (above) is the least representative of esteem, subjects score more in this item than other items of E needs. Moreover, subjects' least score is in item 40, which is "I can tell my parents what I want to buy". SA Needs: SA sub-scale possesses considerable internal consistency (.648). Although the test was built based on least SA that was considerable in children ages 9-11, the scores was satisfactory. In agreement with the qualitative result, being future orientation ("I think about my future job ") was the most correlated concept to SA scores. It was found from interviews as well that those who have a clear wish-job about future and therefore they are future oriented, most likely are in esteem and self-actualization stages. Above item (item 38) scores the maximum within SA items as well. N Needs: this sub-scale has no adequate internal consistency- same as P. The mean of N was close to LB and P needs, which was surprising. The findings of this study could be employed to revise the items to improve this subscale. Cultural Component: Maslow (1970) has believed that basic needs are the ultimate goal of organization. He emphasized to this notion in his last interview (Hoffman, January-February, 1992). Assuming that BNSS is an indicator of life satisfaction, findings of this study show that esteem is more associated with life satisfaction, ). This finding is in agreement with because the correlation between E and BNSS is more than other needs ( Oishi, Diener, Lucas, and Suh's (1999) finding. They stated "satisfaction with higher needs, such as love and esteem needs, tended to be stronger predictors of life satisfaction in wealthy nations" (p. 988). These authors explained that "When individuals’ lower needs are met, on the other hand, their life satisfaction is better predicted from satisfaction with higher needs such as love and esteem needs" (Oishi, Diener, Lucas & Suh, 1999, p. 988). They also believe that in poorer nations life satisfaction tends to be more associated with safety. Their findings are in consistent with Maslow’s theory.
Yadolla Saeednia / Procedia Social and Behavioral Sciences 15 (2011) 3084–3094
3091
Generality of the Results: Tehran is the capital city. Families are wealthy. The status of families in term of wealth is comparable with wealthy countries. Therefore, the results could be generalized to regions and countries with same status. In contrast, the results are not extendable to rural regions of Iran. Further Recommendations: BNSS, despite its usefulness, since it is its first trial, includes weaknesses. The further researches are recommended to improve this scale, using the findings of this study. Delimitations: Subjects were selected from Tehran, the capital city of Iran. The results are not easy to generalized to overall of Iran or worldwide, although the theoretical frameworks are not cultural oriented especially Maslow’ theory. In fact, Maslow maintained that his hierarchy of basic needs is cultural free; however there are rare researches with this regard. Although these rare researches do not support sufficient evidences for this premise, the minority of the researches do not allow either accepting or rejecting it. Therefore this study has chosen to limit the results to children of Tehran. Limitation: Most important limitation of this study might be the age of subjects. Although this study attempted to triangulate the data through collecting from three sources: subjects, parents, and educators; the limited ability of children to express themselves might affect the accuracy of data and sequentially the results. References Altman, E., & Pratt, A. (1999). Maslow on Management. Journal of Academic Librarianship, 25(1), 68+. Charles, J. F. (1989). The Impact of Abraham Harold Maslow on Educational Leadership. University of Miami, 220 pages; AAT 9017543. Creswell, J.W., (2005). Educational Research: Planning, Conducting, and Evaluating Quantitative and Qualitative Research (2nd ed.). New Jersey: Pearson/Merrill Prentice Hall, 2005. Dick, B. (2001). Maslow Revis(it)ed: Maslow’s Hierarchy of Needs Examined and Reformulated. [Electronic file]. Retrieved Jul. 08, 2007, from http://www.uq.net.au/~zzbdick/dlitt/DLitt_P02masrev.pdf. A discussion paper, originally written in the 1980s, revised 1990, 1993, this version, 2001. Goebel, B. L. and Brown, D. R. (1981). Age Differences in Motivation Related to Maslow's Need Hierarchy. Developmental Psychology, 17(6), 809-815. Retrieved Aug. 09, 2007 from http://web.ebscohost.com/ehost/pdf?vid=5&hid=14&sid=92f65b35-6a4f-4d23-b98895952a3962ac%40sessionmgr2 Gowan, J. C. (1974). Development of the Psychedelic Individual. Retrieved Apr. 17, 2007 from: http://www.csun.edu/edpsy/Gowan/chpt4.0p.html. Griffith, M. (1999). The Un-Schooling Handbook. Rocklin, CA: Prima Publishing. Herrington, A. (2004). Maslow's Hierarchy, Societal Change and the Knowledge Worker Revolution. Retrieved Dec. 09, 2006, from http://www.pateo.com/article6.html. Hoffman, E. (January-February, 1992). The Last Interview of Abraham Maslow. Psychology Today. 25(1), p. 68+. Retrieved from www.questia.com. Hoffman, E. (1988). Abraham Maslow: Father of Enlightened Management. Training, 25(9), 79-83. Huitt, W. (2001). Motivation to Learn: An Overview. Educational Psychology Interactive. Valdosta, GA: Valdosta State University. Retrieved Dec. 15, 2006 from: http://chiron.valdosta.edu/whuitt/col/motivation/motivate.html. Keller, J. M. (1979). Motivation and Instructional Design: A Theoretical Perspective. Journal of Instructional Development, 2(4), 26–34. Lefkowitz, J., Somers, M. J., & Weinberg, K. (1984). The Role of Need Level and/or Need Salience as Moderators of the Relationship between Need Satisfaction and Work Alienation- Involvement. Journal of Vocational Behavior, 24(2), 142- 158. Leideker, J. K. & Hall, J. J. (1974). Motivation Good Theory-- Poor Application. Training and Development Journal, 28(6), 3. Lyon, H. C. (1971). Learning to Feel – Feeling to Learn: Humanistic Education for the Whole Man. Maslow, A. H. (1967). A Theory of Meta-Motivation: The Biological Rooting of the Value Life. Journal of Humanistic Psychology, 7(2), 93-127. Maslow, A. H. (1970). Motivation and Personality (2nd ed.). New York: Harper & Row. Norwood, G. (2004). Deepermind: Maslow’s Hierarchy of Needs. Retrieved Oct. 01, 2006, from http://www.deepermind.com/20maslow.htm. Oishi, S, Diener, E. F, Lucas, R. E, & Suh, E. M, (1999). Cross-Cultural Variations in Predictors of Life Satisfaction: Perspectives from Needs and Values. DOI: 10.1177/01461672992511006, Pers Soc Psychol Bull 1999; 25; 980, Downloaded from http://psp.sagepub.com on October 28, 2008 Rivero, L. (2002). Creative home schooling for gifted children: A resource guide. Scottsdale, AZ: Great. Roming, D. & Cleland, C. C. (1972). Educational Applications of Humanistic Psychology. Journal of School Psychology, 10(3), 289-298. Saeednia, Y. (2009). The Need to Know and to Understand in Maslow’s Basic Needs Hierarchy. US-China Educational Review Volume 6, Number 9, September 2009 (Serial Number 58), 52-57. David Publishing Company, Illinois 60048, USA. Wlodkowski, R.J. (1981). Making Sense of Motivation: A Systematic Model to Consolidate Motivational Constructs across Theories. Educational Psychologist, 16(2), 101–10. Wlodkowski, R.J. (1984). Motivation and Teaching. Washington D.C. :National Education Association.
3092
Yadolla Saeednia / Procedia Social and Behavioral Sciences 15 (2011) 3084–3094
Zemke, R. (1998). Motivation Basics. Training, 35(12), 56. Zimmerman, M. (2002a). Abraham Maslow, Emotional Literacy and Ortho-Education: How to Make the World a Better Place, chapter 6. Retrieved Feb. 11, 2007, from http://emotionalliteracyeducation.com/abraham-maslow-emotional-literacy-ortho-education.shtml. Zimmerman, M. (2002b). Emotional Literacy Education and Self knowledge: How to Make the World a Better Place, chapter 1 Retrieved Apr. 18, 2007 from http://emotionalliteracyeducation.com/index.shtml.
3093
Yadolla Saeednia / Procedia Social and Behavioral Sciences 15 (2011) 3084–3094
Appendix A Basic Needs Satisfaction Scale (BNSS) Name: ………………. Stand: …………………. Sex: ………….. School: …………………. Dear Student This questionnaire is supposed to apply for research about children. Please fill it up carefully. There is no right or wrong answer. It is just your view that is important. Read the items and decide to which extend it is correct about you. Choose one of the: Nothing, a little, somewhat, or a lot" and mark in the blank. We appreciate your patient and accuracy. Please answer following questions prior to begin the main questionnaire. 1. Have you got any brothers? ……… 2. Have you got any sisters? …….. Items:
Nothing
A little
I like Knowledge. My friend likes me. I have great clothes. I am able to do my own works. I have toys. I like my father. I am happy with the house we are living in. I like the foods that I eat. Guys go off sulk with me. I am a successful person. I worry that I hurt. People like me. I have time to play. I know about the things. I am important. I feel free in the house. I can do many different tasks. My mother likes me. In parties, I am afraid that the food finishes. I go to funny places. I think about what I am good at. When I don't understand something, I get upset. I am beautiful. My teacher likes me. I am active. I have seen the movies I like. I get upset when the guys go sulk with me. I have perseverance in my tasks. I have already chosen my subject area of study.
Somewhat
1 2 3 4 5 6 7 8 9 10 11 12 13 14 15 16 17 18 19 20 21 22 23 24 25 26 27 28 29
A lot
Statement
3094
Yadolla Saeednia / Procedia Social and Behavioral Sciences 15 (2011) 3084–3094
30 31 32 33 34 35 36 37 38 39 40 41 42 43 44 45 46 47 48 49 50 51 52 53 54
I am afraid my parents are under threats. Guys trust in me. I am allowed to say my idea in the house. People think badly about me. I am scare of my father. My father beats me. I like my teacher. I would like to keep a pet. I think about my future job. I am able to prevent from unpleasant events. I can tell my parents what I want to buy. I am scared of my mother. My mother beats me. I am a resolved person. I think about future in my leisure time. I am interested in books. I know myself. Knowing about different things makes me happy. I like to stay at home. When I take snacks to school, I worry pupils take it from me. My mother ridicules me. I am happy with my father's job. I would like to have a bird. I like my brother. I like my sister.
55 56
I got questions that I like them to be answered. I have good friends
57 58 59 60 61
My father likes me. My clothes are beautiful. I would like my father change his job. I am eager in scientific books. I think about success in my favourite field of study.
62 63 64 65 66
My father ridicules me. I worry to defeat in games. I am a powerful person. I like learning. I can recognize my weaknesses.
67
If I don't know the answer of a question, I don't feel comfortable.
68 69 70
I worry I lose my parents. My brother likes me. My sister likes me.