GENERATING DYNAMICALLY SCHEDULED MEMORY ADDRESS TRACES Richard L. Oliver and Patricia J. Teller † The University of Texas at El Paso
[email protected] and
[email protected] Abstract It is common practice to study the performance of a computer memory hierarchy design via trace-driven simulation. The validity of such studies is dependent on the accuracy of the memory address trace that is used to drive the simulations. To study the performance of a memory hierarchy for a multiprogrammed computer system, the accuracy of the trace is defined by the length, in terms of the number of memory addresses, of the trace segments that comprise each process trace and the method used to interleave process trace segments. This paper reviews methods that have been used to generate memory address traces for use in simulating memory hierarchy designs. More importantly, it presents a new and more accurate method of generating these traces. Given a set of annotated uniprogram memory address traces (UMATs), which are associated with the processes that comprise the workload being studied, a specification of the design of the processor cycle time, memory hierarchs design, system call service times, and scheduling policy, this method dynamically generates a trace at simulation time by defining the correct trace segment interleaving via the correct process scheduling. One set of UMATs can be used to generate accurate traces for a variety of configurations of simulated systems.
1. INTRODUCTION It is common practice to study the performance of a computer memory hierarchy design via trace-driven simulation. Trace-driven simulation refers to a discrete event simulation that is driven by a trace, i.e., a sequence of recorded events. In the case of a simulation of a computer memory hierarchy design, the events are the memory addresses that are generated by a process or processes during their execution. Each record in a memory address trace consists of a tag field and a memory address. The tag field indicates if the memory access is a data read, a data write or an instruction fetch with tag values 0, 1 and 2, respectively. Figure 1 illustrates memory address trace segment in Dinero format [Hill, 1991]. We define a trace segment to be a recorded sequence of memory addresses in a trace between context switches. A context switch occurs at the end of the interval of execution of a process. This can occur as the result of the process † This research is supported by the Defense Advanced Research Program Agency (DARPA), U.S. Department of Defense - Navy Contract #N66001-97-C-8533.
requesting operating system service through a system call or in a multiprogram environment, when the time slice allocated to the process ends or the process is preempted by a higher priority process. These are called voluntary and involuntary context switches, respectively. Tag Address 0 FFE90A 2 0200004 2 0200008 2 020000C 1 FFE90A ... Figure 1: A Memory Address Trace As indicated above, a memory address trace is a sequence of trace segments delimited by context switches. For example, Figure 2 illustrates the relationship between the user process trace segments (UPTS) and the operating system trace segments (OSTS) as the execution of a program proceeds through the user code and the operating system code implementing system calls in a uniprogram environment. Such a trace is called a complete uniprogram memory address trace (CUMAT). If this trace contained only the memory addresses referenced by the user process, it would called a uniprogram memory address trace (UMAT).
UPTS
AAAAAAAA AAAAAAAA AAAAAAAA AAAAAAAA AAAA AAAAAAAA AAAAOSTS UPTS AAAAAAAA AAAAAAAA AAAAAAAA AAAAAAAA AAAAAAAAAAAAAAAA
AAAA AAAAAAAA AAAA AAAAAAAA AAAAAAAA AAAA OSTS AAAAAAAA AAAA AAAA AAAAAAAA AAAAAAAAAAAA
UPTS
Figure 2: User Process and Operating System Trace Segments We define a complete multiprogram memory address trace (CMMAT) to be a trace that includes all the memory address trace segments generated by both user processes and operating system processes during the execution of a multiprogram workload. The notation UP1TS, UP4TS and UP2TS indicate trace segments from User Process 1, User Process 4 and User Process 2, respectively. The notation OS1TS and OS6TS indicates trace segments from components of the operating system. An example CMMAT is shown in Figure 3.
UP1TS
AAAA AAAA AAAA AAAA AAAA AAAA AAAA AAAA AAAA AAAA AAAA AAAA AAAA AAAA AAAA AAAA OS1TS UP4TS AAAA AAAA AAAA AAAAAAAAAAAAAAAA AAAA
AAAA AAAA AAAA AAAA AAAA AAAA AAAA AAAA AAAA AAAA AAAA AAAA AAAA AAAA AAAA AAAA OS6TS UP2TS AAAA AAAA AAAA AAAAAAAAAAAAAAAA AAAA
Figure 3: A Complete Multiprogram Memory Address Trace
If this trace contained only the memory addresses referenced by the user processes, it would be called a multiprogram memory address trace (MMAT). A scheduled MMAT (SMMAT) or a scheduled CMMAT (SCMMAT) reflects an inherent static scheduling of the n processes in execution. More specifically, either of these scheduled traces statically defines both the size of each trace segment for each dispatch interval and the interleaving of the trace segments of the processes in execution. The trace segment sizes and the trace segment interleaving are both products of the method used to generate the trace. For example, the SCMMAT illustrated in Figure 3 reflects the process scheduling of the monitored computer system. A significant change to the monitored computer system’s processor cycle time, memory hierarchy design, system call service times or scheduling policy would likely result in a significant change in the SCMMAT of the same multiprogram workload. Completely accurate trace-driven simulation of multiprogrammed computer systems can be achieved by driving the simulation with an ideal CMMAT, i.e., one that reflects the accurate (in terms of the simulated system) interleaving of the UMATs and the operating system trace segments [Chen and Bershad, 1993]. However, the memory address trace that is an ideal MMAT/CMMAT for a given simulated system will be an ideal MMAT/ CMMAT for only those simulated systems with identical processor cycle times, memory hierarchy designs, system call service times or scheduling policies. When the simulations system parameters are changed, the ideal MMAT/CMMAT for the simulated system is effected. For example, if the memory parameters are changed such that the delays associated with accessing referenced memory locations are changed, the number of instructions in a trace segment can change. That is, when the number of cycles per instruction increases due to memory hierarchy delays, the number of instructions executed per time quantum decreases. If I/O simulation parameters, such as disk read and write times are changed, the required time for blocking the process changes. This change in waiting time for I/O results in an increase in the number of instructions, executed by concurrently running processes, between the request for I/O by the process and the resumption of its execution when the I/O request is satisfied. In either or both of these cases, the MMAT/CMMAT is no longer ideal since the scheduling inherent in the trace does not reflect the delays specified in the modified simulated system. In contrast, with the specification of the processor cycle time, memory hierarchy design, system call service times and scheduling policy, systems for generating SMMATs can dynamically adjust the scheduling of processes to create accurate SMMATs for a variety of configurations of
simulated systems from the same set of UMATs. The remainder of this paper is organized as follows. Section 2 summarizes methods commonly used to manufacture both SMMATs. In Section 3, we present our system for generating dynamically-scheduled SMMATs using the specification of the processor cycle time, memory hierarchy design, system call service times and scheduling policy of the simulated system. In Section 4 we present an overview of our methodology for computation of the system call service time distributions. A complete description of this methodology is presented in [Oliver et al., 1998]. Finally in Section 5, we present concluding remarks.
2. RELATED RESEARCH Trace segments from the UMATs of individual processes are interleaved or spliced together in order to manufacture a SMMAT (SCMMAT) to drive a trace-driven simulator. Each UMAT is conceptualized as a process which is considered for execution on the simulated CPU. A process is considered to be in execution when one of its trace segments is currently being used to drive the trace-driven simulation of a memory hierarchy. Most of the trace generation systems discussed below consider all processes to be in the ready to execute state at all times. However, by including a blocked state and dynamically generating the trace, a more realistic SMMAT can be generated. This section summarizes methods that have been used by researchers to manufacture SMMATs (SCMMATs). In general, all the methods define (1) a method to divide a process’ UMAT into a set of trace segments and (2) a method to interleave n process’ trace segments into a SMMAT (SCMMAT).
2.1 Trace Segment Length One commonly used method to divide a UMAT into trace segments is to place a fixed number of memory addresses in each trace segment. For example, Strecker [1983] set the fixed length of a trace segment to 25,000 memory addresses. Short and Levy [1988] set the fixed length of a trace segment to 50,000 memory addresses; Deville and Gober [1992] set the fixed length of a trace segment to 100, 1,000 and 10,000 memory addresses in each of three simulations. Flanagan et al. [1992] use 50,000 and 500,000 memory addresses per trace segment in their simulations. When the execution of a process is simulated, the processor cycle times and the delays associated with accessing the memory hierarchy influence the number of memory addresses in its trace segments. Przybylski et al. [1989] measures the mean time between context switches in CMMATs collected on a VAX [Agarwal, 1986] and uses this mean time to determine the number of memory addresses in a trace segment. Morioka et al. [1994] uses markers for context switch points to determine the number
of memory addresses in a trace segment. When a context switching point is encountered in a process’ UMAT, it is considered to the be the end of the current trace segment. Bugge et al. [1990] use traces which include markers for system calls in a process’ UMAT. In their system, requests for operating system services, via system calls, cause the calling process to block for the amount of simulated time required to service the system call. Therefore, when a system call marker is encountered in a process’ UMAT, the end of the current trace segment is defined. This is done to simulate the blocking and readying of processes due to the operating system filling requests for system services. In the Bugge et al. system, the end of the current trace segment can also be defined by the expiration of the time quantum for the process in execution. When the process is dispatched into execution, a simulated interval timer is started that accumulates the simulated time the process is in execution. When the accumulated time is equal to the amount of time in a time quantum, the dispatch interval, and current trace segment, is ended. The third manner in which the current trace segment can end is by preemption by a higher priority process. This occurs when the current simulated time advances to the simulated time for the completion of the system call made by the higher priority process. At that time, the lower priority process is involuntarily context switched and the higher priority process is placed into simulated execution.
2.2 Interleaving Policy We call the policy by which processes are selected for simulated execution during the generation of a SMMAT the scheduling policy. When a dispatch interval is ends by either a voluntary or involuntary context switch, some process must be selected as the next process to be placed in simulated execution. The most common scheduling policy reported in the literature is the round-robin policy. The implicit assumption made by these trace generation systems is that all processes have equal scheduling priority and are always ready to be placed into simulated execution. That is, no process is blocked for any reason. For example, Alpert and Flynn [1988] interleave the trace segments of five CUMATs using such a round-robin scheduling policy. Deville and Gober [1992] interleave four UMATs using a round-robin scheduling policy to manufacture a SMMAT. Flanagan et al. [1992], Morioka et al. [1994], Olukotun et al. [1991], Short and Levy [1988] and Strecker [1983] all use a round-robin policy to interleave trace segments when generating a SMMAT. A second scheduling policy reported in the literature uses a randomly selected process from the set of processes as the next process to be placed into simulated execution. Przybylski et al. [1989] and Przybylski [1990] use this random scheduling policy to interleave trace segments when gener-
ating a SMMAT. That is, when the end of the current trace segment is reached, the next trace segment is selected by randomly selecting a process; its next trace segment is the trace segment output to the SSMAT. Again, the implicit assumption is that all processes have equal scheduling priority and are always ready to be placed into simulated execution. Bugge et al. [1990] manufacture a dynamically-scheduled MMAT by interleaving UMAT segments using a roundrobin, priority-based, preemptive scheduling policy. A process is considered by the scheduler for simulated execution if it is not blocked, or waiting, on a system call. When a process is dispatched it executes until either a voluntary or involuntary context switch. A process involuntarily context switches when its time quantum expires or it is preempted from simulated execution by a higher priority process that was blocked on a system call and has been readied for execution. A process voluntarily context switches when a system call is encountered in its UMAT. When a system call that involves disk input or output operations is encountered, the associated process is blocked for a random amount of simulated time between 20 and 40 milliseconds. Accordingly, the process is not considered for simulated execution during this simulated time period. When a system call that does not involve disk input or output operations is encountered, the process is blocked for a random amount of simulated time between 0.8 and 2.0 milliseconds. In the following section, we report our extensions to the methodology used by Bugge et al. [1990]. Our extensions focus around replacing the uniform distributions that are used to define system call service times during a simulation. We believe that using only two classes of system call service times does not provide the scheduling algorithm enough information to generate accurate system call service times.
3. MANUFACTURING A DYNAMICALLY-SCHEDULED MMATs VIA THE VIRTUAL PROCESS SCHEDULER The method that we use to manufacture a dynamicallyscheduled MMAT extends the method of Bugge et al. [1990]. Our method is like that of Bugge et al. in the following ways: (1) the dynamically-scheduled MMAT is manufactured during the simulation and it reflects the simulated system; (2) annotated UMATs drive the simulation and define the points (relative to memory address references) at which system calls occur; and (3) trace segments are defined by system call annotations in the UMATs and a round-robin, priority-based, preemptive scheduling policy is used to manage trace segment interleaving. Our method
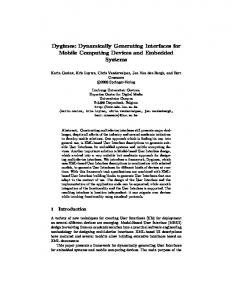
is different from that of Bugge et al. in the technique that is used to define system call service times. Bugge et al. defines two classes of system calls, I/O and non-I/O system calls, and select the service times from two uniform distributions. In contrast, in our simulation platform the service time of a system call is selected from a distribution for a particular system call, the distribution having a mean µ and standard deviation σ. We generate UMATs using software tools based upon the dynamic compilation tool, Shade, from Sun Microsystems [Cmelik and Keppel, 1994]. Shade enables dynamic instrumentation of a program during its execution, examination of the state of the simulated SPARC architecture that is assumed to be executing the program and extraction of the information that is required to construct an UMAT. Our UMATs are Dinero style [Hill, 1991] memory address traces that are augmented with records of type 3. Type 3 records are used to represent system calls and contain the system call number. Figure 4 illustrates the marking of the position and type of system calls in a UMAT. In this figure, a system call of type 7 is executed after the instruction located at memory address 0200008. Tag Address 2 0200004 2 0200008 3 0000007 2 020000C 2 0200010 ... Figure 4: An Augmented UMAT The Virtual Process Scheduler (VPS) is the component of our simulation platform that delivers memory addresses to the simulated memory hierarchy, computes system call service times from the set of service time distributions, manages simulated time and implements the round-robin, priority-based, preemptive scheduling policy. A block diagram of the VPS is given in Figure 5. System Call Service Time Distributions
UT UT UT UT UT UT UT
Uniprogram Memory Address Traces
Performance Metrics Dynamically-Scheduled Memory Address Trace
Virtual Process Scheduler
Memory Hierarchy Simulator
Memory Access Cycle Counts
Figure 5: The Virtual Process Scheduler Simulation
Platform Since the annotated input UMATs are stored in a PDATS compressed form [Johnson, 1994], the VPS reads and expands (decompresses) portions of the UMATs as necessary in order to forward memory addresses to the memory hierarchy simulator. As a process executes on the simulated CPU, the VPS forwards memory addresses to the memory hierarchy simulator one at a time. In turn, the memory hierarchy simulator processes the corresponding memory access, including the delays encountered at all levels of the memory hierarchy and observing the defined memory protocols. The memory hierarchy simulator returns to the VPS the total simulated time, measured in cycles, that is required by the memory hierarchy to access the referenced memory address. Accordingly, the VPS updates the current simulation time. Although the VPS could be used to simulate any process scheduling policy, the scheduling policy used for our research is the round-robin, priority-based, preemptive scheduling policy described by Bach [1986] as the UNIX scheduling policy. To implement this policy, at each simulated process dispatch, the time quantum is reset to one one-hundredth second, which is one million cycles on the simulated target RISC architecture. The scheduling policy assigns to each process a priority that is recomputed once each simulated second. The algorithm used to derive these priorities [Bach, 1986] assumes that all processes are executing with the same base priority level or BasePriorityLevel. All processes are executed in user mode. Once per simulated second, the scheduler applies a decay function to the CPU value of all processes that have been preempted, but are ready to execute. The decay function is CPU(process i) = CPU(process i) / 2.0 The CPU value for any running process is increased each time it requests a system call or is involuntarily context switched. After the decay function is applied, the scheduler recomputes process priorities for the preempted but readyto-execute processes as Priority(i)=CPU(i)+BasePriorityLevel Next, the processes are ordered from lowest to highest numeric priority and the process with the lowest numeric priority that is in the ready process queue is selected for execution. Our implementation provides the capability to modify the frequency with which process priorities are recomputed. One advantage to increasing this frequency is to provide for a more responsive scheduling environment when large numbers of processes are performing relatively small amounts of processing between system calls. When a system call is generated, the state of the generating
process is set to blocked, the generating process is added to the blocked process queue and an event that signifies the completion of the system call service time is scheduled in the simulation. When the simulation time is equal to the time of the event, the state of the generating process is set to ready and it is added to the ready process queue. Since the simulation is event driven, if at some point in the simulation all processes are blocked on uncompleted events, the VPS warps the simulation time forward to the event with the smallest simulated completion time.
4. OVERVIEW OF GENERATION OF SYSTEM CALL SERVICE TIME DISTRIBUTIONS Accurate measurement of system call service times on a RISC computer running Sun Microsystems Operating System 4.1.3 can be difficult and requires solving significant problems. First, the primary tool available to acquire event times is the getrusage system call. This system call returns system and user times in units of seconds and microseconds. But, because of the manner in which time is charged to processes under the Sun Microsystems Operating System 4.1.3, event times that are measured using getrusage do not possess the accuracy that is required to reliably measure a single system call [Oliver, 1995]. For example, many system calls have average service times that are in units of microseconds. For a system call of this class, the execution time is small enough that the generating process is charged either no time or one one-hundredth of a second for the execution of the system call. Therefore, a single measurement of a system call is not reliable. Rather, a sequence of measurements performed within a measurement code loop is required. The second significant problem in measuring system call service times is accounting for the execution time (cycle count) of the instructions that are associated with the measurement activity. In a measurement code loop these instructions implement the repetitive execution of the measurement code and their execution time is referred to as the instrumentation loop overhead. Given the execution time of the measurement code loop, the instrumentation loop overhead must be removed explicitly or amortized over a large number of system calls so that its contribution to the execution time of the measurement code loop is insignificant in comparison to the execution time of the measured system calls. Using the methodology described in [Oliver et al., 1998], a set of trials were run and the results were validated statistically. The execution time of each system call is represented by a mean µ and a standard deviation σ computed from the time measurements made in these trials. Table 6, “System Call Service Time Distributions,” presents a selected set of
system call service time distributions. This data was collected using a SPARC ELC isolated from the network and executing in multiuser mode with a single user logged into the system. TABLE 6. System Call Service Time Distributions System Call
Mean (µ in msec)
Standard Deviation (σ in msec)
chdir
0.4261
0.0005789
creat
0.0712
0.000077
gethostname
0.0218
0.0000256
getpid
0.0207
0.0000192
getpriority
0.0369
0.0000236
link
1.359
0.0046431
setitime
0.1177
0.0000000
open
0.2377
0.0024510
We extended these results to other Sun SPARC systems by making the assumption that system calls require approximately the same number of machine cycles to execute on SPARC systems with different clock rates. That is, if a system call requires 200 cycles on a SPARC 1+ running at 33 MHz, we assume it requires approximately 200 cycles on a SPARC 10 running at 55 MHz. Assuming this, we extrapolate our system call execution times by computing the cycle counts of each system call on the 33 MHz machine and use this count to compute the mean and standard deviation of the execution time on the 55 MHz machine. We validated this extrapolation by running our measurement and analysis programs on a 33 MHz SPARC CPU rated at 21 MIPS, estimating the execution times of the system calls on a 87 MHz SPARC using the our technique, and running our measurement and analysis programs on the 87MHz SPARC. The estimated results are in excellent agreement with the measured results.
5. SUMMARY In this paper, we present a methodology for manufacturing a dynamically-scheduled uniprocessor multiprogram memory address trace and a trace-driven simulation methodology that facilitates accurate simulation of memory hierarchies of uniprocessor multiprogram computer systems. This combination of trace generation and simulation methodologies is implemented by our Virtual Process Scheduler. Given a set of augmented uniprocessor memory address traces, which are conceptualized as processes, the VPS implements a round-robin, preemptive, priority-based
scheduling policy to manufacture a dynamically-scheduled MMAT and simulates a uniprocessor multiprogram computer system. An augmented UMAT contains markers that identify system calls generated by the associated process. The system call service times associated with these systems calls and the blocking times associated with the generating process, are accurately simulated using a service time distribution for each system call. We present an overview of the technique that we used to measure system call service times, validate them and extrapolate these system call service times to similar architectures with different clock rates. Although our methodology facilitates the accurate simulation of uniprocessor multiprogram computer systems, addresses referenced by operating system processes are not included in the manufactured trace. Therefore, the related memory accesses are not considered in a simulated multiprogram computer system’s memory hierarchy. Work in progress extends our methodology to manufacture dynamically-scheduled CMMATs, which include addresses referenced by the operating system.
6. BIBLIOGRAPHY Agarwal, A., R. Sites and M. Horowitz, “ATUM: A New Technique for Capturing Address Traces Using Microcode,” Proceedings of the 13th Annual International Symposium on Computer Architecture, pp. 119-127, June 1986. Alpert, D. B., and M. J. Flynn, “Performance Trade-Offs for Microprocessor Cache Memories,” IEEE MICRO, pp. 44-54, August 1988. Bach, M. J., The Design of the Unix Operating System, Englewood Cliffs, New Jersey, Prentice-Hall, Inc., 1986. Bugge, H. O., E. H. Kristiansen and B. Bakka, “Trace Driven Simulations for a Two-Level Cache Design in Open Bus Systems,” Proceedings of the 17th Annual International Symposium on Computer Architecture, pp. 250259, May 28-31, 1990. Chen, J. B., and B. N. Bershad, “The Impact of Operating System Structure on Memory System Performance,” Proceedings of the Fourteenth ACM Symposium on Operating Systems Principles, pp. 120-133, December 5-8, 1993. Cmelik, R., and D. Keppel, “Shade: A Fast Instruction-Set Simulator for Execution Profiling,” Proceedings of the 1994 ACM Sigmetrics Conference on Measurement & Modeling of Computer Systems, pp. 128-137, May 1994. Deville, Y., and J. Gober, “A Class of Replacement Policies for Medium and High-Associativity Structures,” Computer Architecture News, 20, 1, pp. 55-64, March 1992. Flanagan, J. K., B. Nelson, J. Archibald and K. Grimsrud, “BACH: BYU Address Collection Hardware; The Collec-
tion of Complete Traces,” Proceedings of the 6th International Conference on Modeling Techniques and Tools for Computer Performance Evaluation, pp. 51-65, September 1992. Hill, M. D., DINEROIII, Release Version 3.4, 1991. Johnson, E. E., and J. Ha, “PDATS: Lossless Address Trace Compression for Reducing File Size and Access Time,” Thirteenth Annual IEEE International Phoenix Conference on Computers and Communications, 1994. Morioka, M., K. Kurosawa, S. Miura, T. Nakamikawa and S. Ishikawa, “Design and Evaluation of the High Performance Multi-Processor Server,” Proceedings of the IEEE International Conference on Computer Design: VLSI in Computers and Processors, pp. 66-69, October 10-12, 1994. Oliver, R. L., “A Methodology for Estimating Errors in CPU Time Measurements,” NMSU-CSTR-9522, December 1995. Oliver, R., W. McGregor and P. Teller, “Accurate Measurement of System Call Service Times For Trace-Driven Simulation of Memory Hierarchy Designs,” Proceedings of the 1998 IEEE International Performance, Computing and Communications Conference, Phoenix/Tempe, Arizona, February 16-18, 1998. Olukotun, O. A., T. N. Mudge and R. B. Brown, “Implementing a Cache for a High Performance GaAs Microprocessor,” Proceedings of the 18th Annual International Symposium on Computer Architecture, pp. 138-147, May 27-30, 1991. Przybylski, S., M. Horowitz and J. Hennessy, “Characteristics of Performance-Optimal Multi-level Cache Hierarchies,” Proceedings of the 14th Annual International Symposium on Computer Architecture, pp. 114-121, 1989. Short, R. T., and H. M. Levy, “A Simulation Study of Two-Level Caches,” Proceedings of the 15th Annual International Symposium on Computer Architecture, pp. 81-88, May 30- June 2, 1988.