Generating Interesting Monopoly Boards from Open Data Marie Gustafsson Friberger and Julian Togelius
Abstract—With increasing amounts of open data, especially where data can be connected with various additional information resources, new ways of visualizing and making sense of this data become possible and necessary. This paper proposes, discusses and exemplifies the concept of data games, games that allow the player(s) to explore data that is derived from outside the game, by transforming the data into something that can be played with. The transformation takes the form of procedural content generation based on real-world data. As an example of a data game, we describe Open Data Monopoly, a game board generator that uses economic and social indicator data for local governments in the UK. Game boards are generated by first collecting user input on which indicators to use and how to weigh them, as well as what criteria should be used for street selection. Sets of streets are then evolved that maximize the selected criteria, and ordered according to “prosperity” as defined subjectively by the user. Chance and community cards are created based on auxiliary data about the local political entities.
I. I NTRODUCTION We would like to add to the ever-growing list of things that can be done with games by proposing, discussing and exemplifying data games. A data game is a game that allows the player(s) to explore data that is derived from outside the game, by transforming the data into something that can be played with. In other words, games as a form of interactive data visualisation. We believe that games, through their procedural and interactive nature, can provide possibilities for visualisation over and beyond traditional methods. Data games differ from most other types of serious and educational games in that they do not (intentionally) have an agenda; they are tools for the player to use to explore data with as few constraints as possible. This implies that the player, to the greatest extent possible, should be able to choose both what data to use and what in the data is important. Data games build on the open data and linked data movements (Section II), as the growing amount of data that is available in this way is a good fit for game-based exploration. The concept of data games can be analysed through the dimensions of genre, type of data and transformation of data into game content (Section III). One means of performing the transformation of data into game content is through procedural content generation (PCG) (Section IV). As an example of a data game, we describe Open Data Monopoly (Section V), which generates Monopoly game boards based on open data in the form of economic and social indicator data for local governments in the UK. In this data M. Gustafsson Friberger is with the Department of Computer Science, ¨ Malm¨o University, Ostra Varvsgatan 11A, 211 19 Malm¨o, Sweden (email:
[email protected]); Julian Togelius is with the Center for Computer Games Research, IT University of Copenhagen, Rued Langgaards Vej 7, 2300 Copenhagen, Denmark (email:
[email protected]).
978-1-4673-1194-6/12/$31.00 ©2012 IEEE
game, the main idea is that the primary user interaction and data visualisation is in the process of generating of the game board, rather than in playing the game. II. O PEN AND LINKED DATA Open data, and especially open government data, is the idea of making data available to the public to enable, for example, transparency and reuse. Governments in countries such as the United Kingdom1 , Kenya2 , and New Zealand3 (to name only a few) have initiatives for making data available to the public via the Web. Other organisations include the United Nations4 and the World Bank5 , as well as cities, such as London6 . The available open data covers many different domains, for example, finance, social and economic indicators, and community information. A variety of forms of access are used to provide open data to the public. One example is by providing the information in spreadsheets via government portals. This has drawbacks such as being cumbersome to parse and access. One way of overcoming this is by providing application programming interfaces (APIs). Yet another way of providing access to open data is through linked data [1], [6]. Linked data is based on four principles: (1) using Uniform Resource Identifiers (URIs) to name things, (2) that HTTP URIs are used so that people can look up those things, (3) that the information returned upon lookup is useful and in a standard format – such as the W3C recommendations of Resource Description Framework (RDF) or the SPARQL Protocol and RDF Query Language (SPARQL) – and (4) that links are provided to other URIs. In addition to some government data being available using these principles (such as parts of that of the United Kingdom7 ), there are many other initiatives, such as the DBPedia project [2], which makes the structured data found in Wikipedia’s info boxes available as linked data. Common usages of open data are dedicated applications, as well as visualisations and mashups. Examples include the GapMinder tool [11] for visualising world development, mobile apps for reporting potholes, and mashups for seeing where bikes are stolen. Davies [4] suggests five distinct processes of open government data use: data to fact (for example, identifying specific facts of interest), data to information (for 1 http://data.gov.uk/ 2 http://opendata.go.ke/ 3 http://www.data.govt.nz/ 4 http://data.un.org/ 5 http://data.worldbank.org/ 6 http://data.london.gov.uk/ 7 http://data.gov.uk/linked-data
288
example, infographics and blog posts), data to interface (for example, mashups and interactive visualisations), data to data (for example, sharing derived or combined data), and data to service (for example, data necessary to provide a broader application). Multiple processes may be used within one use case. While there is a large movement in making data available and using this data, it is still an area under development. Open questions include how best to make the data available (for example, processes within the organisations for identifying data and ensuring its quality, as well as what data formats to use) and how to build applications on it. There are also issues of needing to handle incomplete information, special codes or acronyms, as well as lack of metadata, as discussed by Ding et al. [5]. We suggest that games are a natural metaphor for citizens (or players) to interact with, engage with, and make sense of open data. Open data also offers an opportunity for games to connect with real-world phenomena. III. BASING GAMES ON DATA Games, comprising digital (computer) games as well as nondigital games (board games, card games etc), have recently become one of the dominant media forms, at least in Western cultures. As noted by several authors, games have a potentially very broad range of expression; games can be used to educate, train, question and persuade, though many still think of games as exclusively a form of entertainment [3], [8], [9], [14], [10]. Another form of game expression would be to use games to comprehend data. Rather than using a game to prove a point to the player, sway the player’s conviction or train the player to perform a task, a game could be used to help players make their own sense of data, as much as possible without any agenda beyond understanding. Such a game would allow players to choose their own data sets and their own priorities for which aspects of these datasets are interesting, and assist the players in trying to understand the data in the way they prefer. Such a game can be seen as a form of visualisation, were it not for that the procedural character of games means that their mode of expression is more than just visual. We have not been able to find any existing examples of data games. The examples presented by Macklin et al. [7] are the closest to the meaning that we intend. There are other examples of serious or other games based on real-world data – primarily geographical data – such as Localiz.me, a treasure hunt games based on Google Maps. However, these games do not let the user select what data to explore or how to explore it, and do not re-represent the geographical data, but rather retain the conventional map representations. It is important to distinguish the class of sense-making games that we discuss here from educational games and training games, which is the currently most discussed, researched and developed category of serious games. Such games aim to instil understanding of some specific piece of factual knowledge (in the case of educational games) or skill (in the case of training games), which is specified by the designers
of the game or by educators that adjust the game to fit the curriculum they have in mind. In contrast, data games are not intentionally constrained to teach a particular curriculum, but are rather explorative tools under the control of the player, where the player chooses what aspects of the data to make sense of as well as what to learn from it. There are a large number of ways in which games could be based on or incorporate open data in order to help make sense of, make accessible or provide a different perspective on data that comes from the “real world” outside of the game. The various types of possible data games could be categorised along the following dimensions: 1) Genre of game that would underlie the data game. Possible game categories include board games, firstperson 3D computer games, and strategy games, each with their own affordances and limitations. 2) Type of data used in the game. Given the increasing feasibility of linking data sources, and the strength of procedural representation for visualising and allowing exploration of how different types of data interact and depend on each other, we expect many data games to draw on several different data sources of different types. Some categories of data that are often made publicly available and are often in need of sense-making and visualisation due to their complexity and/or sheer size of the datasets are geographic, demographic and political data. 3) How the data is transformed into content in the game. Game content refers to a large variety of types of artefacts used in games, including maps, levels, items, quests, rules, textures and music; almost any type of game content could plausibly be generated based on open data. The first dimension revolves around the genre of game that would underlie the data game. Some examples of types of games that could be used are: •
•
Board games, such as Monopoly, Chess, Go and Settlers of Catan. These have the advantage of being well-known to a large number of people, meaning both that there are strong conventions to exploit and that many people know how to play them. For example, the members of a government or a board of directors can be cast into the roles of the different pieces on a Chess board (king, queen, pawn etc), immediately conveying an understanding of their relative roles and importance. Traditional board games are also easy to implement and computationally lightweight. Simple arcade-style computer games, such as Pac-Man, Snake, Boulder Dash and Super Mario Bros. Like board games, these games are understood by a large (if not equally large) part of the population and are relatively easy to (re-)implement or hack. A diverse set of conventions exists, though many of them revolve around consumption (of pills, dirt, power-ups) or destruction (of enemies, or the player character).
2012 IEEE Conference on Computational Intelligence and Games (CIG’12)
289
•
•
•
First-person 3D computer games, such as first-person shooters (Doom, Quake, Halo) or modern role-playing games (Final Fantasy, Mass Effect, Skyrim). These are generally quite complex to implement or modify and might exclude people who are not “gamers” due to the dexterity and orientation skills needed to play them successfully. On the other hand, this genre of games, which in some sense simulate how humans experience the world as they move through it, are almost perfectly suited to visualise data which can be represented as a threedimensional world. A simple and very straightforward example is Google Street View, which allows the user to move around the streets of many of the world’s cities and view them as if from a first-person perspective. Although offering no game mechanics and only a rudimentary movement control system, Street View still allows the user to explore geographical information from a very different perspective than the traditional from-above map perspective. A recently announced (and possibly parodic) project, Google Shoot View, aims to create a first-person shooter overlay (complete with standard FPS props such as guns and explosions) on top of the Street View data. More sophisticated data games aiming to include information from a diversity of sources would probably include a number of other actions and affordances aimed to facilitate exploration of the (geographical or other) data, in particular game mechanics that rely on the data. Trivia games, such as Jeopardy, Buzz! and Trivial Pursuit, come in computerised and non-computerised forms. They are usually trivial to implement. Any dataset that can readily be expressed as propositions could relatively easily be transformed into a trivia game. However, the simple game mechanics imply that the quality of a trivia game to a very large extent depends on how interesting the questions are. Automatically creating interesting questions with a given challenge level from a given data set would be an interesting and non-trivial artificial intelligence problem. Strategy games, such as Diplomacy, Civilization, StarCraft and Risk also come in both digital and non-digital versions, and are typically technically simple. Most strategy games play out on two-dimensional maps of various kinds, which make them ideally suited to data that is naturally represented on a plane — one immediately thinks of geographical data, but, for example, some types of medical and technical data are also naturally twodimensional. Additionally, sophisticated strategy games such as civilisation include a large number of interlocking game mechanics that map more or less directly to political, demographical and other societal phenomena, making them well-suited for the integration of and visualising the interplay between different types of data.
The second dimension concerns what type of data is used in the game. Given the increasing feasibility of linking data sources, and the strength of procedural representation for
visualising and allowing exploration of how different types of data interact and depend on each other, we expect many data games to draw on several different data sources of different types. Some categories of data that are often made publicly available and are often in need of sense-making and visualisation due to their complexity and/or sheer size of the datasets are: • Geographic data is typically easily available and easy to visualise, but not easy to remember for everyone and the amount of data out there is staggering. Games that help players get a quick overview of the geography of any particular area in a playful and enjoyable way, and make memory retention easier, could be very useful. • Demographic data can be very hard to pick through, and is usually visualised in such a way that the exact selection of indicators and division of the value space into bands or bars greatly affects the overall impression the visualisation gives (and is thus susceptible to spin for political purposes). A typical example of this is unemployment or immigration figures, which often look very different depending on who has selected the indicators and done the banding. Here we could imagine games that allow players to compose their own understanding of the data, based on categories that emerge from playful interaction. The game could for example include challenges relating to making the data look a particular way (can you make it look as if Sweden has 20%, or 1%, unemployment?), making the data arrangement and conceptualisation into a puzzle game. • Political data is only to a lesser extent quantitative – much of it is in the form of names, positions, hierarchies, committee memberships, laws, speeches and other primarily textual representations. The graph-like properties of formal or informal power structures might map well to some types of game content. • Real-time infrastructure data is also becoming increasingly available. For example, there is real-time data freely available about where flights are in the air right now. Imagine spending time waiting for your delayed flight not cursing the air traffic schedulers, but playing a game where you have the chance to their job (using real, current data) better. The third dimension relates to how the data is transformed into content in the game. Possible types of content include: • Maps and boards • Levels • Rules • Dialogue • Enemies and NPCs The type of contents available will of course depend on the game genre chosen, and different forms of data will map better or worse to different types of content. In [7], for example, the ancient flora of Manhattan is overlaid on the presentday cityscape. However, it should not be assumed that the best solution is to map the data to the type of content that
2012 IEEE Conference on Computational Intelligence and Games (CIG’12)
290
best resembles that data (for example, geography to maps and economy to in-game economics); the change of perspective inherent in transforming, for example, political arguments into spells might be a powerful mechanism for sense-making. IV. DATA - BASED PROCEDURAL CONTENT GENERATION PCG refers to algorithmic methods for creating various forms of game content automatically or with only limited user input [16]. “Game content” here refers to a large variety of types of artefacts used in games, including maps, levels, items, quests, rules, textures and music – basically anything that is not the game engine or NPC behaviour. While different forms of PCG have been part of some published games since the early eighties, most of the early attempts suffered from very poor control of the output of the algorithms. Recently, efforts have been made to base content generation on models of player experience [17] and to develop content generation methods that allow for human co-design [13], [12], thereby allowing for better controllability of PCG algorithms. Data games require that the external data, which is to be made explorable, is converted into game content automatically, as the player is free to select what data to play. This means that we need to develop PCG algorithms that base their content on real-world data, or in other words data-based PCG algorithms. A large number of different types of such methods, based on different underlying algorithms, are imaginable; the choice will depend on both the type of data to explore and the type of content to be generated. For example, recent methods for generating playable strategy game maps [15] could be modified to start from real-life maps of arbitrarily limited geographical areas, and place such items in the world (bases, resources etc) as supports gameplay while respecting the original geographical constraints; the placement could of course be informed by another data source, such as demographic, economic or geologic data. V. A N EXAMPLE : O PEN DATA M ONOPOLY Governments, such as that of the UK, publish national indicator data for local authorities. Examples of national indicators are Self-reported measure of people’s overall health and wellbeing and VAT registered businesses in the area showing growth. For data published by the UK, there are around 200 indicators for around 325 unitary authorities, district councils, metropolitan districts, and London boroughs. Visualising this comprehensive data set is a challenge. Monopoly is a board game where players buy streets and build houses on these. The aim of the game is to make money by owning streets and houses, and charging rent from other players who land on these streets; the winner is the player who still has funds when others are bankrupt. The game board consists of streets of increasing property values. In addition to streets, the game board has locations where the player gets to draw a Chance or Community Chest card, through which the player may, for example, gain or loose funds, or move to a different location on the board.
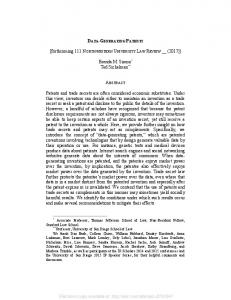
Numerous localised versions of Monopoly have been made, for cities, countries and local areas around the world; many (though not all) of them sanctioned and published by Hasbro. Some of these versions follow the general design philosophy of the original Monopoly board, whereas others have more explicit communal or political goals, e.g. representing the unique character of a city district through selection of participating streets and local landmarks and businesses. There exist other versions that are based on data from geographical units larger than a single city. In Monopoly Here and Now, for iOS devices, each street on the game board corresponds to a realworld city, such as Athens, Toronto or Shanghai. Monopoly City Streets was an interesting experiment run during a few months in 2009, where players could buy real-world streets around the world based on Google and Open Street Maps data. The game rules had to be modified quite heavily in order to accommodate the much larger number of players and gigantic size of the “game board”. To the best of our knowledge, there has not previously been any attempt to generate Monopoly boards automatically, nor to let the user/player participate in the selection of which real-world streets (or other entities) to base the game board on. A Monopoly board has 22 streets, sorted into eight groups. The first and the last group have two streets each, the other groups have three streets each. In all versions of Monopoly that we are aware of, the prices of the streets (and therefore also the rents of the streets, and the costs of building houses on the streets) increases monotonically from the first (just after the Go position) to the last street. In many versions of the game, the cost difference is substantial, with the last street costing almost ten times as much as the first. By using a common board game such as Monopoly as a visualisation metaphor, citizens can be provided with a means of visualising publicly available data about their country and neighbourhood. In this case, in addition to playing the game on a generated board, the generation of game content itself can provide insight into how different communities fare on different indicators. The main idea of the visualisation is to arrange the local authorities as Monopoly streets on the game board. The arrangement of the local authorities is determined by a weighting of different indicators and the values of each authority for these indicators. Below we describe the steps to generate a monopoly game board based on the national indicator data set. We solicit user input at two steps, for selecting and weighting indicators and for what criteria to use in selecting what geographical units to use as streets. Based on these inputs, the 22 streets of the game board and their costs are created. Figure 1 shows the steps in generating a game board as well as chance and community cards, described further below. We also present two example runs, discuss how the Open Data Monopoly can be evaluated as well as how it can be extended. A. Data pre-processing Through the UK open data initiative, we got access to national indicator data, which is available online as an Excel file. The
2012 IEEE Conference on Computational Intelligence and Games (CIG’12)
291
Preprocessing (Excel-file from data.gov.uk)
User input
Extract indicator data for geographical units
Select indicators and weights
Based on weighted indicators
Calculate prosperity of geographical units
User input
Weight street selection criteria
Evolutionary algorithm
Street selection
Based on prosperity
Street ordering
on what is important for judging the prosperity (or whatever high price on a Monopoly board is taken to mean) of an area, there are also several indicators for which it is unclear whether a high value is good or bad. For example, should the number of drug users in active treatment be high or low? A high number indicates many drug users, but also that they are being well treated. By assigning a random weight to such indicators, the system spurs the user to think about what the indicator means and make an active choice. Figure 2 depicts the GUI for selecting and weighting indicators. There is no limitation on how many indicators can be selected; in theory, a user could choose only one indicator, or all of them. C. Calculating overall prosperity for each geographical unit The weighting of indicators is used as input for the next step. For each geographical unit an overall value between −1 and +1 is calculated by summing the value of the selected indicators (multiplied by the weighting of the indicators) and dividing by the total number of selected indicators. The resulting value is then normalised to a number between 0 and 1000, which becomes the price of that street. This value can be regarded as a measure of prosperity of each geographical unit, as determined by the weighting of indicators selected by the user. D. Weighting of street selection criteria
DBPedia and card templates Fig. 1.
Create chance and community chest cards
Flow of game board and card generation.
file used for our prototype contains data made available in November 2010. The first step is to pre-process this data, mapping indicator values to geographical units and removing indicators with missing data. 72 indicators were used to create the game boards in the examples below. The indicators were normalised so that all values were between −1 and 1. The geographical units that were aggregations (for example, the South West or county councils) were also removed. B. Selection and weighting of indicators In this first request for user input, the user selects what indicators to include and gives them a positive or negative weight. To provide a starting point for the user, each time the application is run, five indicators are chosen at random, and they are also assigned random weights between −1 and 1. This can potentially mean some rather bizarre combinations of indicators, as well as counter-intuitive indicator weightings, such as negative weights for educational outcomes or positive weights for criminality. This is intentional and meant to provoke the user into making active choices of indicators and the weightings. While everyone will have their individual take
As there are many more geographical units than available streets, a selection of which streets to include on the board has to be made. We considered letting the user pick what geographical units to include, but the sheer number of possibilities that need to be selected from makes this cumbersome. Furthermore, if the user selects geographical units, this may lead to a less explorative approach. Instead, in the second request for input from the user, we let the user weight the three different criteria that the street selection algorithm uses in picking which geographical units to map to the game board streets. These criteria are intended to produce more interesting boards, than, for example, randomly selecting geographical units to map to streets. The user is presented with a brief description of each criteria, and for each uses a slider to indicate what weight to give to each. The three criteria that are weighted are: • •
•
Prosperity distribution, based on the prosperity values calculated above. Geographical distribution, based on the longitude and latitude of each geographical unit. These are fetched via SPARQL from the Ordinance Survey8 using their ONS code9 . Notability, based on the length of the Wikipedia article associated with each geographical unit.
8 http://data.ordnancesurvey.co.uk/ 9 Set of codes maintained by the Office for National Statistics (ONS) to represent geographical areas of the UK.
2012 IEEE Conference on Computational Intelligence and Games (CIG’12)
292
Fig. 2. The graphical user interface for selecting and weighting indicators. Each time the user selects or deselects an indicator in the scrollable list to the left, the corresponding slider appears or disappears to the right. Moving the slider all the way to the left assigns the corresponding indicator of −1, and all the way to the right means +1.
E. Street selection In the next step, the geographical units that will form the basis for the streets on the Monopoly board are selected. 22 units must be selected from the more than 300 units present in the cleaned dataset. As described above, in the Monopoly board generator, three ways of selection are used: prosperity distribution, geographical distribution, and notability. 1) Prosperity distribution: In the original Monopoly game, the streets are ordered from the less prosperous to the more prosperous. One criterion for choosing a set of units could therefore be that the units are maximally dissimilar in terms of prosperity. The prosperity dissimilarity could be measured as the average difference in prosperity between all units in the set. We define the prosperity distribution metric as: Pn Pn a=0 b=0 abs(p(a) − p(b)) (1) n2 where n is the number of selected units (22 in the case of standard Monopoly boards), a and b are individual units, and p(x) is the prosperity of unit x, calculated as described above using weighted indicator values. 2) Geographical distribution: Another feature of most editions of Monopoly is that the streets are relatively well distributed over the city that that city “depicts”. Thus, one criterion for selecting a unit set could be that the units are as well distributed as possible over the geographical area from which they are drawn. This could be the measured as the average distance between all selected geographical units. We define the geographical distribution metric as:
Pn
a=0
Pn
b=0 n2
dist(a, b)
(2)
where n is the number of selected units, a and b are individual units, and dist(a, b) is the Euclidean distance between units a and b using normalised latitude and longitude. 3) Notability: Part of the appeal of Monopoly is that the streets are well-known from real life. One criteria for selecting a unit set could be that the units are as well-known as possible, measured as the average length of the Wikipedia article describing them. We define the notability metric as: Pn a=0 artlen(a) (3) n where n is the number of selected units, a is an individual unit, and artlen(a) is the length of the Wikipedia article describing that unit. 4) Weighting the metrics: It is almost certainly possible to find a unit set that maximises all three metrics. We therefore optimise according to a weighted sum of the three metrics. This weighted sum is based on the user’s preferences: the user is simply asked for her relative preference between these three criteria via a graphical interface. 5) Unit set evolution: Once a weighted combined metric is obtained, it is used as a fitness function in an evolutionary algorithm, which evolves the unit sets that form the basis of the street creation. We use a µ + λ Evolution Strategy with µ = 50, λ = 50. The genome is a vector of unique integers of length 22. Each integer is an index into the vector
2012 IEEE Conference on Computational Intelligence and Games (CIG’12)
293
of all units. Mutation is performed by changing one or more integers to other integers, signifying that one unit in the set of the selected units is exchanged for another unit, which is not currently selected. Experiments show that for the current data set, each individual metric can be efficiently optimised within 100 generations. As the computational complexity of this operation is very low, we run evolution for 500 generations (takes about one second on modern computer) for each board creation. Assigning equal importance (weight 1/3) to all three criteria typically results in an increase of combined fitness from around 0.2 to around 0.4, and an increase in all three separate metrics. F. Card creation The final step is to create cards based on the generated streets. In the prototype game, several templates for cards are created, which include variables to be filled when the game board is created, such as You donate ?amount to the campaign of MP ?mp. For creating the cards related to members of parliament (MPs), data from DBPedia is used. This is done through a SPARQL query using the name of the local authorities and relevant properties used by DBPedia to represent these.10 The MP data is not available for all local authorities. G. Example runs We now present an example run to demonstrate the procedure of interacting with the system and some typical results thereof. We decided on a notion of a prosperous community as one where people look out for each other, behave orderly and don’t go out and cause trouble on the street after imbibing improper amounts of intoxicating liquids. (This notion of prosperity might or might not agree with any actual ideas held by the authors or by the general British public.) We therefore selected the indicators “Participation in regular volunteering” (and set its value to +1) and “Perceptions of drunk and rowdy behaviour as a problem” (−1). All of the three street selection criteria were given equal weight (1/3). The generated board looked like the following, ordered in clockwise direction (from lowest to highest price, with the price of each street in parentheses): • • • • • •
Group 0: Portsmouth (422), Manchester (429) Group 1: Southampton (430), Kingston upon Hull (460), Newcastle upon Tyne (461) Group 2: Birmingham (463), Norwich (475), Liverpool (484) Group 3: Bristol (486), Crawley (486), Plymouth (489) Group 4: Barrow-in-Furness (494), Leeds (499), Isles of Scilly (500) Group 5: Boston (515), Worthing (515), Isle of Wight (523)
10 We found that two different properties are used, which may be due to different representations being used in the Wikipedia infoboxes or due to the method used by DBPedia in gathering the data from Wikipedia: http://dbpedia.org/property/leaderName and http://dbpedia.org/ ontology/memberOfParliament
Group 6: Tunbridge Wells (553), Northumberland (554), York (571) • Group 7: Cornwall (592), Harrogate (622) Examples of generated Chance and Community Chest cards include: • Go back to Isle of Wight. • MP Simon Wright of Norwich grants you 75 Pounds to build playgrounds. • You donate 75 Pounds to the campaign of Chris Skidmore of Bristol. • Major renovations needed in the schools of Cornwall. Owner pays 50 Pounds. The composite fitness of this board is 0.36, based on a prosperity dispersion of 0.05, a geographical dispersion of 0.46 and an average notability of 0.56. We can see that that notability criterion is fulfilled in that most of the streets are so famous so that they are recognisable even to nonBritons like the authors. The geographical dispersion criteria can be seen in that the set includes geographical outliers such as Northumberland, the Isles of Scilly and Isle of Wight (the data set covers only England and Wales, not Scotland and Northern Ireland). The relative lack of fulfilment of the prosperity dispersion criterion can be seen in the quite low price difference between unprosperous Portsmouth (422) and prosperous Harrogate (622). Independent runs confirm that the prosperity dispersion criterion, for most indicator weightings, seems to be harder to fulfil than the other criteria; future work might use either a multiobjective evolutionary algorithm or the cascading elitism approach to address this. To provide some context, Portsmouth is a city of about half a million, including a large port and a naval base. It has the highest population density in England and numerous nightclubs. Harrogate is a dormitory town and tourist destination, famous for its spa; it has some of the highest property prices in the country. Harrogate has won several British and international horticultural competitions. Portsmouth has been named by the BBC as the worst town in Britain for sexual assaults. A mock-up of a Monopoly board based on the result from another example run, where geographical dispersion was not taken into account, is shown in Figure 3. •
H. Evaluating the game The current version of Open Data Monopoly is yet to be evaluated. An evaluation may address questions such as: • Experienced enjoyability, ease of use, and sense-making. • What kinds of selections are made at the indicator level? How are weights set? • If a social element is added: What kinds of game boards and cards get shared, with what kinds of comments? More complicated to evaluate is the ideological effect of forcing the data into the rigid format of Monopoly, where it is implied that there are always drastic price differences between the streets in a city. In this context, it becomes relevant that Monopoly was originally designed as a persuasive game with a clear political agenda. Perhaps the practice of making data
2012 IEEE Conference on Computational Intelligence and Games (CIG’12)
294
be made. We have also described a very simple piece of software – more a novel procedural content generator than a game in its own right – which we call Open Data Monopoly, and which integrates demographical and political information from different sources to create an endless supply of realitybased Monopoly boards, allowing the player to choose what aspects of the data that matter. While the research is clearly in an early, explorative phase, we believe that this is a timely, important and potentially very fertile research direction. VII. ACKNOWLEDGMENTS This research was supported in part by the Danish Research Agency project AGameComIn, project number: 274-09-0083. Fig. 3. Graphical illustration of a board based on the results of a run of an early version of the generator.
games might spur renewed debate about the ideology inherent in game designs. I. Extending Open Data Monopoly The prototype we have described is only scratching the surface of what can be done, even with this simple game and publicly available demographical and political data. A natural next step is to develop a Web version of the game board generator, making it accessible to more people and also enabling us to collect data on how it is used. One possible way of extending this prototype is to include sentiment analysis of news when generating the Chance and Community Chest cards. Here news sites could be mined for topics related to, for example, the local authorities and their MPs. A positive event could then generate a Chance card from which the player wins money. Another possibility is to use indicators for countries, rather than local authorities, when generating the Monopoly board. One variation of this is to use time series data for the indicators, to illustrate changes over time. One could, for example, cluster the countries into different “street groups”, where the street groups can become large or smaller over time as countries join or leave an indicator value cluster. More finegrained data, for example credit ratings or tax records based on post codes, would make it possible to create streets from actual streets. In the current version of our generator, railroad stations and utilities are not generated. In a future version, these board elements could be generated after letting users choose principles for selecting among transport hubs. These could include traffic volume, proximity to selected streets, notability, Skytrax ratings etc. Utilities could similarly be chosen based on market value, number of customers, proximity etc.
R EFERENCES [1] T. Berners-Lee. Linked-data design issues. W3C design issue document, 2009. [2] C. Bizer, J. Lehmann, G. Kobilarov, S. Auer, C. Becker, R. Cyganiak, and S. Hellmann. Dbpedia - a crystallization point for the web of data. Web Semantics, 7:154–165, September 2009. [3] I. Bogost. Persuasive Games: the Expressive Power of Videogames. MIT Press, Cambridge, MA, USA, 2007. [4] T. Davies. Open data, democracy and public sector reform. a look at open government data use from data.gov.uk. Master’s thesis, University of Oxford, 2010. [5] L. Ding, J. Michaelis, D. L. McGuinness, and J. Hendler. Making sense of open government data. In Proceedings of the WebSci10: Extending the Frontiers of Society On-Line, 2010. [6] T. Heath and C. Bizer. Linked Data: Evolving the Web into a Global Data Space. Morgan & Claypool, 1st edition, 2011. [7] C. Macklin, J. Wargaski, M. Edwards, and K. Y. Li. DATAPLAY: Mapping game mechanics to traditional data visualization. In Proceedings of DiGRA, 2009. [8] J. McGonigal. Reality is broken: Why games make us better and how they can change the world. Penguin Press, 2011. [9] D. Michael and S. Chen. Serious games: Games that educate, train, and inform. Muska & Lipman/Premier-Trade, 2005. [10] U. Ritterfeld, M. Cody, and P. Vorderer. Serious games: Mechanisms and effects. Taylor & Francis, 2009. [11] H. Rosling. Visual technology unveils the beauty of statistics and swaps policy from dissemination to access. Statistical Journal of the IAOS: Journal of the International Association for Official Statistics, 2007. [12] R. Smelik, T. Tutenel, K. J. de Kraker, and R. Bidarra. A declarative approach to procedural modeling of virtual worlds. Computers and Graphics, 35:352–363, 2011. [13] G. Smith, J. Whitehead, and M. Mateas. Tanagra: A mixed-initiative level design tool. In Proceedings of the International Conference on the Foundations of Digital Games, 2010. [14] T. Susi, M. Johannesson, and P. Backlund. Serious games–an overview. Sk¨ovde: University of Sk¨ovde (Technical Report HS-IKI-TR-07-001), 2007. [15] J. Togelius, M. Preuss, N. Beume, S. Wessing, J. Hagelb¨ack, and G. N. Yannakakis. Multiobjective exploration of the starcraft map space. In Proceedings of the IEEE Conference on Computational Intelligence and Games (CIG), 2010. [16] J. Togelius, G. N. Yannakakis, K. O. Stanley, and C. Browne. Searchbased procedural content generation: a taxonomy and survey. IEEE Transactions on Computational Intelligence and AI in Games, 3:172– 186, 2011. [17] G. Yannakakis and J. Togelius. Experience-driven procedural content generation. IEEE Transactions on Affective Computing, In press, 2011.
VI. C ONCLUSIONS We have defined data games, tried to explain why they are needed, and discussed what they could be and how they could
2012 IEEE Conference on Computational Intelligence and Games (CIG’12)
295